Projects:2014S1-51 Heart Signal Processing Software for Evaluating Pacemaker Effectiveness
Cardiac Resynchronization Therapy (CRT) is a pacemaker therapy utilized in heart failure patients. Ineffective biventricular pacemaker capture of the heart has been correlated with increased mortality. To date, no validated method exists to accurately quantify bi-ventricular capture in CRT patients. The aim of this project was to use machine learning to develop software capable of accurately quantifying biventricular pacemaker capture in 24 hour 12-lead ECG from CRT patients.
Contents
Project information
Background
Electrocardiogram(ECG)
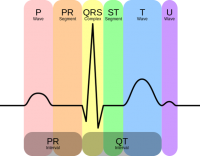
ECG is a heart signal which records the electrical impulse generated by heart using wires and electrodes on the chest. A single normal heartbeat ECG waveform is shown below [1].
Heart Rhythm Problems
Nowadays, many people suffer from heart rhythm problems. This normally means the patients have permanent abnormal heart rhythms (also known as arrhythmias), which also means the patients have irregular heart beating, heart might beating too fast, too slow, or skipping heart beats etc. [2]
Arrhythmias are really dangerous for the patient, it could cause the patient to[2]:
- Feel dizzy or light- headed
- Have sudden shortness of breath
- Experience fainting or sudden loss of consciousness
Cardiac Resynchronisation Therapy (CRT)
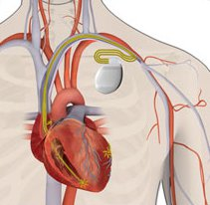
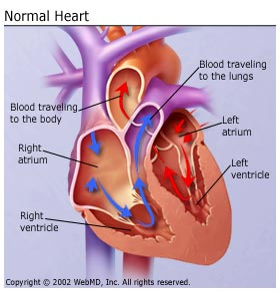
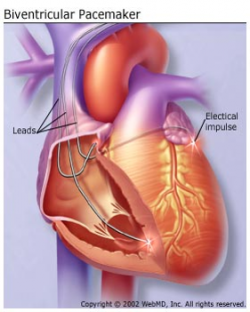
CRT is used for treating arrhythmias. The CRT system is also called bi-ventricular pacemaker [3]. Differs to the typical pacemakers, which is only pace the right ventricle to control the heart rate[3]. BiV pacemaker is used to control the heart rate by pacing both two ventricles simultaneously to improve the contraction of both ventricles[3].
Significances
In the medical paper[4], it identified that the pacing counter in the pacemaker has overestimated the effective BiV pacing in the patients with heart rhythm problems. Not all the BiV pacing are captured by the patient. There are four types of heartbeat morphology which could appear in the ECG recording. Those four types include BiV paced, Fusion, Ectopic and Native beats. The effective pacing is defined as over 90% BiV paced heartbeats in ECG recording. The significance of the project is to make a software for medical research to estimate the effectiveness of a BiV pacemaker by identifying the percentage of BiV paced heartbeats in one recording. Typically, one recording is around 24 hours, which includes approximately 100,000 heartbeats.
Project Aim
Although in the market, there already have many commercial ECG holter system exist, such as Sorin holter ecg system. However, most of them can only analysis the ECG signal using 2 channels. The aim of this project is to produce a new software that can analysis the ECG signal using 12 channels with following objectives:
- Design and produce a software application for ECG feature extraction and classification to evaluate the effectiveness of a BiV Pacemaker
- Identify the main characteristics of each single heartbeat ECG signal
- Classify each heartbeat into one of four different types which are Biventricular paced beat, Fusion beat, Ectopic beat and Native beat
Key Requirements
Minimum Requirements
- Identify the percentage of Biventricular paced beats
- User interface software program which will be applied to view the recording, to define heartbeat types, to review the classified results and correct heartbeat type manually
Extended Requirements
- Identify the percentage of all four types heartbeats which includes Native, Fusion and Ectopic beats
Tool Specification
In this project, Matlab and LabVIEW are used in development of the application. Matlab is mainly used for ECG signal processing. LabVIEW is mainly used for developing graphic user interface.
System Overview
The system is divided into five modules, which are User Recording Review, Heartbeat Types Definition, Heartbeat Feature Extraction, Heartbeat Classification and Results Review and Update. The system overall data flow is shown in program flow chart below. First User Recoding Review allows user to review the selected ECG recording. Next, Heartbeat Types Definition is used for user to define the heartbeat types exist in the recording by using the ECG signal information from previous step. Next, Heartbeat Feature Extraction is used for extracting features of all heartbeats in the recording. Then, Heartbeat Classification uses the heartbeat type definition and the features of all heartbeats to classify each heartbeat into one of user defined types. In the last, Results Review and Update is used to display and update the classification results.
Methodology
User Recording Review
User Recording Review module allows user to review a selected whole ECG signal recording. Both Matlab and LabVIEW are used to develop this module. This module allows user to choose an ECG recording and its corresponding R-peak file through file path, then the 12-channel ECG signal and R-peak position of each heartbeat can be plotted in the graph and display in the interface. This module allows the user to load a period time of the whole recording signal by setting the plot signal length in time, suggest to within 1 hour, and user be able to scroll through the signal with increment by hours, minutes or seconds. The ECG starting time can be set automatically or manually. The module also allows user to select wanted channels to display.
Heartbeat Types Definition
Heartbeat Types Definition module allows user to select single heartbeats from the signal which contains 12 channels which is obtained from the ECG recording review module, and define its heartbeat type, then it allows user to save the chosen and defined heartbeats information into a matrix as templates for heartbeat classification modules, which includes its R-peak time, its index position in the whole signal and the user defined heartbeat type. Binary search is used to find the R-peak time correlated with the select heartbeat in the R-peak file, the window start time of the chosen heartbeat will be the reference time to find the R-peak time of the heartbeat. The next closest R-peak time compare to the window start time will be considered as the target heartbeat R-peak time. If the target heartbeat has been saved, the target heartbeat will be found in the matrix and only the type will be updated. It also allows the user to review the selected heartbeat, which follows the previous two modules. The user is able to view all the heartbeat information that saved in the matrix, such as display the heartbeat in the graph from the previous heartbeat R-peak to the following heartbeat R-peak and the type of this heartbeat. The delete function is available for user to delete any of the heartbeats in the matrix.
Heartbeat Feature Extraction
Heartbeat Feature Extraction is implemented to extract features of each heartbeat in the whole ECG recording. This module is a integrate module of Matlab and LabVIEW. It takes the inputs from previous module in LabVIEW, then analysis in Matlab. The outputs are passed into next module. There are 90 features extracted for each heartbeat, which includes the frequencies features contains in ECG QRS segment, the area under the ECG signal curve and R-R interval period.
Fixed Length Window
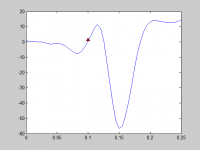
QRS complex of a single heartbeat ECG signal become the concentration of feature extraction. To ensure that all the characteristics of QRS complex can be captured, a fixed length window is set to extract single beat basis on the window. The period for QRS complex is typically larger than 120 ms. The fixed length window is set according to the R peak which is the fiducial point. In order to decide the length, one random heartbeat was plotted with R peak as shown in figure below. The red point represents the location of R peak from the given annotation file. It is manifest that the R-peak is not accurate enough. Therefore we used a window starting about 100 ms (20samples) before the critical point and ending 150 ms (30 samples) after the same fiducial point. So QRS complex for each single heartbeat can be extracted.
Feature Extraction of Area
To identify the difference of width and amplitude in the waveform of heartbeats, the area of heartbeat can be applied. The method to calculate the area is integration. It divide signal into small period and multiply the small period with corresponding amplitude. The sum of these multiplications becomes the result of area.
Feature Extraction of Frequency Spectrum
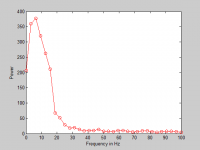
The reason to measure the frequency spectrum is that according to Minami et al. [5], supraventricular complexes are with broad spectral distribution and high frequency as about 20Hz. The comparison of the frequency spectrum can helps to find the similarity between two the 13 heartbeats. Because signal will be filter before analysis and the bandwidth of the filter is 2Hz to 30Hz, the characteristics of frequency spectrum will be acquired from 2Hz to 25Hz. It means that there will be 8 extracted features for a single heartbeat in one channel as shown in below.
Feature Extraction of R-R period
The interval between R peaks can provide indication of abnormal time sequence of the heartbeats thereby helping to identify abnormal beats [6]. Those R-R period are provided in annotation files which can directed applied into the feature array. There are three different R-R period defined.
RR1: the interval between the previous beat and the one before it
RR2: the interval between the evaluated beat and the previous beat
RR3: the interval between evaluated beat and the next beat
The ratio of RR2 over RR1 and RR2 over RR3 are utilised as two features to help to identify the ectopic heartbeats and store into the feature array.
Heartbeat Classification
Heartbeat Classification is used for classify each of the heartbeat in the recording into the user defined types. It takes the features of user defined heartbeats to train the learning machine, then classify each of the heartbeat in the recording after based on its features. The output result is the classified type array, and it is used in next module.
A large number of classification methods have been developed these days. In Song’s paper [7], they compared Support Vector Machine (SVM) with different classification methods and concluded that SVM has the advantage of solid performance in solving the ECG signal. So SVM is selected as classification method.
Support Vector Machine
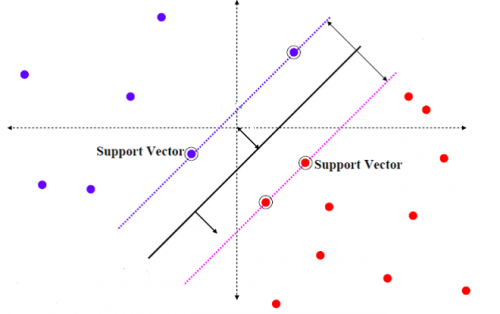
SVM is one of method for the machine learning. The training algorithm of SVM is to create a hyperplane by maximising the margin between the hyperplane and the training data [8]. As shown in figure below, there are two different group of points. SVM can define support vectors from training data and create a hyperplane to separate different types.
After learning the hyperplane, SVM can classify the information into correct type. One of the drawbacks in this method is that SVM’s original is designed for binary-class classification [9]. Bur this project aims to classify four different types of heartbeats. To achieve Multiclass Support Vector Machine (M-SVM), combination of SVM needs to be used. In this project, the decision is made to use the MSVMpack1.5 which was programmed by F. Lauer to operate classification.
Kernel Parameters
In this project, the kernel function is chosen as the common kernel, Gaussian radial basis function (RBF). Therefore, there are two kernel parameters which need to be define. They are parameter C and parameter P. Parameter C controls the tradeoff between margin maximisation and error minimisation [10]. In other others, a small C makes the decision surface smooth thereby allowing misclassification, while a large C constraintly classifying all training data correctly.Regarding to parameter P, it defines the distance of between different types [10]. When parameter P is close to zero, all different classes will mutually perpendicular . On the other hand, all classes will close to a fixed point as parameter P tends to infinite.
Optimal Parameters Test
Because different parameters lead to different accuracy, a script was developed to find the optimal parameters for M-SVM. Before test the parameters and M-SVM, the ‘gold standard’ need to be set first. No classified ECG recording which put emphasis on Native beat, Biventricular beat, Fusion beat and Ectopic beat can be found. And ECG data for this project comes from Sorin Holter system without classification. Therefore, two users (one is the co-supervisor Anand and the other one is Anthony who comes from Sorin Company) were required to manually classify two ECG recordings. The interesting thing is that the classifications by different people comes to slightly different results. The similarity percentage between two users is about 96%.
To find the optimal parameters, 50 heartbeats for each type were chosen as training data. Using two for loops in Matlab, each combination of parameter C and parameter P was applied to train the data. After each training, the training model was utilised to predict types and classify whole ECG recording into four types. Then, the percentage for correct classification was calculated and stored into a matrix.
By comparing the test results for different files, it is manifest that the optimal parameter for C and P still has some deviations. The balance optimal parameter will need to be taken into consideration.
Besides, for the file named AUADE02-0022, it is astonished that accuracies of all types of heartbeat exceed 90%. After applied the optimal parameters to M-SVM, the results are shown below:
Test performance
Confusion matrix:
Recognition rate: 95.23 %
First row: Native heartbeat
Second row: Biventricular paced heartbeat
Third row: Fusion heartbeat
Forth row: Ectopic heartbeat
The accuracies for Ectopic and Fusion is fairly high. But the misclassifications of Native and Biventricular paced heartbeats affect Ectopic and Fusion heartbeat significantly. For Fusion beat, there are approximate 3500 heartbeats misclassified into it and the total number of Fusion beat is only around 1400. The same situation occur in Ectopic beats.
Results Review and Update
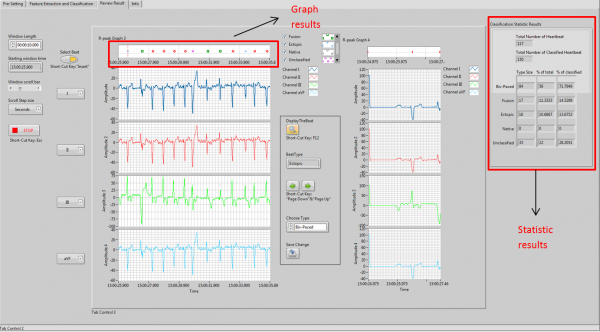
Results Review and Update module displays the graph and statistic results using the classification results from previous module. It allows user to select and review single heartbeat; and change the misclassified results; and updates the graph and statistic results simultaneously.
Project Outcomes
The project have achieved all the project objectives. The minimum requirements and partially extended requirements have been accomplished.
Classification results
The proposed methods have been verified by comparing classification results from the developed application with "Gold Standard" from two recordings and the accuracy percentage of each heartbeat type are shown in the table below. The "Gold Standard" is manual classified results.
Application user interface
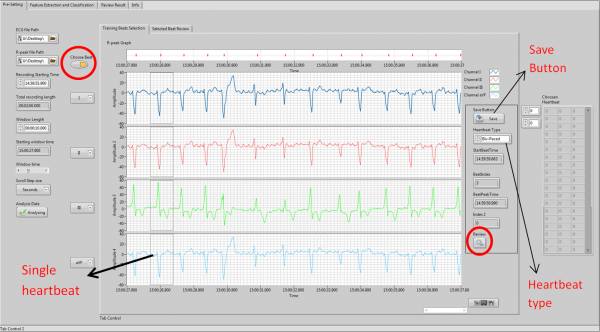
The developed graphic user interfaces are shown below.
User Interface for first two modules
User can enter this module by press the “Choose beat” button and save the heartbeat by press the “Save Button”.
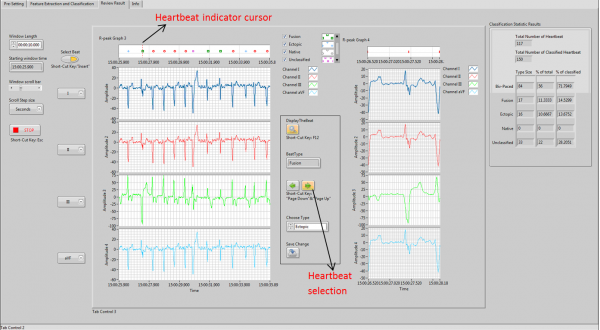
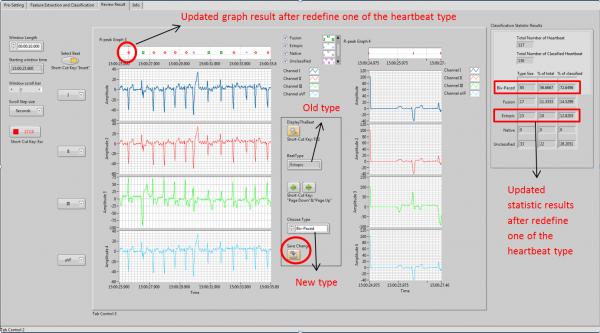
User Interface for Results Review and Update module
Heartbeat cursor indicating function is used to make an indication of which heartbeat that user interested in. Heartbeat selection function allows that user goes to previous and following heartbeat easily by press the “Previous” and “Next” buttons. Results update function is used change the type and update the graph and statistic results by press “Save Change” button. The operation steps are shown below.
Step 1
Step 2
Step 3
Team
Group members
- Ms Xiao Liu
- Mr Weiwen Chi
Supervisors
- A/Prof Mathias Baumert
- Dr Anand Ganesan
Resources
- Matlab
- LabView
- ECG data recordings from SORIN Holter ECG System
Awards
This project was awarded the "EEESAU Best EEE Project Wiki" at Ingenuity 2014.
References
[1] H. v. Helvete, “Normal ECG/EKG complex with labels,” 04 Mar. 2014. [Online]. Available: http://en.wikipedia.org/wiki/File:EKG_Complex_en.svg. [Accessed 14 Mar. 2014].
[2] Heart rhythm problem, Symptoms & Diagnosis. [online]. Available: Heart Rhythm Society, http://www.hrsonline.org/Patient-Resources/Symptoms-Diagnosis#axzz3FcOhmSqs [Accessed: 8 Oct. 2014].
[3] heartfailurematters, Cardiac Resynchronisation Therapy (CRT). [online]. Available: heartfailurematters, http://www.heartfailurematters.org/en_GB/What-can-your-doctor-do/Cardiac-Resynchronisation-Therapy-CRT [Accessed: 21 Mar. 2014].
[4] G. S. Kamath, D. Cotiga, J. N. Koneru, A. Arshad, W. Pierce, E. F. Aziz, A. Mandava, S. Mittal and J. S. Steinberg, “The Utility of 12-Lead Holter Monitoring in Patients With Permanent Atrial Fibrillation for the Identification of Nonresponders After Cardiac Resynchronization Therapy,” J. American College of Cardiology, vol. 53, No.12, 2009
[5] Minami, K., H. Nakajima, and T. Toyoshima, Real-time discrimination of ventricular tachyarrhythmia with Fourier-transform neural network. IEEE Trans. Biomed. Eng.46:179–185, 1999.
[6]Krasteva V, Jekova I., QRS template matching for recognition of ventricular ectopic beats. Ann Biomed Eng 2007; 35:2065-76.
[7] Song, MH., Lee, J., Cho, SP, Lee, KJ., and Yoo, SK., “Support Vector Machine Based Arrhythmia Classification Using Reduced Features,” International Journal of Control, Automation, and Systems, vol. 3, no. 4, pp. 571-579, December 2005.
[8]KuoPingWu and ShengDe Wang., “Choosing the kernel parameters for support vector machines by the inter-cluster distance in the feature space,” Pattern Recognition, vol. 42, pp. 710-717, 2009.
[9] HyunChul Kim, Shaoning Pang, HongMo Je,Daijin Kim and Sung-Yang Bang, “Support Vector Machine Ensemble with Bagging,” Springer-Verlag Berlin Heidelberg, 2002.
[10] Chapelle, O. , Vapnik, V. , Bousquet, O. , Mukherjee, S., “CHOOSING MULTIPLE PARAMETERS FOR SUPPORT VECTOR MACHINES,” Machine Learning, vol.46(1-3), pp.131-159, January 2002.
