Difference between revisions of "Projects:2017s2-291 Measurement of Transformer Parameters"
(→Method) |
(→Data analyzing) |
||
| (40 intermediate revisions by 3 users not shown) | |||
| Line 1: | Line 1: | ||
| + | =Members= | ||
| + | Yiwei Sun | ||
| + | |||
| + | Zhouyajie xu | ||
| + | |||
| + | Zhi Li | ||
| + | |||
| + | supervisor: Andrew Allison | ||
| + | |||
=Introduction= | =Introduction= | ||
A transformer is an electrical device based on Faradays’ law of electromagnetic induction to change alternating voltage, such as increasing or reducing voltage. We are interested in transformer in this project because it is widely be used in power industrial and essential for power transmission over long distance in power grid. Knowing parameters inside transformer will help us understanding the structure of transformer more clearly, and the method used to predict parameters inside transformer is useful for further study measurement which non-linear input and output. | A transformer is an electrical device based on Faradays’ law of electromagnetic induction to change alternating voltage, such as increasing or reducing voltage. We are interested in transformer in this project because it is widely be used in power industrial and essential for power transmission over long distance in power grid. Knowing parameters inside transformer will help us understanding the structure of transformer more clearly, and the method used to predict parameters inside transformer is useful for further study measurement which non-linear input and output. | ||
| Line 6: | Line 15: | ||
This project is trying to using figure2 to match with figure 1. In another word, comparing our reality measurement of transformer with the theoretical model and analysis error between them. | This project is trying to using figure2 to match with figure 1. In another word, comparing our reality measurement of transformer with the theoretical model and analysis error between them. | ||
To summarize the aim of this project: | To summarize the aim of this project: | ||
| + | |||
• Analysis the model in figure 1.1, doing the rough test to get a rough 6 parameters. | • Analysis the model in figure 1.1, doing the rough test to get a rough 6 parameters. | ||
| + | |||
• Substitute these rough parameters into transformer model for open circuit, short circuit and cross circuit of transformer to get these input impedance which record as Zin_model | • Substitute these rough parameters into transformer model for open circuit, short circuit and cross circuit of transformer to get these input impedance which record as Zin_model | ||
| + | |||
• Measuring the open, short and cross circuit use transformer in figure 1.2 to get input impedance of measure Zin which record as Zin_measure. | • Measuring the open, short and cross circuit use transformer in figure 1.2 to get input impedance of measure Zin which record as Zin_measure. | ||
| + | |||
• Error analysis between Zin_model and Zin_measure, then optimize error and get final 7 parameters result. | • Error analysis between Zin_model and Zin_measure, then optimize error and get final 7 parameters result. | ||
| Line 15: | Line 28: | ||
=Method= | =Method= | ||
In order to get value of R and X, we measure input voltage and current from port A and port B as one terminal which shows in figure 3.1. From ohms law, the input impedance isZin =Vin/Iin. Splitting the real part and imaginary part of Zin to get R and X value respectively. R=real(Zin), X=imaginary(Zin). | In order to get value of R and X, we measure input voltage and current from port A and port B as one terminal which shows in figure 3.1. From ohms law, the input impedance isZin =Vin/Iin. Splitting the real part and imaginary part of Zin to get R and X value respectively. R=real(Zin), X=imaginary(Zin). | ||
| − | The one-port model which also known as choke is consist of a resistor and inductor. | + | |
| + | The one-port model which also known as choke is consist of a resistor and inductor. | ||
| + | |||
| + | [[File:Choke one port.png|400px]] | ||
| + | |||
| + | |||
| + | |||
Two-port model is more complicate than one port model, but the method we used to get parameters is similar as one-port model. Doing open circuit and short circuit for primary side (240V) of transformer and secondary side (24V) and two cross connection tests. Each case of these tests can be regard as one-port test and collect Vin and Iin for each test to calculate Zin based on ohms law. | Two-port model is more complicate than one port model, but the method we used to get parameters is similar as one-port model. Doing open circuit and short circuit for primary side (240V) of transformer and secondary side (24V) and two cross connection tests. Each case of these tests can be regard as one-port test and collect Vin and Iin for each test to calculate Zin based on ohms law. | ||
For sub-section Zin model, as we have 6 Zin for open circuit connection, short circuit connection and cross connection, we derive formula for these six Zin based on R1, X1, R2, X2, Rc and Xm then substitute rough parameters we get from section 4 into our derived formula. | For sub-section Zin model, as we have 6 Zin for open circuit connection, short circuit connection and cross connection, we derive formula for these six Zin based on R1, X1, R2, X2, Rc and Xm then substitute rough parameters we get from section 4 into our derived formula. | ||
| + | |||
| + | [[File:Two_port_test_box.png|400px]] | ||
| + | |||
| + | |||
| + | |||
For measured Zin, the setting up of equipment which including power analyser, oscilloscope for measurement and using varic for power supply. In order to keep current consistency, the Zin for cross connection should be discharged, thus we have 4 Zin to collect. We regarding 4 Zin which has same current as a group, we measure 11 times to get 11 groups of Zin. Actually we have done a lot measurements for these 6 Zin, but only these 11 groups of Zin has the consistency current and useful, I will demonstrate specifically in this sub-section of measured Zin. | For measured Zin, the setting up of equipment which including power analyser, oscilloscope for measurement and using varic for power supply. In order to keep current consistency, the Zin for cross connection should be discharged, thus we have 4 Zin to collect. We regarding 4 Zin which has same current as a group, we measure 11 times to get 11 groups of Zin. Actually we have done a lot measurements for these 6 Zin, but only these 11 groups of Zin has the consistency current and useful, I will demonstrate specifically in this sub-section of measured Zin. | ||
The sub-section Matlab method is mainly about the method and approach for data analysis. | The sub-section Matlab method is mainly about the method and approach for data analysis. | ||
| − | = | + | [[File:flow of data.png|400px]] |
| − | + | ||
| − | + | =Data analyzing= | |
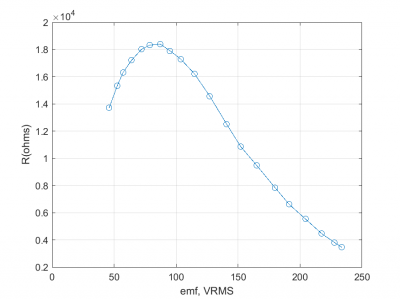
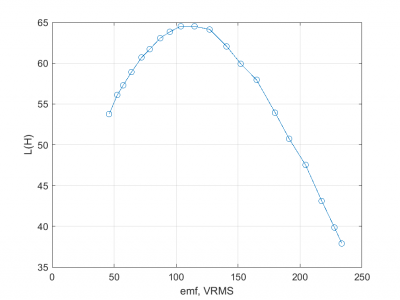
| − | + | To obtain the overall variation of the impedance and to avoid damage to any of the devices, the input voltage range for all AC tests was as large as it could be possible. The Matlab file saturation.m programming for accumulate impedance and plot the curve. From these two curves, it is clear that the impedance of first circuit is varying with the condition of operation with a trend similar to that of the PMG choke. The resistance and reactance didn’t reach the peak value at the same time as well. However, there is no air gap in the two-port transformer and that is the reason why the impedance reached the peak value and decreased sharply instead of staying at the peak value for a wider voltage range. The peak of the curve is where the transformer reaches saturation. | |
| − | + | ||
| − | + | [[File:curve 1.png|400px]] | |
| − | + | ||
| − | + | [[File:curve 2.png|400px ]] | |
| − | + | ||
| − | + | =Findings= | |
| − | + | After data analysis, it was found that the average reactance numerical values of the linear parameters in a T model equivalent circuit strongly depend on the operating condition of the transformer. | |
| + | In addition, the following findings were made in this project: | ||
| + | |||
| + | • The impedance of a PMG choke does not stay constant after reaching the maximum value during varying operating conditions. | ||
| + | |||
| + | • The equivalent circuit of a PMG choke is not only a resistor and an inductor in series. Or there are huge error occurred during measurement. | ||
| + | |||
| + | • Resistance and reactance do not reach the peak value in the same operating condition. | ||
| + | |||
| + | • Impedance of a transformer remains constant if the current through its windings is maintained at the same value. | ||
| + | |||
| + | • Resistance slightly depends on the operating condition after saturation. | ||
| + | |||
| + | =Conclusion= | ||
| + | This project first sought to measure current through the transformer windings more accurately and to reduce the influence of signals from outside the experiment, operating sensors near the limits of their ranges, and non-linearity in the sensors. After dealing with these external factors and getting accurate values for the current, the project aimed at figuring out the impedance of transformer more accurately. However, during data processing, the impedance was found to be varying under different operating conditions. Hence, there was a need to explore further the characteristics of the impedance of the transformer. After several tests and analysis of the results, it was found that the impedance of parameters in a T-model equivalent circuit of a transformer depends a lot on the operating condition of the transformer. | ||
| + | |||
| + | =Further work= | ||
| + | In future, there are still several problems that need to be addressed. For instance, there is a need to determine the ideal equivalent circuit of the PMG choke. Additionally, investigations should be conducted on the PMG choke to determine why no saturation reflects on any of its curves yet it has an air gap. Finally, because for a transformer it is hard to modify the operating condition of a transformer to a specified value by using a variac or a signal generator with an amplifier, research is needed to determine what device can provide reliable input voltage source for the measurement of parameters | ||
| + | |||
| + | =References= | ||
| + | [1] Chandima de Silva, “Measurement and Estimation of Transformer Parameter”, | ||
| + | School of Electrical and Electronic Engineering, University of Adelaide, SA, 2014. | ||
| + | |||
| + | [2] David Nguyen Minh, “Measurement and Estimation of Transformer Parameter”, | ||
| + | School of Electrical and Electronic Engineering, University of Adelaide, SA, 2014. | ||
| + | |||
| + | [3] Kartthikeyen Sivananthan, “Estimation of Transformer Parameters”, School of | ||
| + | Electrical and Electronic Engineering, University of Adelaide, SA, 2015. | ||
| + | |||
| + | [4] Rahel Bekele Megersa, “Measurement of Transformer Parameters”, School of | ||
| + | Electrical and Electronic Engineering, University of Adelaide, SA, 2016. | ||
| + | |||
| + | [5] “Project Proposals, Semester 2 2017”, School of Electrical and Electronic | ||
| + | Engineering, University of Adelaide, SA, 2017. | ||
| + | |||
| + | [6] G.R.Slemon and A.Straughen, ELECTRIC MACHINES. 1st Edition. Addison-wesley, | ||
| + | 1982 pp20-35 | ||
| + | |||
| + | [7] Nurliyana Khazali, “Estimation of Transformer Parameters”, School of | ||
| + | Electrical and Electronic Engineering, University of Adelaide, SA, 2015. | ||
| + | |||
| + | [8 ] Wildi, T. (1997). Electrical machines, Drives, and Power Systems. 6th ed. pp.20- | ||
| + | 220 | ||
Latest revision as of 15:54, 5 June 2018
Contents
Members
Yiwei Sun
Zhouyajie xu
Zhi Li
supervisor: Andrew Allison
Introduction
A transformer is an electrical device based on Faradays’ law of electromagnetic induction to change alternating voltage, such as increasing or reducing voltage. We are interested in transformer in this project because it is widely be used in power industrial and essential for power transmission over long distance in power grid. Knowing parameters inside transformer will help us understanding the structure of transformer more clearly, and the method used to predict parameters inside transformer is useful for further study measurement which non-linear input and output. This project also improve our ability of dealing with model, how to fit expected model outcomes with reality outcomes and how to analysis and minimize errors between them.
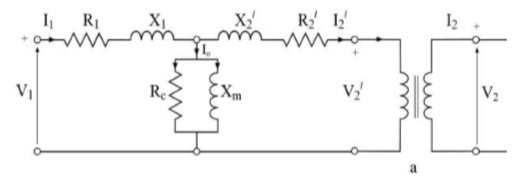
The aim of this project is mapping the transformer device in figure1.2 with the model of equivalence circuit to get 7 parameters value inside transformer model as “accurate” as possible. This project is trying to using figure2 to match with figure 1. In another word, comparing our reality measurement of transformer with the theoretical model and analysis error between them. To summarize the aim of this project:
• Analysis the model in figure 1.1, doing the rough test to get a rough 6 parameters.
• Substitute these rough parameters into transformer model for open circuit, short circuit and cross circuit of transformer to get these input impedance which record as Zin_model
• Measuring the open, short and cross circuit use transformer in figure 1.2 to get input impedance of measure Zin which record as Zin_measure.
• Error analysis between Zin_model and Zin_measure, then optimize error and get final 7 parameters result.
Method
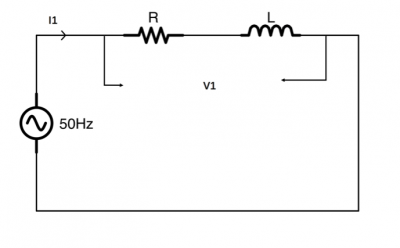
In order to get value of R and X, we measure input voltage and current from port A and port B as one terminal which shows in figure 3.1. From ohms law, the input impedance isZin =Vin/Iin. Splitting the real part and imaginary part of Zin to get R and X value respectively. R=real(Zin), X=imaginary(Zin).
The one-port model which also known as choke is consist of a resistor and inductor.
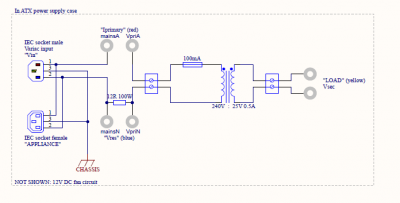
Two-port model is more complicate than one port model, but the method we used to get parameters is similar as one-port model. Doing open circuit and short circuit for primary side (240V) of transformer and secondary side (24V) and two cross connection tests. Each case of these tests can be regard as one-port test and collect Vin and Iin for each test to calculate Zin based on ohms law. For sub-section Zin model, as we have 6 Zin for open circuit connection, short circuit connection and cross connection, we derive formula for these six Zin based on R1, X1, R2, X2, Rc and Xm then substitute rough parameters we get from section 4 into our derived formula.
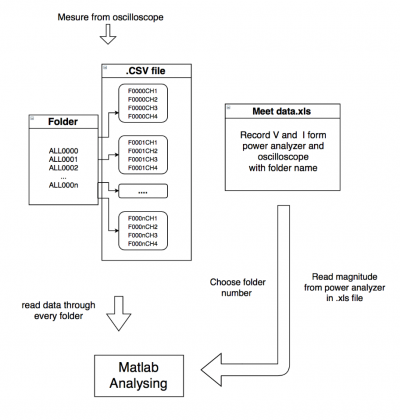
For measured Zin, the setting up of equipment which including power analyser, oscilloscope for measurement and using varic for power supply. In order to keep current consistency, the Zin for cross connection should be discharged, thus we have 4 Zin to collect. We regarding 4 Zin which has same current as a group, we measure 11 times to get 11 groups of Zin. Actually we have done a lot measurements for these 6 Zin, but only these 11 groups of Zin has the consistency current and useful, I will demonstrate specifically in this sub-section of measured Zin. The sub-section Matlab method is mainly about the method and approach for data analysis.
Data analyzing
To obtain the overall variation of the impedance and to avoid damage to any of the devices, the input voltage range for all AC tests was as large as it could be possible. The Matlab file saturation.m programming for accumulate impedance and plot the curve. From these two curves, it is clear that the impedance of first circuit is varying with the condition of operation with a trend similar to that of the PMG choke. The resistance and reactance didn’t reach the peak value at the same time as well. However, there is no air gap in the two-port transformer and that is the reason why the impedance reached the peak value and decreased sharply instead of staying at the peak value for a wider voltage range. The peak of the curve is where the transformer reaches saturation.
Findings
After data analysis, it was found that the average reactance numerical values of the linear parameters in a T model equivalent circuit strongly depend on the operating condition of the transformer. In addition, the following findings were made in this project:
• The impedance of a PMG choke does not stay constant after reaching the maximum value during varying operating conditions.
• The equivalent circuit of a PMG choke is not only a resistor and an inductor in series. Or there are huge error occurred during measurement.
• Resistance and reactance do not reach the peak value in the same operating condition.
• Impedance of a transformer remains constant if the current through its windings is maintained at the same value.
• Resistance slightly depends on the operating condition after saturation.
Conclusion
This project first sought to measure current through the transformer windings more accurately and to reduce the influence of signals from outside the experiment, operating sensors near the limits of their ranges, and non-linearity in the sensors. After dealing with these external factors and getting accurate values for the current, the project aimed at figuring out the impedance of transformer more accurately. However, during data processing, the impedance was found to be varying under different operating conditions. Hence, there was a need to explore further the characteristics of the impedance of the transformer. After several tests and analysis of the results, it was found that the impedance of parameters in a T-model equivalent circuit of a transformer depends a lot on the operating condition of the transformer.
Further work
In future, there are still several problems that need to be addressed. For instance, there is a need to determine the ideal equivalent circuit of the PMG choke. Additionally, investigations should be conducted on the PMG choke to determine why no saturation reflects on any of its curves yet it has an air gap. Finally, because for a transformer it is hard to modify the operating condition of a transformer to a specified value by using a variac or a signal generator with an amplifier, research is needed to determine what device can provide reliable input voltage source for the measurement of parameters
References
[1] Chandima de Silva, “Measurement and Estimation of Transformer Parameter”, School of Electrical and Electronic Engineering, University of Adelaide, SA, 2014.
[2] David Nguyen Minh, “Measurement and Estimation of Transformer Parameter”, School of Electrical and Electronic Engineering, University of Adelaide, SA, 2014.
[3] Kartthikeyen Sivananthan, “Estimation of Transformer Parameters”, School of Electrical and Electronic Engineering, University of Adelaide, SA, 2015.
[4] Rahel Bekele Megersa, “Measurement of Transformer Parameters”, School of Electrical and Electronic Engineering, University of Adelaide, SA, 2016.
[5] “Project Proposals, Semester 2 2017”, School of Electrical and Electronic Engineering, University of Adelaide, SA, 2017.
[6] G.R.Slemon and A.Straughen, ELECTRIC MACHINES. 1st Edition. Addison-wesley, 1982 pp20-35
[7] Nurliyana Khazali, “Estimation of Transformer Parameters”, School of Electrical and Electronic Engineering, University of Adelaide, SA, 2015.
[8 ] Wildi, T. (1997). Electrical machines, Drives, and Power Systems. 6th ed. pp.20- 220
