Difference between revisions of "Projects:2014s2-80 Swinging Crane Project"
(→1.1.Technical background) |
|||
| (269 intermediate revisions by 2 users not shown) | |||
| Line 1: | Line 1: | ||
| − | '''Project aim:''' Swinging Crane project is aim to transporting a payload from one place to another and reducing the consuming time as much as possible. | + | [[File:worst case example.gif|right]] |
| + | [[File:worst case example 2.gif|right]] | ||
| + | '''Project aim:''' Swinging Crane project is aim to transporting a payload from one place to another and reducing the consuming time as much as possible. Using the software of Simulink and ControlDesk on computer to create and simulate a system model. Through the hardware of dSPACE board, amplifier and simulator to realize practical control, which is move the trolley for 0.5 meters and count the consuming time from starting movement to fully settled. The outcomes are supposed to realize multiple control methods, which includes automatic and manual control. The system performance should be improved compared with last year results. This project also could be used for helping high school student to understand the principle of control systems. | ||
| + | == Project introduction == | ||
| − | == | + | === Technical introduction === |
[[File:Gantry_Crane_System.png|thumb|500px|Figure 1.Gantry crane system model]] | [[File:Gantry_Crane_System.png|thumb|500px|Figure 1.Gantry crane system model]] | ||
| − | + | Gantry cranes are wildly used in industry, for lifting heavy objects by a hoist which is fitted in a hoist trolley and can move horizontally on a rail or pair of rails fitted under a beam. | |
| − | + | There are two examples on the above shows 2 worst case in controlling the system. First example uses a large force applied on the trolley, leads the residual swinging angle at the end is very large and the system cost much time to settle. Second example uses small force to drive the trolley from start, but the trolley movement is too slow, which costs a lot of time either. In this project, we will concentrate on designing appropriate feed forward input to the system, and add controllers to help control the system motion, further improve the system performance. | |
Figure 1 demonstrates the model of swinging crane, the DC motor controls the trolley to horizontally move a load in a short distance. There are two encoders to record the data, one is the moving distance, and another is sway angle of the load. By giving a signal from operation control system, it will generate a DC current from a current source, then injecting it into a motor, which would drive the conveyor belt. There is a trolley placed on one side of the belt, and start moving towards another side. At the bottom of the trolley, using a rod stand for the hoist, connect with a load. At the start of transporting the loads, it will cause accelerated, corresponds to a traction force, effect on the trolley. There occur an angle between the rod and vertical. After the trolley stops, the loads may turn to oscillate. If the initial angle large, the oscillation duration roses, which is a potential risk to the people on the ground. | Figure 1 demonstrates the model of swinging crane, the DC motor controls the trolley to horizontally move a load in a short distance. There are two encoders to record the data, one is the moving distance, and another is sway angle of the load. By giving a signal from operation control system, it will generate a DC current from a current source, then injecting it into a motor, which would drive the conveyor belt. There is a trolley placed on one side of the belt, and start moving towards another side. At the bottom of the trolley, using a rod stand for the hoist, connect with a load. At the start of transporting the loads, it will cause accelerated, corresponds to a traction force, effect on the trolley. There occur an angle between the rod and vertical. After the trolley stops, the loads may turn to oscillate. If the initial angle large, the oscillation duration roses, which is a potential risk to the people on the ground. | ||
| − | [[File:System_structure_flow_chart.png| | + | The system is operated inside a flow, shown as Figure 2. Input signal is generated from Simulink, goes into the plant through dSPACE and amplifier. The outputs of the plant are measured by two encoders, and send back to dSPACE, finally transfer to the computer. The dSPACE and amplifier components will introduce later. The plant is the real model of the system, the transfer relationship is shown in Figure 3. The current flows into DC motor, which drives the belt on the grid. The trolley is bind on the belt, thus it has the same acceleration with the belt. There are two outputs from the, the trolley position and the swinging angle of the pendulum. |
| + | |||
| + | === Motivation === | ||
| + | |||
| + | [[File:System_structure_flow_chart.png|400px|thumb|right|Figure 2.System structure flow]][[File:Plant_structure_flow_chart.png|400px|thumb|right|Figure 3.Plant structure flow]] | ||
| + | |||
| + | The gantry crane system could be identified into separate sections: linear motion and swinging pendulum. The goal is to minimum the time used to transport loads and reduce the swinging oscillation as minimize as possible. | ||
| + | The pendulum was studied by Galileo, Huygens, Newton, Hooke and all the leading figures of 17th-century science. Since the long history on the study, pendulum theory has been almost perfect, but still exist imperfection in applied to practical. In this project, the basic model is simple gravity pendulum. To analyze the motion parameters of pendulum, Newton’s classical mechanics Laws are applied. In traditional education, Newton’s lows are taught in high-school physics lecture. The theorem is abstract to student, and divorced from the practical application. The gantry crane system is a representative application, and easy to understand, thus it is suitable for demonstration teaching purpose. | ||
| + | |||
| + | === Objectives === | ||
| + | The aim of swinging crane project is to demonstrate research component of project, examine and improve last year’s project, perform analysis, show understanding of theoretical principles, simulations and experiments, then improve system robustness, calculating instantaneous energy and optimize system motion trajectories. The 5 objectives of this project are shown as bellow: | ||
| + | |||
| + | 1.Modelling of system – physical principles, approximates which can be used to simplify model (e.g. linearized model). | ||
| + | |||
| + | 2.Selection of reference trajectories-trade-offs, constraints, optimization. | ||
| + | |||
| + | 3.Calculation and control of “energy” stored in pendulum-means for damping energy. | ||
| + | |||
| + | 4.Simulation of system- investigates and checks performance. | ||
| + | |||
| + | 5.Experimental demonstration- interfacing operation, model verification. | ||
| + | |||
| + | == Background == | ||
| + | === Crane system === | ||
| + | The crane system model can be dismantled into 2 parts: a pendulum subsystem with fixed trolley position and a free trolley position while there is no pendulum oscillation drive by a DC motor. The system control methods including feed forward control and feedback control. | ||
| + | |||
| + | === Feed forward/open-loop control === | ||
| + | Feed forward control can change the system output directly through a per-defined path. Feed forward control is usually used with feedback control since a feedback control system is required to track set point changes and to suppress unmeasured disturbances in system response. In system theory, reference input is necessary to control the plant, and how to set an appropriate input signal is difficult. | ||
| + | Moreover, there exists a lot of methods for optimal input-shaping, which is aim to improve system performance through system input, instead of controller. This usually has more obvious effect than the feedback control. | ||
| + | |||
| + | === Feedback/closed-loop control === | ||
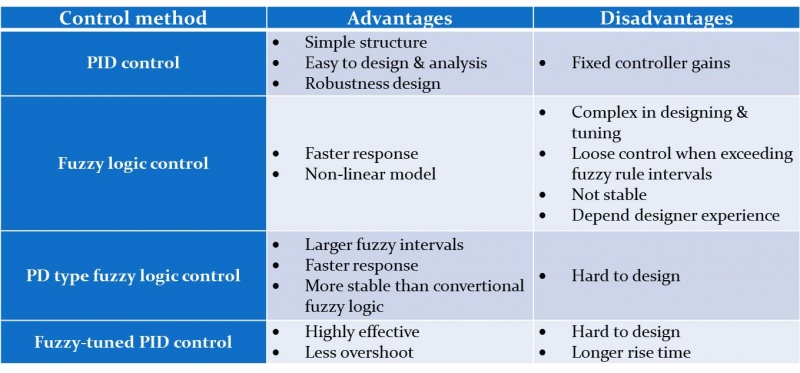
| + | [[File:Table of control methods comparison.jpg|800px|thumb|center|Table 1.Control methods comparison]] | ||
| + | |||
| + | == Previous work == | ||
| + | The swinging crane real system is designed by the workshop of University of Adelaide. Some analysis has been done by previous group, a simple PID control and current manual control have also been developed. Thus some data of the model could use by directly looking up their reports. | ||
| + | |||
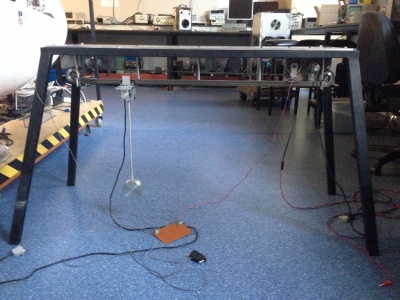
| + | Figure 4 gantry crane system is studied by last year project group. This model is based on lumped-mass model, which ignore the mass and the elongation of the rod caused by the tension force. Both of the trolley and payload are considered as point mass and moving in two-dimensional x-y plane. | ||
| + | |||
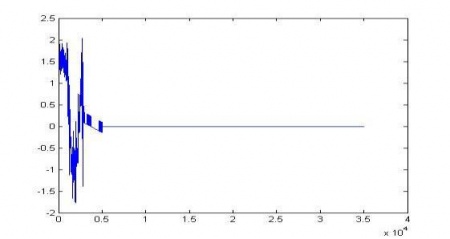
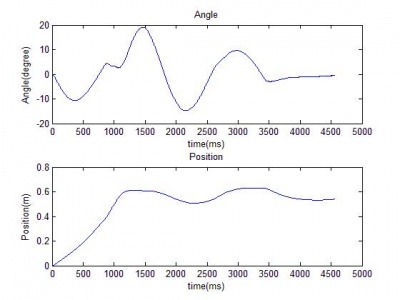
| + | The system total settling time from last year is 4.566s. The system input signal is as Figure 5. The system response and ControlDesk results are shown in Figure 6. | ||
| + | |||
| + | {| border="0.5" | ||
| + | | valign="center"| | ||
| + | [[File:Gantry Crane model in lab.JPG|400px|thumb|right|Figure 4.Gantry Crane model in lab]] | ||
| + | | valign="center"| | ||
| + | [[File:Feed forward current input design.png.jpg|thumb|left|450px|Figure 5.Feed forward current input design]] | ||
| + | | valign="center"| | ||
| + | [[File:System simulation result.jpg|thumb|left|400px|Figure 6.System simulation result]] | ||
| + | |} | ||
| + | |||
| + | == System modelling == | ||
| + | |||
| + | === Simple pendulum model === | ||
| + | |||
| + | {| border="0.5" | ||
| + | |- | ||
| + | | valign="center"| | ||
| + | [[File:free_trolley_position_movement_anime.gif|left|Free trolley position movement anime]] | ||
| + | | valign="center"| | ||
| + | [[File:System_total_energy_variance.jpg|thumb|left|400px|Figure 7.System total energy variance example]] | ||
| + | |} | ||
| + | |||
| + | System total energy is the summation of kinetic energy of the trolley, the potential energy and kinetic energy of pendulum load. | ||
| + | The animation on the left shows a free-trolley-position movement demonstration without friction or air-drag. It shows the energy conservation law, which means the total energy is constant all over the time, and in this particular case the system kinetic energy is complementary to potential energy. Consider a trail of total energy in a system process, shows as Figure 5, in where T1 is the acceleration time period, T2 is the deceleration period and T3 is the remain oscillation period. The magnitude of system total energy in T3 is a constant value with frictionless assumption. The left animation illustrates the system remaining oscillation relationship in T3. | ||
| + | |||
| + | === System equations === | ||
| + | [[File:Instantaneous_velocity_analysis.png|300px|thumb|right|Figure 8. Instantaneous velocity analysis]] | ||
| + | |||
| + | According to Figure 6, the system total energy could be expressed as: | ||
| + | |||
| + | [[File:System total energy.jpg|400px]] | ||
| + | |||
| + | Taking the force relation, the system transfer function is | ||
| + | [[File:system nonlinear model_transfer function.png|300px]], | ||
| + | if the pendulum swing a small angle(i.e.less than 10 degrees), the above equations could be reduced to | ||
| + | [[File:system linear model_transfer function.png|150px]]. | ||
| + | |||
| + | By taking the Laplace transform, the system transfer function is | ||
| + | [[File:Laplace transform of linear transfer function.png|200px]]. | ||
| + | |||
| + | The above equations could also write as state-space model form. Assume the state variable [[File:State_variable.png|80px]], and state equation [[File:State_equation.png|80px]] the state matrices are [[File:SSM_A.png|170px]],[[File:SSM_B.png|55px]]and[[File:SSM_C.png|120px]]. | ||
| + | |||
| + | {| border="0.5" | ||
| + | |+'''System dynamic linear model block diagrams''' | ||
| + | |- | ||
| + | | valign="center"| | ||
| + | [[File:System_dynamic_linear_model_1.png|thumb|left|350px|Transfer function model 1]] | ||
| + | | valign="center"| | ||
| + | [[File:System_dynamic_linear_model_2.png|thumb|left|450px|Trasnfer function model 2]] | ||
| + | | valign="center"| | ||
| + | [[File:System_dynamic_linear_model_3.png|thumb|left|250px|State-space model]] | ||
| + | |} | ||
| + | |||
| + | == Control methods designing == | ||
| + | |||
| + | === PID control === | ||
| + | [[File:Nonlinear model PID feedback control2.png|500px|thumb|center|Figure 9.Nonlinear model PID feedback control system diagram]] | ||
| + | |||
| + | In this project the Figure 7 block structure is used. There are two PID controllers used to control the two state variables feedback. | ||
| + | The PID controller parameters are designed by selecting appropriate , and gains through analysing the root-locus diagrams and considering the system robustness. | ||
| + | |||
| + | ==== Inner-loop controller design ==== | ||
| + | {| border="0.5" | ||
| + | |- | ||
| + | | valign="center"| | ||
| + | [[File:P_controller_RLC.jpg|thumb|left|320px|P controller RLC]] | ||
| + | | valign="center"| | ||
| + | [[File:PI_controller_RLC.jpg|thumb|left|320px|PI controller RLC]] | ||
| + | | valign="center"| | ||
| + | [[File:PD_controller_RLC.jpg|thumb|left|320px|PD controller RLC]] | ||
| + | | valign="center"| | ||
| + | [[File:PID_controller_RLC.jpg|thumb|left|320px|PID controller RLC]] | ||
| + | |} | ||
| + | Observing from the above root-locus diagrams, PD controller has simple construction and enough to insure the stability of open-loop system.To ensure control system robustness, i.e. system is not sensitive to connector length l and load mass m changing, a robustness designing for inner-loop controller parameters is essential. | ||
| + | The inner-loop system robustness with above parameters will have the tolerance of connector length changing 10% (from 0.389m to 0.475m), mass of load changing 44% (0.308kg to 0.792kg). | ||
| + | |||
| + | ==== Outer-loop controller design ==== | ||
| + | {| border="0.5" | ||
| + | |- | ||
| + | | valign="center"| | ||
| + | [[File:position_PID_controller_design.jpg|thumb|left|450px|Figure 10.position PID controller design]] | ||
| + | | valign="center"| | ||
| + | [[File:position_PID_controller_design_bode.jpg|thumb|left|450px|Figure 11.position PID controller bode diagram]] | ||
| + | |} | ||
| + | The outer loop is designed using the Simulink built-in function, PID self tuning with considering the following conditions: | ||
| + | • Overshoot ≤ 5% | ||
| + | • Settling time ≤ 5s | ||
| + | • Steady state error ≤ ±1% | ||
| + | |||
| + | The outer loop PID controller response tuning design is shown as Figure 10. The tuning Bode diagram is shown as Figure 11. | ||
| + | |||
| + | {| border="0.5" | ||
| + | |- | ||
| + | | valign="center"| | ||
| + | [[File:PID control simulation.gif|right]] | ||
| + | | valign="center"| | ||
| + | [[File:PID control simulation result.jpg|thumb|250px|right|PID control simulation result]] | ||
| + | |} | ||
| − | The system is | + | === Fuzzy-logic control === |
| + | Fuzzy logic control is a rule-based control method. The controller is designed with a set of fuzzy rules for both input and output sides. Figure 12 shows the basic structure of a fuzzy control system. | ||
| + | |||
| + | {| border="0.5" | ||
| + | |- | ||
| + | | valign="center"| | ||
| + | [[File:Fuzzy_control_system_basic_structure.jpg|thumb|left|600px|Figure 12.Fuzzy control system basic structure]] | ||
| + | | valign="center"| | ||
| + | [[File:Fuzzy control system project structure.jpg|thumb|left|550px|Figure 13.Fuzzy control system simulation structure]] | ||
| + | |} | ||
| + | |||
| + | In classic control field, the precision of a control system modelling effects the system behaviour most. The dynamic information of the system state could help achieve the goal of accuracy control. However, the number of the state variables are too much for a complex system, and they may have influence to each other, thus it is difficult to describe the system state correctly. Fuzzy logic control uses the idea and theory of fuzzy algorithms to describe the system state. Fuzzy control is a nonlinear control method, and it also belongs to intelligent control branch. | ||
| + | In general, a control engineer will use classic algorithms (of the classic PD type, for example) if the system can be modelled and fuzzy algorithms (of the fuzzy PD type, for example) if the system cannot be modeled (or can only be partly modeled). | ||
| + | |||
| + | In this project, there are 4 state variables, which defined in previous. Based these variables, two fuzzy controllers are used. The system simulation diagram shows as Figure 13. | ||
| + | |||
| + | ==== Fuzzification design ==== | ||
| + | The fuzzyfication process uses fuzzy state variables to describe the system. Assume the state variables and control variable are: | ||
| + | {| border="0.5" | ||
| + | |- | ||
| + | | valign="center"| | ||
| + | [[File:Fuzzification errors.jpg|450px|center]] | ||
| + | | valign="center"| | ||
| + | [[File:Fuzzy rules bar.jpg|550px|thumb|center|Fuzzy rules bar]] | ||
| + | |} | ||
| + | |||
| + | The state variables considered can be positive, zero or negative, also can be large and small. Presume there are 5 quantified intervals set for input variables, in which are “negative large” (NL), “negative small” (NS), “zero” (ZR), “positive small” (PS) and “positive large” (PL). While there are 5 quantified regions set for output, in which are “large acceleration” (LA), “slight acceleration” (SA), “zero acceleration” (ZA), “slight braking” (SB) and “large braking” (LB), illustrates as the fuzzy rules bar. | ||
| + | |||
| + | ==== Fuzzy rules define ==== | ||
| + | The fuzzy rules are defined as term of Θ (ZR, PS; AS) for example. Table 7 presents the corresponding relationship of the angular error, the angular acceleration error and the correction output acceleration. Table 8 is the position rule matrix, similar as Table 7. The example rule could be interpreted with the following implication: | ||
| + | If the angular error εθ is NS and the variation of the angular error is NL, then the trolley acceleration Γ is LB. | ||
| + | |||
| + | {| border="0.5" | ||
| + | |- | ||
| + | | valign="center"| | ||
| + | [[File:Angle error fuzzy rules.jpg|thumb|left|150px|Figure 7.Angle error fuzzy rules]] | ||
| + | | valign="center"| | ||
| + | [[File:Position error fuzzy rules.jpg|thumb|left|150px|Table 8.Position error fuzzy rules]] | ||
| + | | valign="center"| | ||
| + | [[File:Maximum_method_example_Simulink_diagram.jpg|thumb|left|450px|Figure 14.Maximum method example Simulink diagram]] | ||
| + | |} | ||
| + | |||
| + | ==== Defuzzification design ==== | ||
| + | The process of selecting the output from the two fuzzy controllers is called defuzzification. There are several methods to achieve defuzzification: the method of the center of gravity, the method of the maximum, and the method of the mean value of the maxima. In this project, the simplest one, maximum method, is used. | ||
| + | In Simulink, this selection is realized through switch function, shown as Figure 12, and the result in scope is 1 in this case. | ||
| + | |||
| + | {| border="0.5" | ||
| + | |- | ||
| + | | valign="center"| | ||
| + | [[File:State-space model sim.gif|right]] | ||
| + | | valign="center"| | ||
| + | [[File:State-space_model_feed-forward_simulation_result.jpg|thumb|250px|right|State-space model feedforward simulation result]] | ||
| + | |} | ||
| + | |||
| + | === Position manual control === | ||
| + | To achieve the interactive demonstration purpose, a position manual control system is designed. This system is aim at synchronous moving the trolley according to user’s operation through a slider in ControlDesk. | ||
| + | The minimum current to drive the motor is tested around 1.2A, thus to make the trolley motion more accurate compared with slider position, an extra current with the value of 1.2A is added to the output, shown as Figure 15, which is amplify and adjust part. | ||
| + | |||
| + | The function of above part could be explained by Figure 16 and Figure 17. Before amplify the current, trolley does not move much, after adjusting with friction implement, the trolley will move as expected. | ||
| + | |||
| + | {| border="0.5" | ||
| + | |- | ||
| + | | valign="center"| | ||
| + | [[File:Position manual control block diagram.png|thumb|center|350px|Figure 15.Position manual control block diagram]] | ||
| + | | valign="center"| | ||
| + | [[File:Position manual control input current before compensation.png|thumb|left|300px|Figure 16.Position manual control input current before compensation]] | ||
| + | | valign="center"| | ||
| + | [[File:Position manual control input current after compensation.png|thumb|left|300px|Figure 17.Position manual control input current after compensation.png]] | ||
| + | |} | ||
| + | |||
| + | == Hardware test and interfacing == | ||
| + | The verified model is the precise nonlinear model. The verification process is taken by giving an initial angle to both simulation model and practical model, comparing their angular response. From Figure 18, the angle decay curves are similar according to the envelope and time period. Thus the simulated model is considered to be correct, and enough close to the practical model. | ||
| + | However, the large friction along grid is varied, hence it is difficult to add this parameter to the simulation model. The friction implemented is achieved through an independent module. | ||
| + | The tested dumping factor D=9, and at same point, to compensate the friction, the equivalent mass of trolley used is M*=7kg. | ||
| + | |||
| + | [[File:Model verification_free-trolley position.jpg|300px|thumb|center|Figure 18. Model verification free-trolley position swinging angle comparison]] | ||
| + | |||
| + | == Results comparison == | ||
| + | Figure 19 to Figure 21 show the results comparison between last year and this year, PID feedback control and PD type fuzzy logic feedback control. The system position response and angular response are analysed and organized into Table 10. The data is analysed and calculated according to Figure 22 and Figure 23. Note that the period of oscillation T should be same if considering frictionless residual oscillation. In this case the value of T is used the angular oscillation period, since the friction on grid is large and the motor is under current control all the time. The system performance is mainly determined by the total consuming time, which from system start until settled. | ||
| + | The requirement of project is to move the trolley for 0.5m along grid, and find optimal solution for overall consuming time without considering other limitations. According to Table 2, the steady state position errors are all under 5%, which is acceptable. The PID control result yield a large rising time, which means the system has a lower responding speed. Both of the two methods developed in this project has improved the system consuming time. Moreover, comparing with the position over shoot and maximum angle, it could be seen that the result from last year is much worse than this year. | ||
| + | {| border="0.5" | ||
| + | |- | ||
| + | | valign="center"| | ||
| + | [[File:System simulation result.jpg|thumb|center|300px|Figure 19.System simulation result]] | ||
| + | | valign="center"| | ||
| + | [[File:Feedback control using PID controller ControlDesk test result.png|thumb|left|430px|Figure 20.Feedback control using PID controller ControlDesk test result]] | ||
| + | | valign="center"| | ||
| + | [[File:Feedback control using fuzzy logic controller ControlDesk test result 2.png|thumb|left|450px|Figure 21.Feedback control using fuzzy logic controller ControlDesk test result]] | ||
| + | |} | ||
| + | {| border="0.5" | ||
| + | |- | ||
| + | | valign="center"| | ||
| + | [[File:PID control reference & practical.gif|center|PID control reference & practical]] | ||
| + | | valign="center"| | ||
| + | [[File:PD-type fuzzy control reference & practical.gif|center|300PD-type fuzzy control reference & practical]] | ||
| + | |} | ||
| + | {| border="0.5" | ||
| + | |- | ||
| + | | valign="center"| | ||
| + | [[File:System position response analysis.jpg|thumb|left|430px|Figure 22.System position response analysis]] | ||
| + | | valign="center"| | ||
| + | [[File:System angular response analysis.jpg|thumb|left|450px|Figure 23.System angular response analysis]] | ||
| + | |} | ||
| + | [[File:Table of results comparison.jpg|thumb|center|900px|Table 2.Results comparison]] | ||
| + | |||
| + | == Conclusion == | ||
| + | === Designing summarize === | ||
| + | [[File:Solving engineering problem cycle.png|thumb|right|500px|Figure 24.Solving engineering problem cycle]] | ||
| + | |||
| + | During the modeling process, the system parameters and assumptions are proofed to important, since one parameters could change the system performance totally different, and the assumptions should be made appropriately. The friction in this project is significant large compared with motor traction, thus friction implement is enssential, and cannot be ignored. In interfacing part, initially the system was built up without testing, as a consequence, the system behaves non-expected. For instance, the motor drives the trolley very fast for every time, it is hard to select a suitable current input only rely on experience. Also, the system model verification process is necessary, since the model reflects understanding from the designer, and it could help checking the accuracy of parameters. | ||
| + | An appropriate designing process with logical order that learned from this project is as Figure 24. | ||
| + | |||
| + | === Project completion === | ||
| + | Generally the project is completed and reached the aims and requirements in proposal. | ||
| + | At this stage, the project achievements are as following aspects: | ||
| + | |||
| + | •Nonlinear and linear system model are derivate and successful simulated. | ||
| + | |||
| + | •According to the feedback, the system instantaneous energy is calculated and presented. | ||
| + | |||
| + | •A timer function with system “fully stooped” criteria is constructed in Simulink. | ||
| + | |||
| + | •In PID controller designing, the robustness is designed through sensitivity, and then the theoretical parameter variance is length 10% and load 10%. | ||
| + | |||
| + | •3 different controller methods are developed: PID, fuzzy-logic and hybrid PD-type fuzzy logic. | ||
| + | |||
| + | •The system performance is determined mainly through settling time, thus the best result is achieved by PID controlling. Last year group’s best result is 4.6 seconds, | ||
| + | and this year is 3.2 seconds, which is 30% percent improvement. | ||
| + | |||
| + | •The demonstration ability is also enhanced since the position manual control is designed instead of current control. | ||
| + | |||
| + | •Visualize animation programs are developed to demonstrate the system results. | ||
| − | + | •System emergency break is realized in simulation, contrast with physical break of last year group. | |
| − | == | + | === Skills training and professional development === |
| + | Among the simulation state, the required skills include analysis and modelling physic model, Matlab simulation programming, dSPACE using method, and encoder and sensor devices using knowledge. | ||
| + | During the project period, the team cooperation ability, the ability to communicate or negotiate with supervisor, the capability of literature review, time management and project management skill and other professional skills would be developed. | ||
| + | All of the skills are essential for further research activities and could be apply to career. | ||
| − | == | + | === Future work === |
| + | Gantry crane controlling is a large research area in control field. There still exists lot of work could be done. | ||
| − | + | The model used in this project to simulation is lumped mass model, in which the mass of the rod is neglect, but for practical device the connector is 0.5 kilo grams, which is the same weight as trolley. A distributed mass model could be studied in future. | |
| − | + | There are other controllers that could research on. For instance, adaptive control is a method that widely applied in modern industrial, especially for changing conditions case. Fuzzy-tuned PID control is another type of hybrid controller, also there is an algorithm called particle swarm optimizations could help increase system controlling precision. | |
| − | + | The practical model in lab is built together, hard to separate. In future could use a variable mass of payload and an extension-type of connector, which are more close to the actual application. | |
| − | + | The model now is a planar model, but in real world the payload is mostly moving in a 3 dimension space. In future the system model could increase the dimension, which could coordinate with different payload shape or transport line. | |
| − | == | + | == Group members == |
Liyan Yi | Liyan Yi | ||
Xianghui Ma | Xianghui Ma | ||
| − | == | + | == Supervisors == |
Dr.Wen Soong [http://www.adelaide.edu.au/directory/wen.soong] | Dr.Wen Soong [http://www.adelaide.edu.au/directory/wen.soong] | ||
| Line 39: | Line 313: | ||
== References == | == References == | ||
| + | [1] A. Ridout, “Anti-swing control of the overhead crane using linear feedback”, Journal of Electrical and Electronics Engineering, Australia 9(1/2), 1989, 17-26. | ||
| + | |||
| + | [2] A. Ridout, “New feedback control system for overhead cranes”, in Proceedings of the Electric Energy Conference, Adelaide, Australia, 1987, vol.1, pp.135-140. | ||
| + | |||
| + | [3] APPLETON MARINE, INC., 2014, “Knuckle boom crane: Model KB”, viewed 29/08/2014,<http://www.appletonmarine.com/marine-products/cranes.html> | ||
| + | |||
| + | [4] B. Cazzolato, “Advanced PID Control (2013) Control System Implementation”, University of Adelaide, Adelaide, SA, Australia. 2013. | ||
| + | |||
| + | [5] B. Kolar & K. Schlacher, 2013, “Nonlinear control of a gantry crane”, in Computer Aided Systems Theory- EUROCAST, 14th International Conference, Las Palmas de Gran | ||
| + | Canaria, Spain, pp.289-296. | ||
| + | |||
| + | [6] C. Yang, “Swinging Crane Simulator”, School of Electrical & Electronic Engineering, University of Adelaide, Adelaide, Australia, 2014. | ||
| + | |||
| + | [7] DS1104 R&D Controller Board Cost-effective system for controller development, dSPACE Gmbh. P aderborn, Germany. 2013 | ||
| + | |||
| + | [8] E. Abdel-Rahman, A. Nayfeh & Z. Masoud, 2003, “Dynamics and control of cranes: a review”, Journal of Vibration and Control 9, 863-908. | ||
| + | |||
| + | [9] Galieo’s Pendulum: from the rhythm of time to the making of matter, RG.Newton, London, England, 2004. | ||
| + | |||
| + | [10] K. Sultan, “Inverted Pendulum, Analysis, Design and Implementation”, Institute of Industrial Electronic Engineering, PCSIR, Karachi, Pakistan, Rep. 2003. | ||
| + | |||
| + | [11] M. Ahmad, A. Nasir, M. Najib & H. Ishak, “Anti-sway Techniques in Feedback Control Loop of a Gantry Crane System”, Control and Instrumentation Research Group (COINS), | ||
| + | Faculty of Electrical and Electronics Engineering, University Malaysia Pahang, 2009. | ||
| + | |||
| + | [12] M. Mattews, C. Gauld & A. Stinner, “The Pendulum”, Springer, Vol.13, No.4-5 and Vol.13, No.7-8, the Netherlands, 2005. | ||
| + | |||
| + | [13] M. Solin, W. Di & A. Legowo, “Fuzzy-tuned PID Anti-swing Control of Automatic Gantry Crane”, Department of Machatronics Engineering, International Islamic University Malaysia, Kuala Lumpur, Malaysia, 7, January, 2008. | ||
| + | |||
| + | [14] M. Zawawi, J. Bidin, M. Tumari & M. Saealal, “Investigation of Classical and Fuzzy Controller Robustness for Gantry Crane System incorporating Payload”, in Third International Conference on Computational Intelligence, Modelling & Simulation, Pekan, Malaysia, 2011. | ||
| + | |||
| + | [15] S. Bruins, “Comparison of Different Control Algorithms for a Gantry Crane System”, HAN University, Arnhem and Nijmegen, The Netherlands, Intelligent Control and Automation, January, 2010, pp.68-81. | ||
| + | |||
| + | [16] W. Du, Z. Xie, F. Lu & Y. Cao, “Gantry crane dynamic modelling and motion control”, Applied Mechanics and Materials, Vol.419, 2013, pp.649-653. | ||
| + | |||
| + | [17] W. Soong, “DC Machines: Parameter Measurement and Performance Prediction”, School of Electrical & Electronic Engineering, University of Adelaide, Adelaide, Australia, 2008. | ||
| + | |||
| + | [18] X. Bai, “Swinging Crane Simulator”, School of Electrical & Electronic Engineering, University of Adelaide, Adelaide, Australia, 2014. | ||
| + | |||
| + | [19] X. Yu & W. Yao, “Optimal Composite Nonlinear Feedback Control for a Gantry Crane System”, Department of Automation, Xiamen University, Hefei, China, 2012, pp.601-606. | ||
| + | |||
| + | [20] A. Benhidjeb & G. Gissinger, “Fuzzy Control of An Overhead Crane Performance Comparison with Classic Control”, Control Eng. Practice, Vol.3, No.12, 1995, pp.1687-1696. | ||
| + | |||
| + | [21] dSPACE_guide_encoder | ||
| + | |||
| + | [22] M. Solihin & Wahyudi, “Sensorless anti-swing control strategy for automatic gantry crane system: soft sensor approach”, International Conference on Intelligent and Advanced Systems, ICIAS IEEE, 2007, pp.992-996. | ||
| + | |||
| + | [23] K. Astrom & T. Hagglund, “PID controllers: Theory, Design and Tuning”, 2nd ed, Research Triangle Park, NC 27709, USA: ISA – The Instrumentation, Systems and Automation Society, 1995. | ||
| + | |||
| + | [24] M. Solin & Wahyudi, “Fuzzy-tuned PID Control Design for Automatic Gantry Crane”, International Conference on Intelligent and Advanced Systems, ICIAS IEEE, 2007, pp.1092-1097. | ||
Latest revision as of 23:12, 4 June 2015
Project aim: Swinging Crane project is aim to transporting a payload from one place to another and reducing the consuming time as much as possible. Using the software of Simulink and ControlDesk on computer to create and simulate a system model. Through the hardware of dSPACE board, amplifier and simulator to realize practical control, which is move the trolley for 0.5 meters and count the consuming time from starting movement to fully settled. The outcomes are supposed to realize multiple control methods, which includes automatic and manual control. The system performance should be improved compared with last year results. This project also could be used for helping high school student to understand the principle of control systems.
Contents
Project introduction
Technical introduction
Gantry cranes are wildly used in industry, for lifting heavy objects by a hoist which is fitted in a hoist trolley and can move horizontally on a rail or pair of rails fitted under a beam.
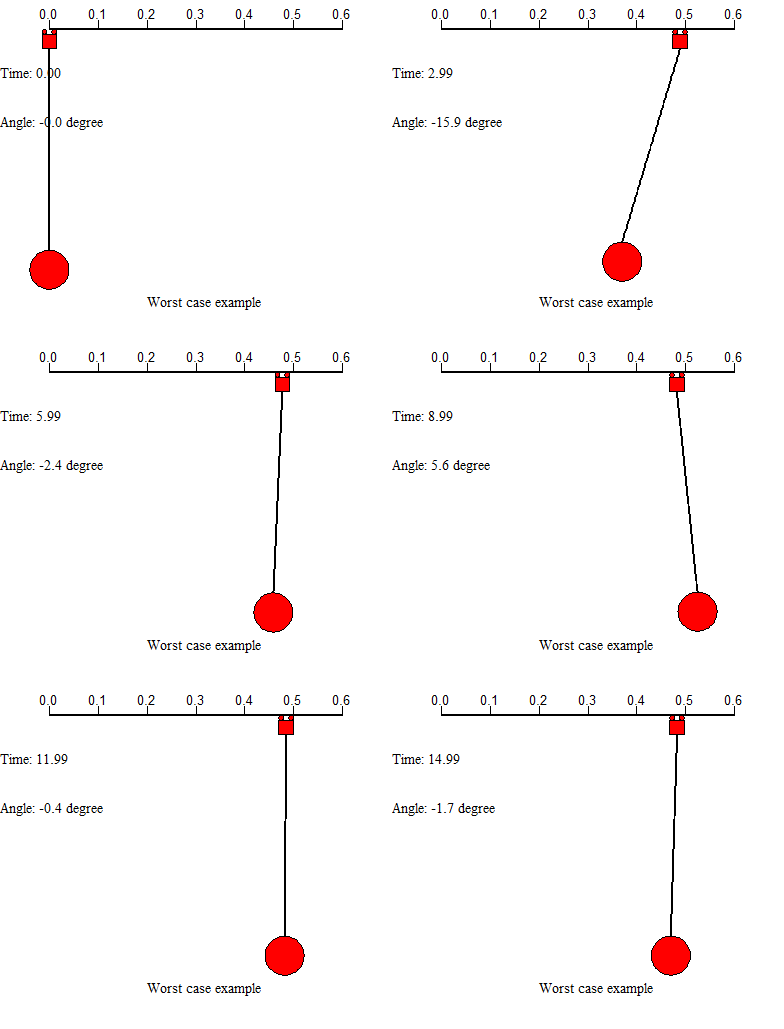
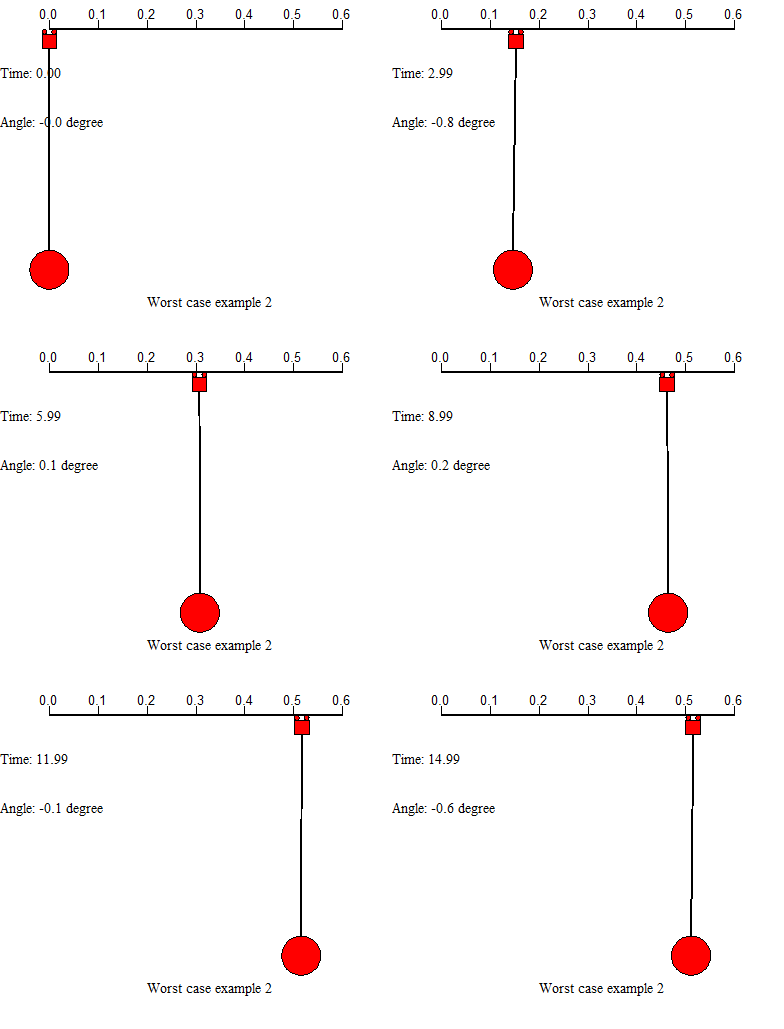
There are two examples on the above shows 2 worst case in controlling the system. First example uses a large force applied on the trolley, leads the residual swinging angle at the end is very large and the system cost much time to settle. Second example uses small force to drive the trolley from start, but the trolley movement is too slow, which costs a lot of time either. In this project, we will concentrate on designing appropriate feed forward input to the system, and add controllers to help control the system motion, further improve the system performance.
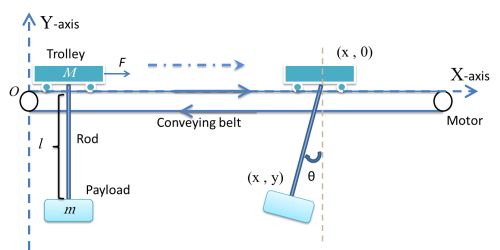
Figure 1 demonstrates the model of swinging crane, the DC motor controls the trolley to horizontally move a load in a short distance. There are two encoders to record the data, one is the moving distance, and another is sway angle of the load. By giving a signal from operation control system, it will generate a DC current from a current source, then injecting it into a motor, which would drive the conveyor belt. There is a trolley placed on one side of the belt, and start moving towards another side. At the bottom of the trolley, using a rod stand for the hoist, connect with a load. At the start of transporting the loads, it will cause accelerated, corresponds to a traction force, effect on the trolley. There occur an angle between the rod and vertical. After the trolley stops, the loads may turn to oscillate. If the initial angle large, the oscillation duration roses, which is a potential risk to the people on the ground.
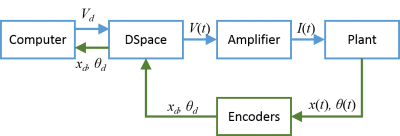
The system is operated inside a flow, shown as Figure 2. Input signal is generated from Simulink, goes into the plant through dSPACE and amplifier. The outputs of the plant are measured by two encoders, and send back to dSPACE, finally transfer to the computer. The dSPACE and amplifier components will introduce later. The plant is the real model of the system, the transfer relationship is shown in Figure 3. The current flows into DC motor, which drives the belt on the grid. The trolley is bind on the belt, thus it has the same acceleration with the belt. There are two outputs from the, the trolley position and the swinging angle of the pendulum.
Motivation
The gantry crane system could be identified into separate sections: linear motion and swinging pendulum. The goal is to minimum the time used to transport loads and reduce the swinging oscillation as minimize as possible. The pendulum was studied by Galileo, Huygens, Newton, Hooke and all the leading figures of 17th-century science. Since the long history on the study, pendulum theory has been almost perfect, but still exist imperfection in applied to practical. In this project, the basic model is simple gravity pendulum. To analyze the motion parameters of pendulum, Newton’s classical mechanics Laws are applied. In traditional education, Newton’s lows are taught in high-school physics lecture. The theorem is abstract to student, and divorced from the practical application. The gantry crane system is a representative application, and easy to understand, thus it is suitable for demonstration teaching purpose.
Objectives
The aim of swinging crane project is to demonstrate research component of project, examine and improve last year’s project, perform analysis, show understanding of theoretical principles, simulations and experiments, then improve system robustness, calculating instantaneous energy and optimize system motion trajectories. The 5 objectives of this project are shown as bellow:
1.Modelling of system – physical principles, approximates which can be used to simplify model (e.g. linearized model).
2.Selection of reference trajectories-trade-offs, constraints, optimization.
3.Calculation and control of “energy” stored in pendulum-means for damping energy.
4.Simulation of system- investigates and checks performance.
5.Experimental demonstration- interfacing operation, model verification.
Background
Crane system
The crane system model can be dismantled into 2 parts: a pendulum subsystem with fixed trolley position and a free trolley position while there is no pendulum oscillation drive by a DC motor. The system control methods including feed forward control and feedback control.
Feed forward/open-loop control
Feed forward control can change the system output directly through a per-defined path. Feed forward control is usually used with feedback control since a feedback control system is required to track set point changes and to suppress unmeasured disturbances in system response. In system theory, reference input is necessary to control the plant, and how to set an appropriate input signal is difficult. Moreover, there exists a lot of methods for optimal input-shaping, which is aim to improve system performance through system input, instead of controller. This usually has more obvious effect than the feedback control.
Feedback/closed-loop control
Previous work
The swinging crane real system is designed by the workshop of University of Adelaide. Some analysis has been done by previous group, a simple PID control and current manual control have also been developed. Thus some data of the model could use by directly looking up their reports.
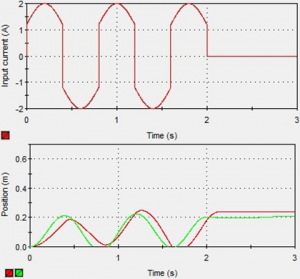
Figure 4 gantry crane system is studied by last year project group. This model is based on lumped-mass model, which ignore the mass and the elongation of the rod caused by the tension force. Both of the trolley and payload are considered as point mass and moving in two-dimensional x-y plane.
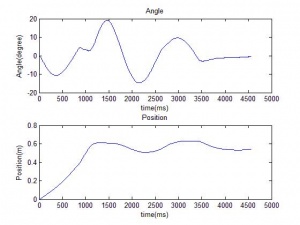
The system total settling time from last year is 4.566s. The system input signal is as Figure 5. The system response and ControlDesk results are shown in Figure 6.
System modelling
Simple pendulum model
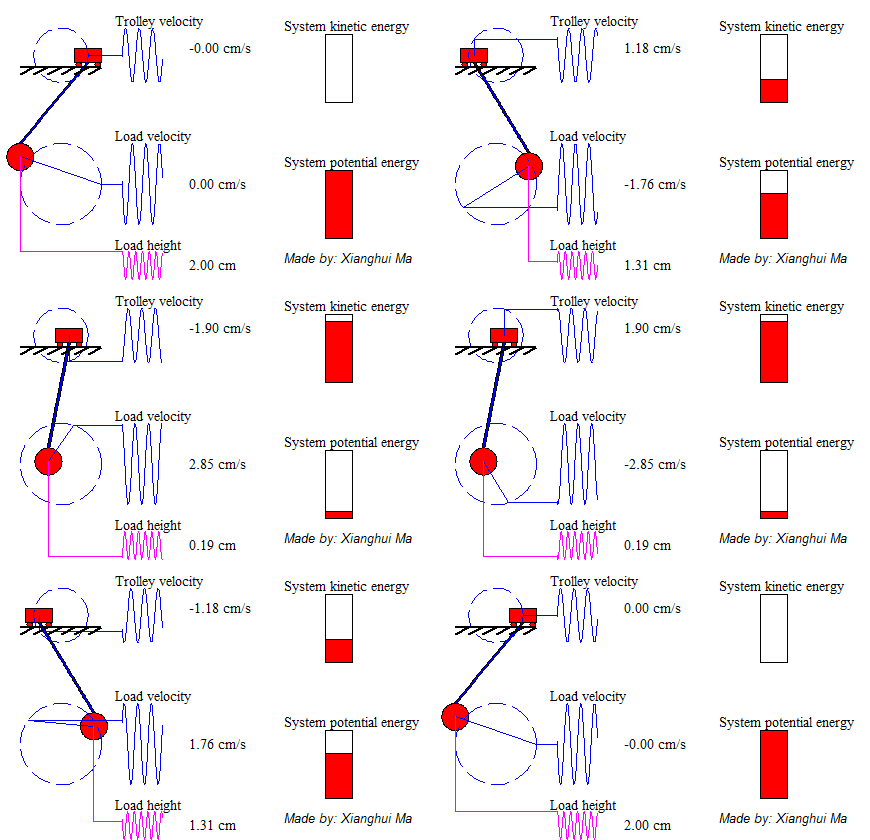
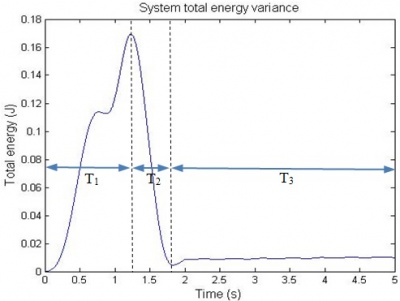
System total energy is the summation of kinetic energy of the trolley, the potential energy and kinetic energy of pendulum load. The animation on the left shows a free-trolley-position movement demonstration without friction or air-drag. It shows the energy conservation law, which means the total energy is constant all over the time, and in this particular case the system kinetic energy is complementary to potential energy. Consider a trail of total energy in a system process, shows as Figure 5, in where T1 is the acceleration time period, T2 is the deceleration period and T3 is the remain oscillation period. The magnitude of system total energy in T3 is a constant value with frictionless assumption. The left animation illustrates the system remaining oscillation relationship in T3.
System equations
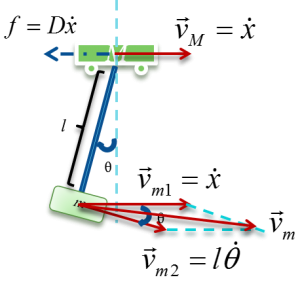
According to Figure 6, the system total energy could be expressed as:
Taking the force relation, the system transfer function is
 ,
if the pendulum swing a small angle(i.e.less than 10 degrees), the above equations could be reduced to
 .
.
By taking the Laplace transform, the system transfer function is 200px.
The above equations could also write as state-space model form. Assume the state variable ![]() , and state equation
, and state equation ![]() the state matrices are
the state matrices are  ,
, and
and .
.
Control methods designing
PID control
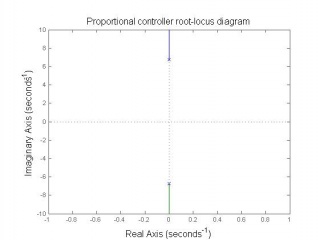
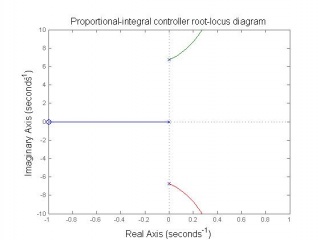
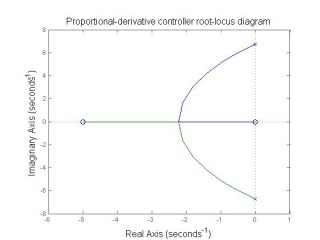
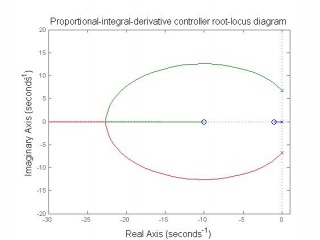
In this project the Figure 7 block structure is used. There are two PID controllers used to control the two state variables feedback. The PID controller parameters are designed by selecting appropriate , and gains through analysing the root-locus diagrams and considering the system robustness.
Inner-loop controller design
Observing from the above root-locus diagrams, PD controller has simple construction and enough to insure the stability of open-loop system.To ensure control system robustness, i.e. system is not sensitive to connector length l and load mass m changing, a robustness designing for inner-loop controller parameters is essential. The inner-loop system robustness with above parameters will have the tolerance of connector length changing 10% (from 0.389m to 0.475m), mass of load changing 44% (0.308kg to 0.792kg).
Outer-loop controller design
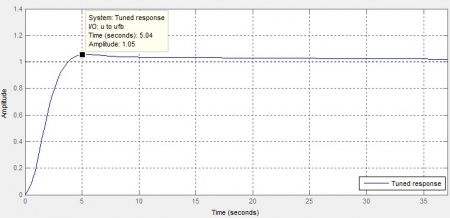
The outer loop is designed using the Simulink built-in function, PID self tuning with considering the following conditions: • Overshoot ≤ 5% • Settling time ≤ 5s • Steady state error ≤ ±1%
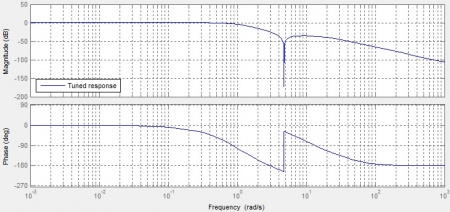
The outer loop PID controller response tuning design is shown as Figure 10. The tuning Bode diagram is shown as Figure 11.
Fuzzy-logic control
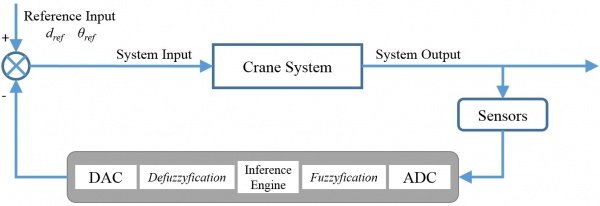
Fuzzy logic control is a rule-based control method. The controller is designed with a set of fuzzy rules for both input and output sides. Figure 12 shows the basic structure of a fuzzy control system.
In classic control field, the precision of a control system modelling effects the system behaviour most. The dynamic information of the system state could help achieve the goal of accuracy control. However, the number of the state variables are too much for a complex system, and they may have influence to each other, thus it is difficult to describe the system state correctly. Fuzzy logic control uses the idea and theory of fuzzy algorithms to describe the system state. Fuzzy control is a nonlinear control method, and it also belongs to intelligent control branch. In general, a control engineer will use classic algorithms (of the classic PD type, for example) if the system can be modelled and fuzzy algorithms (of the fuzzy PD type, for example) if the system cannot be modeled (or can only be partly modeled).
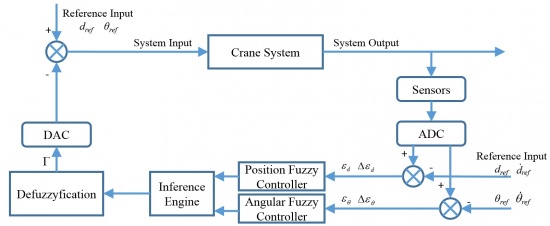
In this project, there are 4 state variables, which defined in previous. Based these variables, two fuzzy controllers are used. The system simulation diagram shows as Figure 13.
Fuzzification design
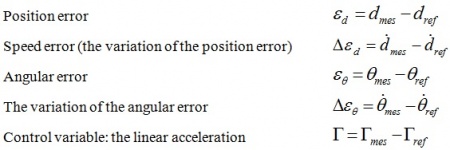
The fuzzyfication process uses fuzzy state variables to describe the system. Assume the state variables and control variable are:
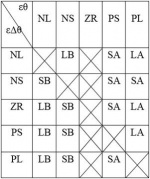
The state variables considered can be positive, zero or negative, also can be large and small. Presume there are 5 quantified intervals set for input variables, in which are “negative large” (NL), “negative small” (NS), “zero” (ZR), “positive small” (PS) and “positive large” (PL). While there are 5 quantified regions set for output, in which are “large acceleration” (LA), “slight acceleration” (SA), “zero acceleration” (ZA), “slight braking” (SB) and “large braking” (LB), illustrates as the fuzzy rules bar.
Fuzzy rules define
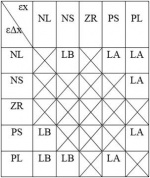
The fuzzy rules are defined as term of Θ (ZR, PS; AS) for example. Table 7 presents the corresponding relationship of the angular error, the angular acceleration error and the correction output acceleration. Table 8 is the position rule matrix, similar as Table 7. The example rule could be interpreted with the following implication: If the angular error εθ is NS and the variation of the angular error is NL, then the trolley acceleration Γ is LB.
Defuzzification design
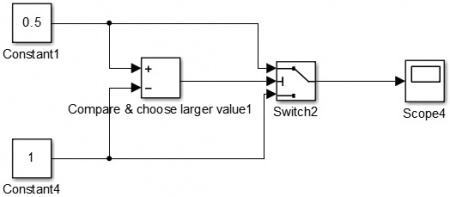
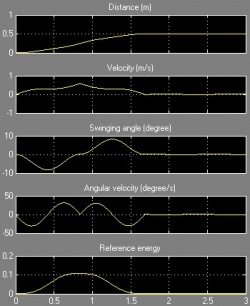
The process of selecting the output from the two fuzzy controllers is called defuzzification. There are several methods to achieve defuzzification: the method of the center of gravity, the method of the maximum, and the method of the mean value of the maxima. In this project, the simplest one, maximum method, is used. In Simulink, this selection is realized through switch function, shown as Figure 12, and the result in scope is 1 in this case.
Position manual control
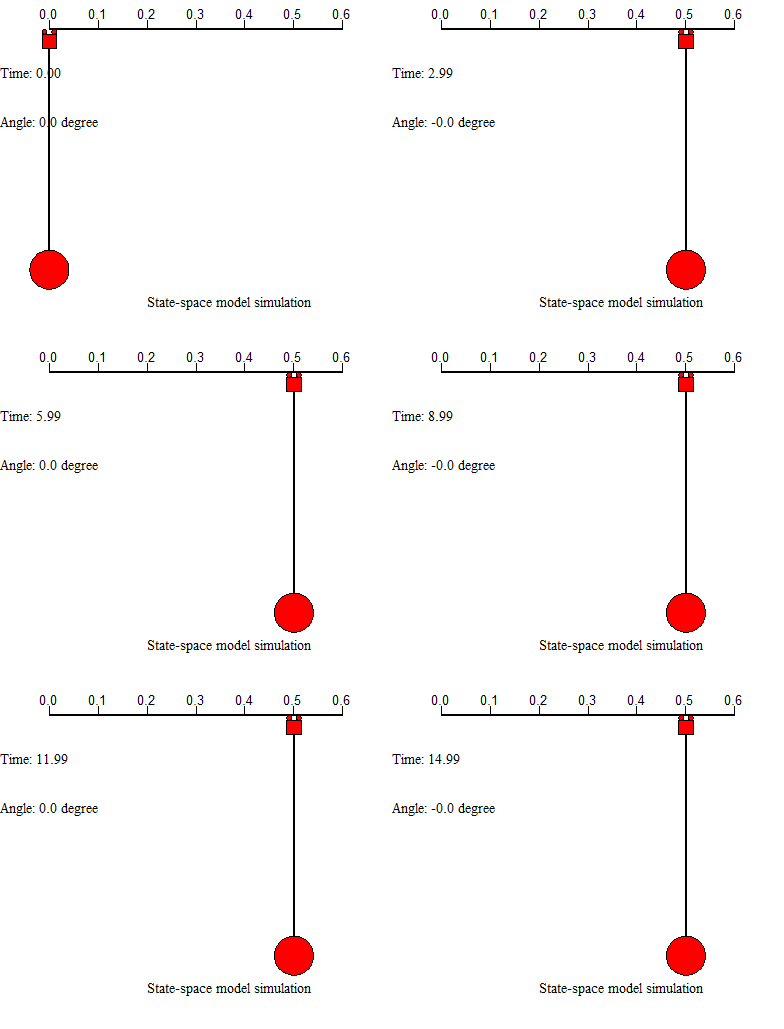
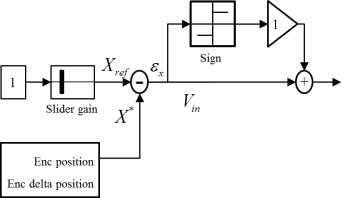
To achieve the interactive demonstration purpose, a position manual control system is designed. This system is aim at synchronous moving the trolley according to user’s operation through a slider in ControlDesk. The minimum current to drive the motor is tested around 1.2A, thus to make the trolley motion more accurate compared with slider position, an extra current with the value of 1.2A is added to the output, shown as Figure 15, which is amplify and adjust part.
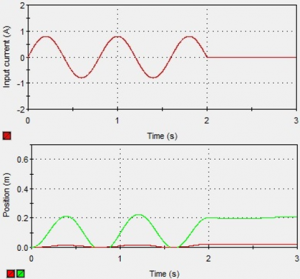
The function of above part could be explained by Figure 16 and Figure 17. Before amplify the current, trolley does not move much, after adjusting with friction implement, the trolley will move as expected.
Hardware test and interfacing
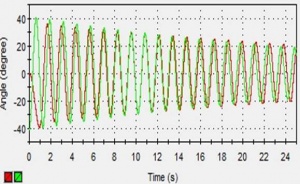
The verified model is the precise nonlinear model. The verification process is taken by giving an initial angle to both simulation model and practical model, comparing their angular response. From Figure 18, the angle decay curves are similar according to the envelope and time period. Thus the simulated model is considered to be correct, and enough close to the practical model. However, the large friction along grid is varied, hence it is difficult to add this parameter to the simulation model. The friction implemented is achieved through an independent module. The tested dumping factor D=9, and at same point, to compensate the friction, the equivalent mass of trolley used is M*=7kg.
Results comparison
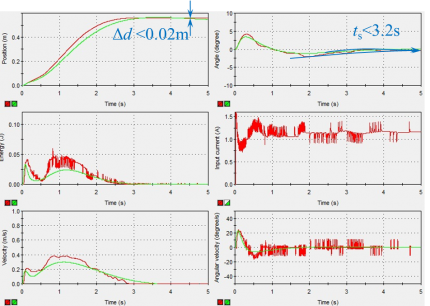
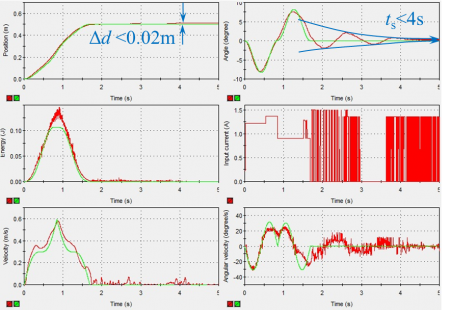
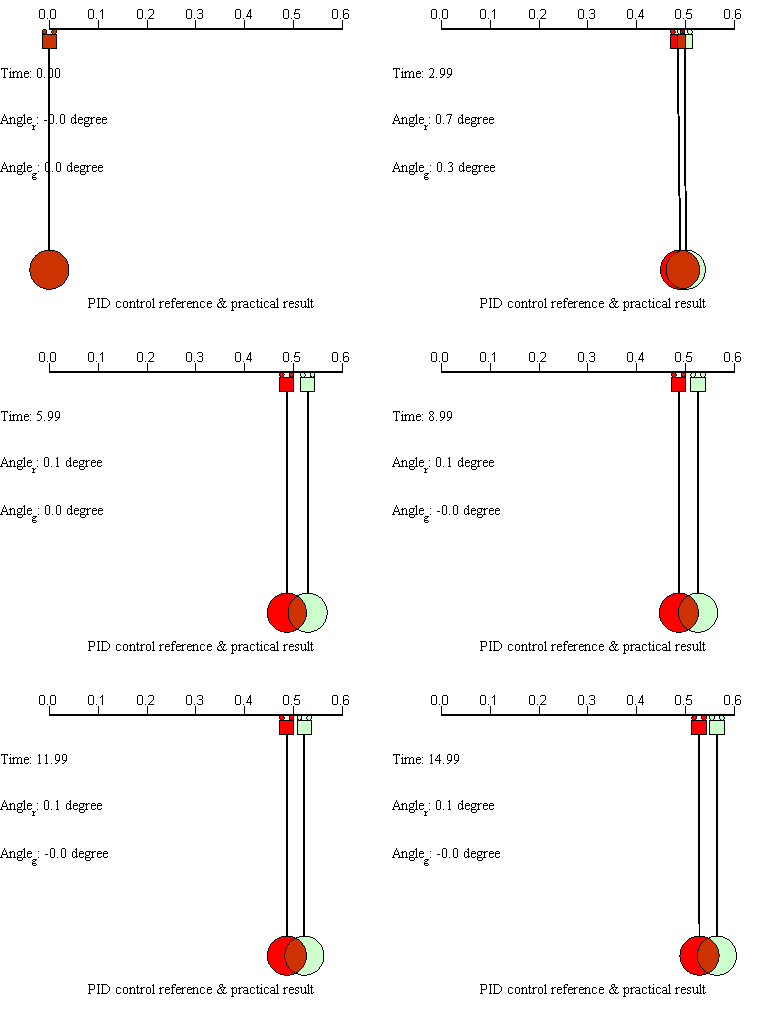
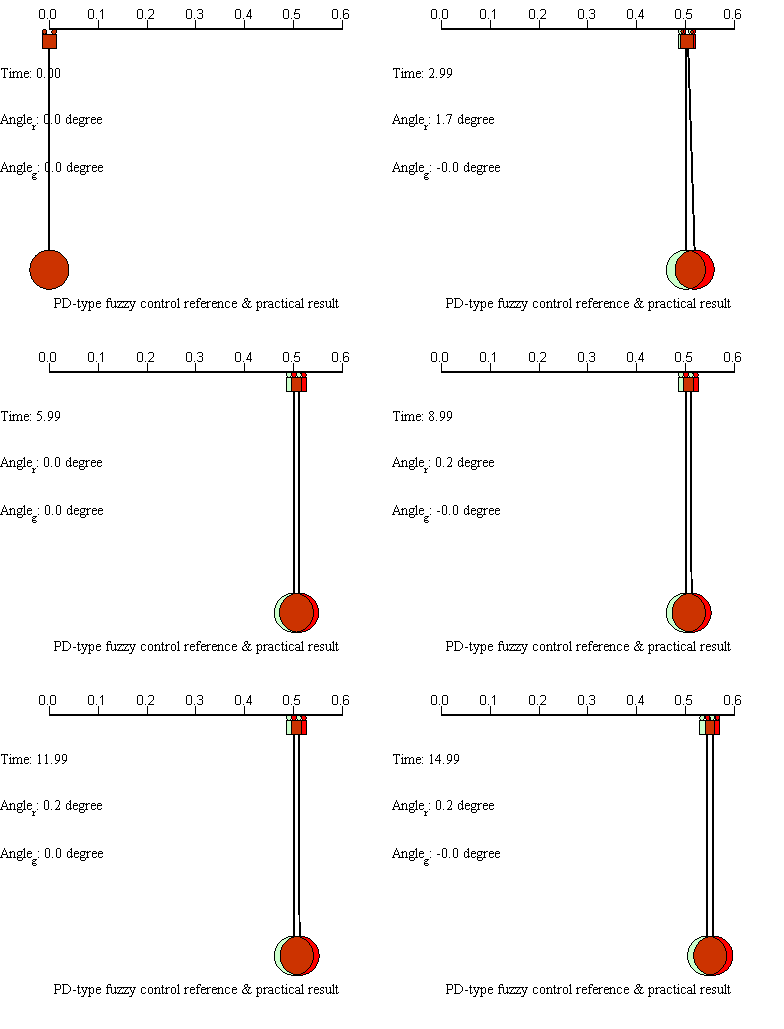
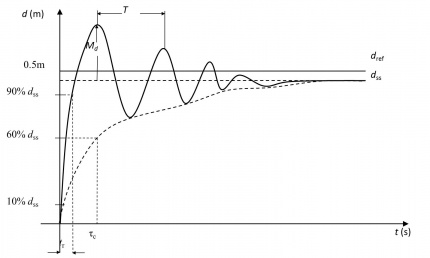
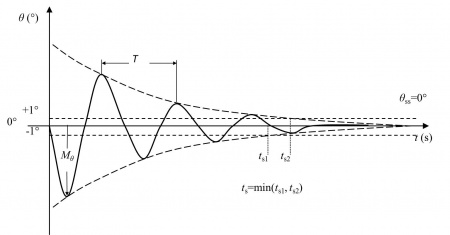
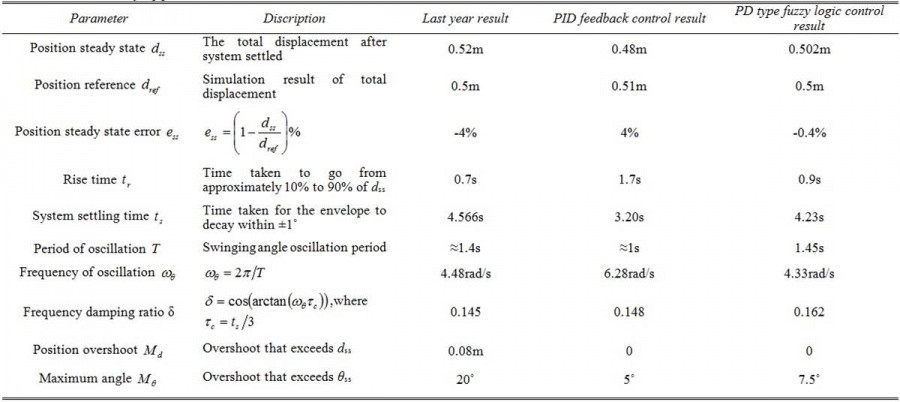
Figure 19 to Figure 21 show the results comparison between last year and this year, PID feedback control and PD type fuzzy logic feedback control. The system position response and angular response are analysed and organized into Table 10. The data is analysed and calculated according to Figure 22 and Figure 23. Note that the period of oscillation T should be same if considering frictionless residual oscillation. In this case the value of T is used the angular oscillation period, since the friction on grid is large and the motor is under current control all the time. The system performance is mainly determined by the total consuming time, which from system start until settled. The requirement of project is to move the trolley for 0.5m along grid, and find optimal solution for overall consuming time without considering other limitations. According to Table 2, the steady state position errors are all under 5%, which is acceptable. The PID control result yield a large rising time, which means the system has a lower responding speed. Both of the two methods developed in this project has improved the system consuming time. Moreover, comparing with the position over shoot and maximum angle, it could be seen that the result from last year is much worse than this year.
Conclusion
Designing summarize
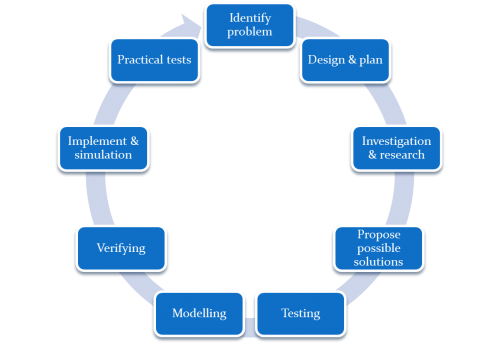
During the modeling process, the system parameters and assumptions are proofed to important, since one parameters could change the system performance totally different, and the assumptions should be made appropriately. The friction in this project is significant large compared with motor traction, thus friction implement is enssential, and cannot be ignored. In interfacing part, initially the system was built up without testing, as a consequence, the system behaves non-expected. For instance, the motor drives the trolley very fast for every time, it is hard to select a suitable current input only rely on experience. Also, the system model verification process is necessary, since the model reflects understanding from the designer, and it could help checking the accuracy of parameters. An appropriate designing process with logical order that learned from this project is as Figure 24.
Project completion
Generally the project is completed and reached the aims and requirements in proposal. At this stage, the project achievements are as following aspects:
•Nonlinear and linear system model are derivate and successful simulated.
•According to the feedback, the system instantaneous energy is calculated and presented.
•A timer function with system “fully stooped” criteria is constructed in Simulink.
•In PID controller designing, the robustness is designed through sensitivity, and then the theoretical parameter variance is length 10% and load 10%.
•3 different controller methods are developed: PID, fuzzy-logic and hybrid PD-type fuzzy logic.
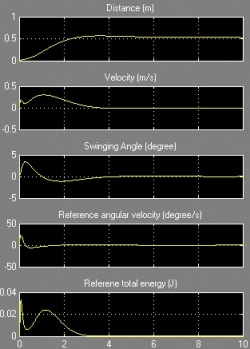
•The system performance is determined mainly through settling time, thus the best result is achieved by PID controlling. Last year group’s best result is 4.6 seconds, and this year is 3.2 seconds, which is 30% percent improvement.
•The demonstration ability is also enhanced since the position manual control is designed instead of current control.
•Visualize animation programs are developed to demonstrate the system results.
•System emergency break is realized in simulation, contrast with physical break of last year group.
Skills training and professional development
Among the simulation state, the required skills include analysis and modelling physic model, Matlab simulation programming, dSPACE using method, and encoder and sensor devices using knowledge. During the project period, the team cooperation ability, the ability to communicate or negotiate with supervisor, the capability of literature review, time management and project management skill and other professional skills would be developed. All of the skills are essential for further research activities and could be apply to career.
Future work
Gantry crane controlling is a large research area in control field. There still exists lot of work could be done.
The model used in this project to simulation is lumped mass model, in which the mass of the rod is neglect, but for practical device the connector is 0.5 kilo grams, which is the same weight as trolley. A distributed mass model could be studied in future.
There are other controllers that could research on. For instance, adaptive control is a method that widely applied in modern industrial, especially for changing conditions case. Fuzzy-tuned PID control is another type of hybrid controller, also there is an algorithm called particle swarm optimizations could help increase system controlling precision.
The practical model in lab is built together, hard to separate. In future could use a variable mass of payload and an extension-type of connector, which are more close to the actual application.
The model now is a planar model, but in real world the payload is mostly moving in a 3 dimension space. In future the system model could increase the dimension, which could coordinate with different payload shape or transport line.
Group members
Liyan Yi
Xianghui Ma
Supervisors
Dr.Wen Soong [1]
Dr Braden Phillips [2]
References
[1] A. Ridout, “Anti-swing control of the overhead crane using linear feedback”, Journal of Electrical and Electronics Engineering, Australia 9(1/2), 1989, 17-26.
[2] A. Ridout, “New feedback control system for overhead cranes”, in Proceedings of the Electric Energy Conference, Adelaide, Australia, 1987, vol.1, pp.135-140.
[3] APPLETON MARINE, INC., 2014, “Knuckle boom crane: Model KB”, viewed 29/08/2014,<http://www.appletonmarine.com/marine-products/cranes.html>
[4] B. Cazzolato, “Advanced PID Control (2013) Control System Implementation”, University of Adelaide, Adelaide, SA, Australia. 2013.
[5] B. Kolar & K. Schlacher, 2013, “Nonlinear control of a gantry crane”, in Computer Aided Systems Theory- EUROCAST, 14th International Conference, Las Palmas de Gran Canaria, Spain, pp.289-296.
[6] C. Yang, “Swinging Crane Simulator”, School of Electrical & Electronic Engineering, University of Adelaide, Adelaide, Australia, 2014.
[7] DS1104 R&D Controller Board Cost-effective system for controller development, dSPACE Gmbh. P aderborn, Germany. 2013
[8] E. Abdel-Rahman, A. Nayfeh & Z. Masoud, 2003, “Dynamics and control of cranes: a review”, Journal of Vibration and Control 9, 863-908.
[9] Galieo’s Pendulum: from the rhythm of time to the making of matter, RG.Newton, London, England, 2004.
[10] K. Sultan, “Inverted Pendulum, Analysis, Design and Implementation”, Institute of Industrial Electronic Engineering, PCSIR, Karachi, Pakistan, Rep. 2003.
[11] M. Ahmad, A. Nasir, M. Najib & H. Ishak, “Anti-sway Techniques in Feedback Control Loop of a Gantry Crane System”, Control and Instrumentation Research Group (COINS), Faculty of Electrical and Electronics Engineering, University Malaysia Pahang, 2009.
[12] M. Mattews, C. Gauld & A. Stinner, “The Pendulum”, Springer, Vol.13, No.4-5 and Vol.13, No.7-8, the Netherlands, 2005.
[13] M. Solin, W. Di & A. Legowo, “Fuzzy-tuned PID Anti-swing Control of Automatic Gantry Crane”, Department of Machatronics Engineering, International Islamic University Malaysia, Kuala Lumpur, Malaysia, 7, January, 2008.
[14] M. Zawawi, J. Bidin, M. Tumari & M. Saealal, “Investigation of Classical and Fuzzy Controller Robustness for Gantry Crane System incorporating Payload”, in Third International Conference on Computational Intelligence, Modelling & Simulation, Pekan, Malaysia, 2011.
[15] S. Bruins, “Comparison of Different Control Algorithms for a Gantry Crane System”, HAN University, Arnhem and Nijmegen, The Netherlands, Intelligent Control and Automation, January, 2010, pp.68-81.
[16] W. Du, Z. Xie, F. Lu & Y. Cao, “Gantry crane dynamic modelling and motion control”, Applied Mechanics and Materials, Vol.419, 2013, pp.649-653.
[17] W. Soong, “DC Machines: Parameter Measurement and Performance Prediction”, School of Electrical & Electronic Engineering, University of Adelaide, Adelaide, Australia, 2008.
[18] X. Bai, “Swinging Crane Simulator”, School of Electrical & Electronic Engineering, University of Adelaide, Adelaide, Australia, 2014.
[19] X. Yu & W. Yao, “Optimal Composite Nonlinear Feedback Control for a Gantry Crane System”, Department of Automation, Xiamen University, Hefei, China, 2012, pp.601-606.
[20] A. Benhidjeb & G. Gissinger, “Fuzzy Control of An Overhead Crane Performance Comparison with Classic Control”, Control Eng. Practice, Vol.3, No.12, 1995, pp.1687-1696.
[21] dSPACE_guide_encoder
[22] M. Solihin & Wahyudi, “Sensorless anti-swing control strategy for automatic gantry crane system: soft sensor approach”, International Conference on Intelligent and Advanced Systems, ICIAS IEEE, 2007, pp.992-996.
[23] K. Astrom & T. Hagglund, “PID controllers: Theory, Design and Tuning”, 2nd ed, Research Triangle Park, NC 27709, USA: ISA – The Instrumentation, Systems and Automation Society, 1995.
[24] M. Solin & Wahyudi, “Fuzzy-tuned PID Control Design for Automatic Gantry Crane”, International Conference on Intelligent and Advanced Systems, ICIAS IEEE, 2007, pp.1092-1097.
