Difference between revisions of "Projects:2015s1-72 Wind Turbine Control Simulator"
(→Imitating the Behavior of a Wind Turbine) |
(→Test Result) |
||
| (47 intermediate revisions by 3 users not shown) | |||
| Line 96: | Line 96: | ||
[[File:2015_72_cpcurve.jpg]] | [[File:2015_72_cpcurve.jpg]] | ||
| + | |||
| + | Figure 3-1. Cp curve | ||
The above figure shows the Cp curve of the mathematical model. Cp has a value of very close to zero when the TSR is in the range of 0 to 2. In this range, the turbine is assumed to spin very slow comparing to the speed of wind. So only a small amount of wind hits the blade to power the turbine system. The turbine system is having a very low efficiency. The co-efficient reaches its maximum value of around 41% at a TSR of 8. | The above figure shows the Cp curve of the mathematical model. Cp has a value of very close to zero when the TSR is in the range of 0 to 2. In this range, the turbine is assumed to spin very slow comparing to the speed of wind. So only a small amount of wind hits the blade to power the turbine system. The turbine system is having a very low efficiency. The co-efficient reaches its maximum value of around 41% at a TSR of 8. | ||
| Line 102: | Line 104: | ||
P=0.5C_p ρAv^3 | P=0.5C_p ρAv^3 | ||
| − | == Generator | + | The toque of the turbine could be expressed as a function of output power and its shaft speed. |
| + | T=P/ω | ||
| + | |||
| + | Generally, as the wind speed increases, the curve shafted towards the top right of the torque-speed plan. The bigger the wind is, the more torque the system could produce under a particular rotary speed. The following figure shows the torque speed curve under different wind speed. | ||
| + | |||
| + | [[File:2015_72_torque1.jpg]] | ||
| + | |||
| + | Figure 3-2. Torque speed curve | ||
| + | |||
| + | The shaft speed of a wind turbine does not change immediately because of its inertia. The larger the turbine radius is, the more inertia a turbine has. | ||
| + | |||
| + | However, in this project, a real rotating system would be build up by two DC machines. The inertia of this system would be the inertia of the two DC machines. Therefore, a dynamic inertia should be introduced. | ||
| + | |||
| + | Dynamic inertia = Turbine inertia – System inertia | ||
| + | |||
| + | The dynamic torque represents the inertia of the turbine. In a wind turbine system, the inertia is assumed to provide a torque wherever there is acceleration in the rotary speed. | ||
| + | |||
| + | The following figure shows the block diagram of the wind turbine model with dynamic torque. | ||
| + | |||
| + | [[File:2015_72_model.jpg]] | ||
| + | |||
| + | Figure 3-3. Block diagram of the wind turbine model | ||
| + | |||
| + | === Performance === | ||
| + | |||
| + | In this part, a number of important simulation results are shown. Detailed description of shape of the curve could be found in section 4.2. | ||
| + | |||
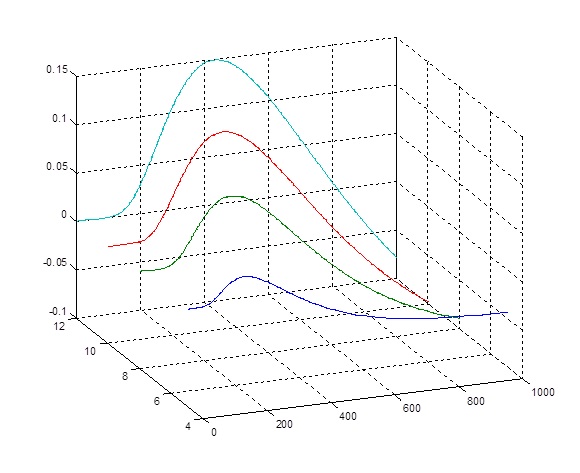
| + | The following figure shows the simulation result of the turbine model torque speed curve. The turbine we simulated has a radius of 0.5 meter. | ||
| + | |||
| + | Color Wind speed | ||
| + | Black 12km/h | ||
| + | Purple 10km/h | ||
| + | Red 8km/h | ||
| + | Blue 5km/h | ||
| + | |||
| + | [[File:2015_72_torque2.jpg]] | ||
| + | |||
| + | The following figure shows the simulated torque speed curve of a much larger wind turbine with radius of 1 meter and 20 meters respectively. | ||
| + | |||
| + | [[File:2015_72_torque3.jpg]] | ||
| + | |||
| + | The following figure shows the torque speed curve of a large 20 meters wind turbine. | ||
| + | |||
| + | [[File:2015_72_torque4.jpg]] | ||
| + | |||
| + | === Test Result === | ||
| + | |||
| + | |||
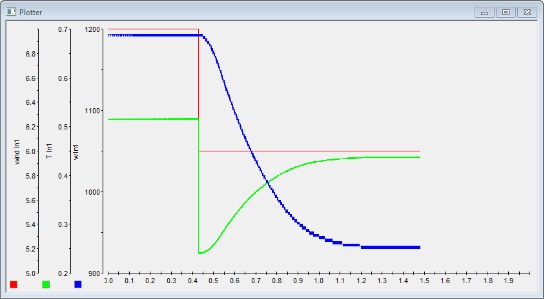
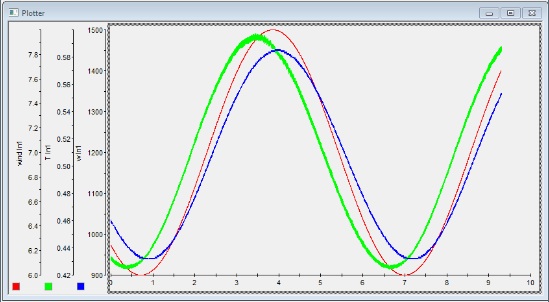
| + | In this test, the system was operated by the “exact controller”. In order to see the effect of the turbine inertia, step input wind and sine wave wind are applied to the system. | ||
| + | |||
| + | Red line – wind speed (m/s) | ||
| + | |||
| + | Green line – shaft torque (Nm) | ||
| + | |||
| + | Blue line – shaft speed (rpm) | ||
| + | |||
| + | The following figure shows the shaft torque and speed changes when the input wind drops suddenly from 7m/s to 6m/s. | ||
| + | It could be seen that the torque changes largely as the wind speed changes. This is because when the wind changes, the TSR changes, therefore the power co-efficient changes. Due to this large drop on the torque, the shaft speed drops as well. However, the shaft speed drops slowly because we have added a dynamic torque to simulate the inertia of the turbine. As the rotation speed drops, the Cp is raising again. Therefore, the shaft torque rises again. | ||
| + | The same thing happens in the case that the wind is rising. The following figure shows the case that a step input wind is applied to the system. The wind speed changes from 6m/s to 7m/s. | ||
| + | |||
| + | [[File:2015_72_34.jpg]] | ||
| + | |||
| + | The following figure shows the test result under a sine wave input wind. When the wind speed (blue) is changing, there is a delay in the change of the shaft speed (blue) due to the turbine inertia. | ||
| + | However, the changes in torque (green) are ahead of the changing in wind speed. This is because the relationship between TSR and power co-efficient. | ||
| + | |||
| + | [[File:2015_72_35.jpg]] | ||
| + | |||
| + | == Generator Design and Test == | ||
| + | |||
| + | === Maximum Power Point Tracking (MPPT)=== | ||
| + | |||
| + | Maximum power point tracking means maximizing power extracted. It is a key factor which has critical role in improving wind system performance. It uses an MPPT algorithm to track wind turbine to capture maximum performance. The performance of a wind turbine depends mainly on wind power, turbine power and generator’s capability to respond to wind fluctuations. For different wind speed, the wind turbine could extract different level of output power. The MPPT algorithms adjust turbine speed and torque and the corresponding current and voltage delivers from wind turbine to generator. | ||
| + | In our project, we have used Hill-Climb search algorithms to track maximum power point. The general processes of HCS method is to increase the rotor speed or torque when the power operates on the left side of the peak value and decrease the rotor speed or torque on the right side of the peak value continuously. | ||
| + | |||
| + | [[File:bingyang04.jpg]] | ||
| + | |||
| + | Figure 5-1 output torque vs. turbine speed curves | ||
| + | |||
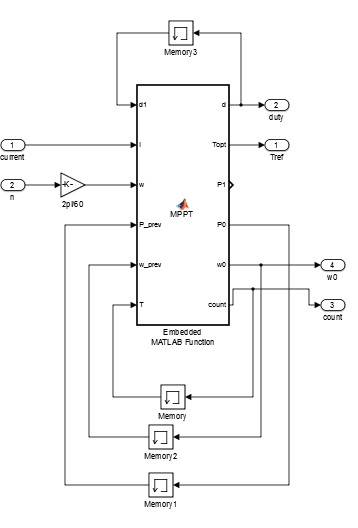
| + | In order to keep the output power at peak value in firue 5-1, the Hill-Climb search algorithms will adjust turbine speed of system. This is our MPPT Matlab block which is shown below, the inputs are previous duty-cycle (d1), current (I), shaft speed (w), previous power (P_prev), previous shaft speed (w_prev) and delay time (T). The outputs are duty-cycle (d), reference torque (Topt=Tref), output power (P1). The memory block helps to keep the previous value and deliver to MPPT block next calculation. | ||
| + | |||
| + | [[File:bingyang03.jpg]] | ||
| + | |||
| + | Figure 5-2 MPPT algorithms in Matlab | ||
| + | |||
| + | [[File:bingyang05.jpg]] | ||
| + | |||
| + | Figure 5-3 the scope of MPPT algorithms | ||
| + | |||
| + | The output is duty-cycle directly instead of reference torque. The duty-cycle signal will send to D-space and control the H-bridge to adjust generator voltage.Thus changing duty-cycle will have effects on output power. | ||
| + | |||
| + | The results are showing below: | ||
| + | |||
| + | [[File:bingyang06.jpg]] | ||
| + | |||
| + | [[File:bingyang07.jpg]] | ||
| + | |||
| + | [[File:bingyang08.jpg]] | ||
| + | |||
| + | [[File:bingyang09.jpg]] | ||
| + | |||
| + | Figure 5-4 a)wind speed b)turbine power c) duty-cycle d) output power | ||
| + | |||
| + | From the results, it is obvious that at the same wind speed, the MPPT algorithms change the duty-cycle step by step until the output power at peak value. | ||
| + | |||
| + | === Generator Testing Result === | ||
| + | The generator could be simulated in the Matlab/Simulink software. In term of knowing the needed inputs and outputs of the generator, the model is easily built using basic DC machine equations. | ||
| + | The figure 5-5 shows a simple generator model which according to the equation: E=U+IR+Ldi/dt. The detail is shown below. VDC is a constant voltage connected to the model. | ||
| + | |||
| + | [[File:bingyang10.jpg]] | ||
| + | |||
| + | Figure 5-5 the inside components of generator model | ||
| + | |||
| + | [[File:bingyang13.jpg]] | ||
| + | |||
| + | [[File:bingyang11.jpg]] | ||
| + | |||
| + | [[File:bingyang12.jpg]] | ||
| + | |||
| + | Figure 5-6 a) the generator block b) duty-cycle c) load torque | ||
| + | |||
| + | From the figure 5-6 a), constant voltage VDC= 20v, constant turbine speed w=300rpm. Changing duty-cycle as a sine wave to observe the output torque. | ||
| + | When duty-cycle increases, output torque will decrease accordingly;when duty-cycle decreases,output power will increase. These results are based on the instantaneous condition because the turbine speed remains constant at 300rpm. These results mean when duty-cycle increases, the decreased output torque will impact on generator performace and shaft speed acceleration.Also, in actual wind turbine system, when duty-cycle increases, output voltage from H-bridge will increase which means the current will reduce. As a consequence, due to T=I*K, output torque will reduce. | ||
| + | |||
| + | == Hardware Design and Construction == | ||
| + | |||
| + | === Motor Control Algorithms === | ||
| + | |||
| + | In order to build up a real rotating system to imitate the behavior of a wind turbine system, a DC motor is applied to act as the turbine while another DC motor is connected to behave as a generator. | ||
| + | |||
| + | Under a particular voltage, the relationship between torque and rotary speed is linear. Torque decreases while the shaft speed increases. | ||
| + | There are generally 3 steps in the DC motor control algorithm of the system. Under a particular wind speed v and a specific shaft speed ω, the wind turbine simulator could derive a reference torque of the turbine system. Firstly, the controller will look at this torque from the wind turbine simulator. Then it would look at the torque speed curve of the DC motor and determine how much voltage is required to produce such amount of torque under this shaft speed. Lastly, the controller would apply this voltage to the motor by controlling the duty cycle of an H-bridge circuit board. | ||
| + | |||
| + | The “Exact controller” uses the exact parameters of the DC machines. By appropriate calculation and prediction based on these parameters, the “exact controller” is expected to determine an exact value of the real time supply voltage to the motor. Moreover, by adding a current feedback and a PI controller, the system could correct itself by comparing the expected current and the actual current. | ||
| + | The “exact controller” is not a perfectly controller that controls the system precisely due to the error in data measurement. However, the advantage of this control algorithm is that motor speed changes more smoothly than using bang-bang controller. | ||
| + | |||
| + | Another important motor control algorithm is the bang-bang control. The bang-bang controller compares the actual current of the motor with the reference current. It then determines whether the motor is having a larger or smaller torque than the expected value. The controller therefore determines whether provide the motor a large voltage or a small one. | ||
| + | |||
| + | For both of these control algorithms, it is hard to start the motor by itself. This is because the co-efficient performance of a wind turbine is very low under a low shaft speed. It takes too long to start by itself. Therefore, we have set the lowest duty cycle of the controller to 25% to keep the machine could always start spinning fast. | ||
| + | === Encoder Signal Processing === | ||
| + | A single phase encoder is used in this project to measure the shaft speed of the motor. The encoder has a 200 resolution per round. It outputs 200 pules per round uniformly. By calculating this pules over time, the real time rotating speed is derived. This encoder reader is made in Simulink. | ||
| + | The following figure shows how the encoder reader works. Firstly, the encoder pules are counted up by a counter. Then we take the discrete differential of this counted signal to obtain a signal of how fast this count is changing. Lastly, by multiplying with a specific gain value, a rotary speed with a unit of rpm is obtained. | ||
| − | + | [[File:2015_72_encoder.jpg]] | |
| + | In the further research of this wind turbine simulator, a two channel encoder could be used to avoid this additional calculation. | ||
| + | === Hardware Construction === | ||
| − | + | [[File:System.jpg]] | |
Latest revision as of 11:07, 23 October 2015
This project aims to build a wind turbine simulator consisting of two small DC machines coupled together and the associated power electronics and control circuitry. The first DC machine acts a motor which produces an output torque versus speed characteristic which simulates the mechanical output of a wind turbine. For a fixed wind speed, under no-load conditions the DC motor will operate at the no-load speed of the wind turbine it is simulating. As the load torque on the wind turbine is increased, the DC motor reduces its speed until it reaches the turbine stall torque at zero speed. The second DC machine acts a generator which simulates the electric generator connected to a wind turbine. This generator is controlled to try to maximize the electrical power output for a given wind speed.
Contents
Group Information
Supervisors
Wen Soong
Nesimi Ertugrul
Group Members
Bingyang Lu
Hui Zhou
Yubo Xiu
Project Introduction
Project Scope
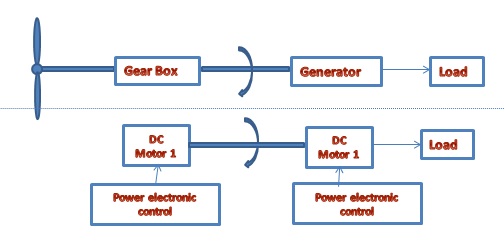
The wind turbine simulator project includes design, simulating, constructing and testing of a wind turbine power generation simulation system. The system is constructed by two parts, a wind turbine simulator and a maximum power point tracking system. Each part consists of a DC motor and some power electronic controllers.
Figure 1-1. System scope overview
The first DC motor will act as a fixed pitch control wind turbine. It would produce the same torque versus rotation speed characteristic under a specific or varies wind speed. This motor will be controlled by a Matlab based wind turbine model. The second DC motor acts as the generator of the wind power system. Some maximum power tracking algorithms will also be applied to this motor by Matlab.
Background
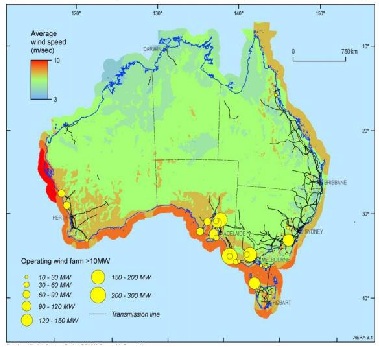
The wind market has developed rapidly these years. A new report from Navigant Research covers developments in the wind energy sector during 2014, including an analysis of the important changes in the industry over the last three years and global market forecasts through 2019. It says that fueled by the policy-driven acceleration of installations in three key countries—China, Germany and United States,--the global wind industry staged a remarkable comeback in 2014. Wind power is predicted to provide 5% of the world‘s energy in 2020. In Australian, the southern coastline lies in the roaring forties and hundreds of sites have average wind speed above eight and even night m/s at 50m above ground. Nowadays, there are 68 wind farm of greater than 100kw capacity operating in Australian. The biggest wind farm is in Victoria Macarthur wind farm, which has capacity of 420MW. Also, the government of Australia is aiming to produce 20% entire electricity supply from renewable energy sources by 2020.
Figure 1-2 Australian wind resource
Motivation
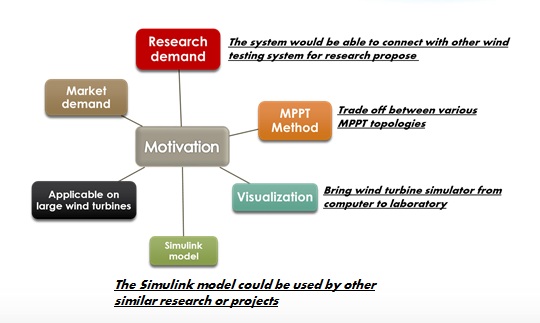
One of the most significant motivations of this project is the increasing demand of laboratory purpose wind turbine simulators. Wind energy had a fast development for the last two decades because of its cleanness. Wind energy is one of the renewable fuel which make it possible to control he energy injected into the network and to produce not polluting fuel usable in the buildings and thus to diversity the energy markets. Due to wide applications and limited economic constraints, the conversion chain of this energy must be robust and reliable. Also, a better efficiency and be realized at low cost are pursued at the same time. For these reasons, it is necessary to extract the maximum power from wind turbine. Our project is aiming to develop a small scale wind turbine simulator by a DC motor and a DC generator with appropriate control to maximize its output power.
Requirements
The first DC motor should simulate the behavior of a specific wind turbine, provide the same output torque and rotation speed under the same wind speed and load condition;
Instead of using the real wind turbine, this project will use a DC motor to simulate the blades. A DC motor is to drive to generate the torque and pass the energy to the second DC motor. The speed of the first motor is accordance to the wind speed in the real situation.
The second DC motor should always acts as a generator; The second DC motor is going to be driven by the first DC motor and pass the mechanical power into the electrical power and deliver to the grid. Thus, it is important the second DC motor should operate as a generator, otherwise it will be abstract the power from the grid.
The 2nd motor should maximize the output power of the 1st motor by appropriate power electronic control; By using the appropriate electronic circuit, different output power could be achieved. In this project, H-bride will be used to make motors possible to operate in four quadrants.
Generator MPPT control algorithms should be able to work on both situations that the wind speed is known and unknown;
quadrants control should be applied; In this part, H-bride is planed to be used to make the DC motor operate in the four quadrants. This electronic circuit will be used before the DC motors and control the current flow into the motors.
Wind profile data should be very similar to the real wind data; Wind profile data should accordance with the real wind data. All experimental research should compared with real data from the wind farm.
All procedures should be simulated in Simulink before testing;
Wind Turbine Simulation and simulator design
Imitating the Behavior of a Wind Turbine
Wind turbines extract kinetic energy from wind. A wind turbine spins as the wind is passing through its blades. The energy in wind is determined by the mass and the moving speed of the wind. E=0.5mv^2
Therefore, the power in wind that passes through the turbine area can be represented as, P=0.5ρAv^3
In last equation, ρ is the density of the air, A is the area of the turbine and v is the wind velocity. The wind passing through the turbine is slowed down. The turbine could not convert all the energy in wind into its rotary mechanical power. There would be still some energy left in the wind. Generally, the power co-efficient performance is used to describe the efficiency of a turbine system. It is represented by Cp. C_p=(Turbine output power)/(Power in wind)
The tip speed ratio (TSR) is an important parameter of the turbine system. It is the ratio between the speed of the tip of blade to the velocity of wind. λ=ωR/v
TSR describes how fast the turbine is spinning compare to the wind speed. For a wind turbine, the power co-efficient could not achieve a high value either if the turbine spins too slow or too fast. On one hand, if a turbine rotates too slowly, a significant amount of wind would pass between blades. Mot much wind would be used to power the turbine. Therefore, the turbine system would have a low efficient in this case. On the other hand, if a turbine rotates too fast, the wind could not have enough time to return to normal speed before the next blade arrives. The turbine becomes like a wall to the wind. As a result, the efficient is also very low in this case. Generally, Cp could be written as a function of TSR and turbine pitch angle. C_p=f(λ,θ)
In this project, a fixed pitch control system is investigated. Therefore, the pitch angle is assumed to be zero at all the time. But this system could still use on general turbine simulation without fix pitch angle control.
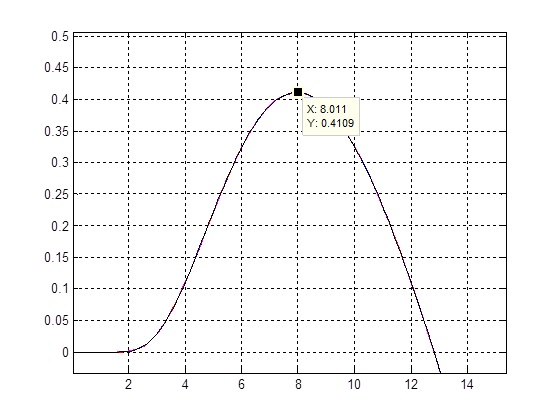
Figure 3-1. Cp curve
The above figure shows the Cp curve of the mathematical model. Cp has a value of very close to zero when the TSR is in the range of 0 to 2. In this range, the turbine is assumed to spin very slow comparing to the speed of wind. So only a small amount of wind hits the blade to power the turbine system. The turbine system is having a very low efficiency. The co-efficient reaches its maximum value of around 41% at a TSR of 8.
By adding the concept of power co-efficient, the output power of the turbine system could be written as, P=0.5C_p ρAv^3
The toque of the turbine could be expressed as a function of output power and its shaft speed. T=P/ω
Generally, as the wind speed increases, the curve shafted towards the top right of the torque-speed plan. The bigger the wind is, the more torque the system could produce under a particular rotary speed. The following figure shows the torque speed curve under different wind speed.
Figure 3-2. Torque speed curve
The shaft speed of a wind turbine does not change immediately because of its inertia. The larger the turbine radius is, the more inertia a turbine has.
However, in this project, a real rotating system would be build up by two DC machines. The inertia of this system would be the inertia of the two DC machines. Therefore, a dynamic inertia should be introduced.
Dynamic inertia = Turbine inertia – System inertia
The dynamic torque represents the inertia of the turbine. In a wind turbine system, the inertia is assumed to provide a torque wherever there is acceleration in the rotary speed.
The following figure shows the block diagram of the wind turbine model with dynamic torque.
Figure 3-3. Block diagram of the wind turbine model
Performance
In this part, a number of important simulation results are shown. Detailed description of shape of the curve could be found in section 4.2.
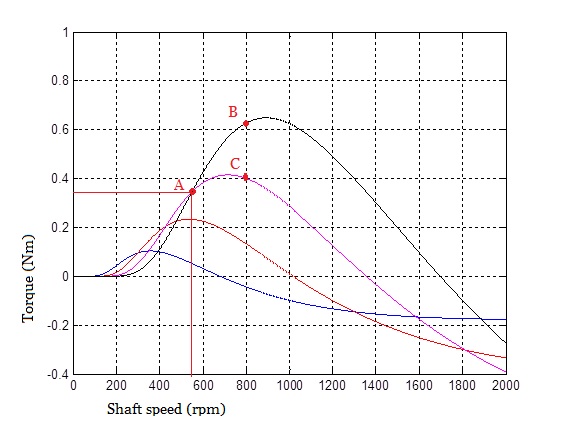
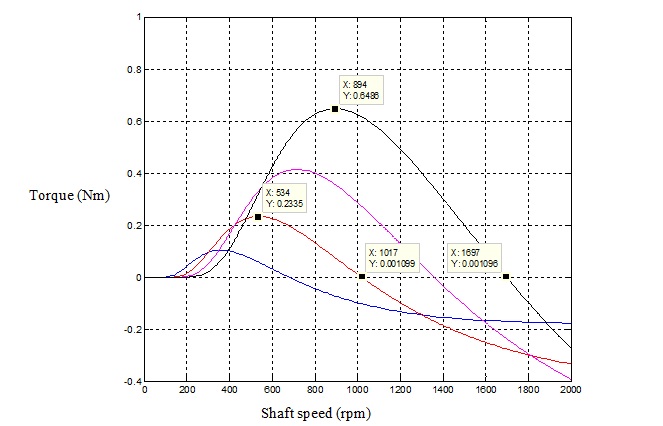
The following figure shows the simulation result of the turbine model torque speed curve. The turbine we simulated has a radius of 0.5 meter.
Color Wind speed Black 12km/h Purple 10km/h Red 8km/h Blue 5km/h
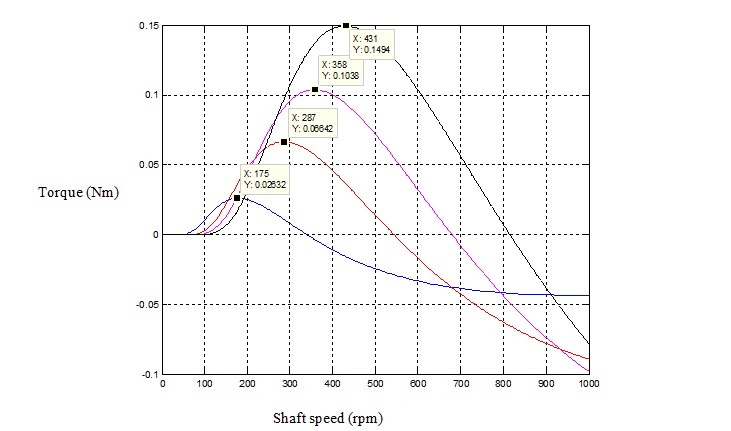
The following figure shows the simulated torque speed curve of a much larger wind turbine with radius of 1 meter and 20 meters respectively.
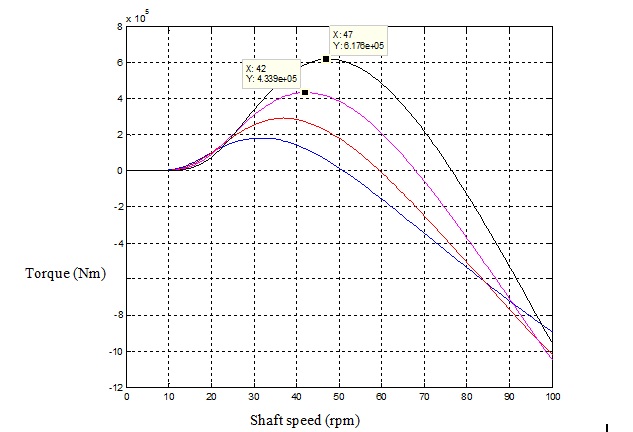
The following figure shows the torque speed curve of a large 20 meters wind turbine.
Test Result
In this test, the system was operated by the “exact controller”. In order to see the effect of the turbine inertia, step input wind and sine wave wind are applied to the system.
Red line – wind speed (m/s)
Green line – shaft torque (Nm)
Blue line – shaft speed (rpm)
The following figure shows the shaft torque and speed changes when the input wind drops suddenly from 7m/s to 6m/s. It could be seen that the torque changes largely as the wind speed changes. This is because when the wind changes, the TSR changes, therefore the power co-efficient changes. Due to this large drop on the torque, the shaft speed drops as well. However, the shaft speed drops slowly because we have added a dynamic torque to simulate the inertia of the turbine. As the rotation speed drops, the Cp is raising again. Therefore, the shaft torque rises again. The same thing happens in the case that the wind is rising. The following figure shows the case that a step input wind is applied to the system. The wind speed changes from 6m/s to 7m/s.
The following figure shows the test result under a sine wave input wind. When the wind speed (blue) is changing, there is a delay in the change of the shaft speed (blue) due to the turbine inertia. However, the changes in torque (green) are ahead of the changing in wind speed. This is because the relationship between TSR and power co-efficient.
Generator Design and Test
Maximum Power Point Tracking (MPPT)
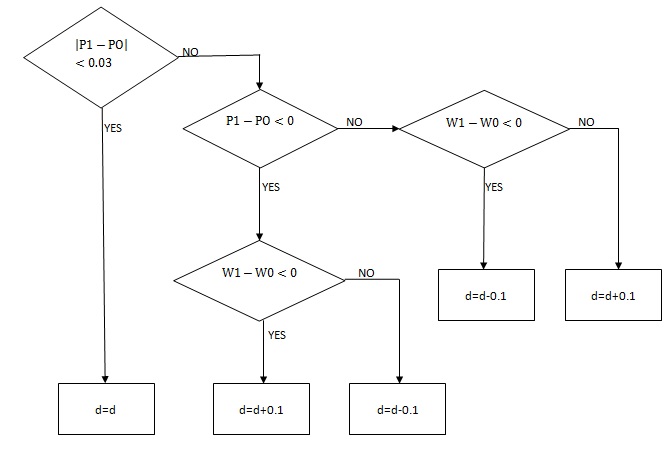
Maximum power point tracking means maximizing power extracted. It is a key factor which has critical role in improving wind system performance. It uses an MPPT algorithm to track wind turbine to capture maximum performance. The performance of a wind turbine depends mainly on wind power, turbine power and generator’s capability to respond to wind fluctuations. For different wind speed, the wind turbine could extract different level of output power. The MPPT algorithms adjust turbine speed and torque and the corresponding current and voltage delivers from wind turbine to generator. In our project, we have used Hill-Climb search algorithms to track maximum power point. The general processes of HCS method is to increase the rotor speed or torque when the power operates on the left side of the peak value and decrease the rotor speed or torque on the right side of the peak value continuously.
Figure 5-1 output torque vs. turbine speed curves
In order to keep the output power at peak value in firue 5-1, the Hill-Climb search algorithms will adjust turbine speed of system. This is our MPPT Matlab block which is shown below, the inputs are previous duty-cycle (d1), current (I), shaft speed (w), previous power (P_prev), previous shaft speed (w_prev) and delay time (T). The outputs are duty-cycle (d), reference torque (Topt=Tref), output power (P1). The memory block helps to keep the previous value and deliver to MPPT block next calculation.
Figure 5-2 MPPT algorithms in Matlab
Figure 5-3 the scope of MPPT algorithms
The output is duty-cycle directly instead of reference torque. The duty-cycle signal will send to D-space and control the H-bridge to adjust generator voltage.Thus changing duty-cycle will have effects on output power.
The results are showing below:
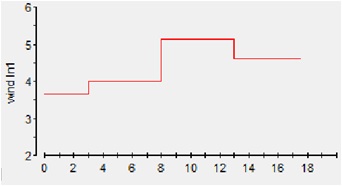
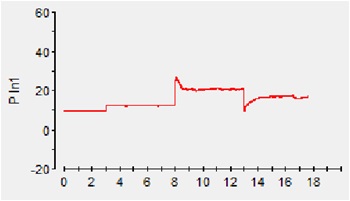
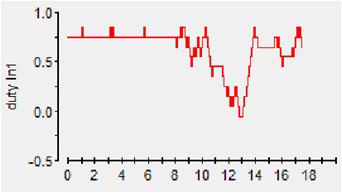
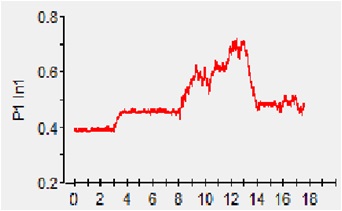
Figure 5-4 a)wind speed b)turbine power c) duty-cycle d) output power
From the results, it is obvious that at the same wind speed, the MPPT algorithms change the duty-cycle step by step until the output power at peak value.
Generator Testing Result
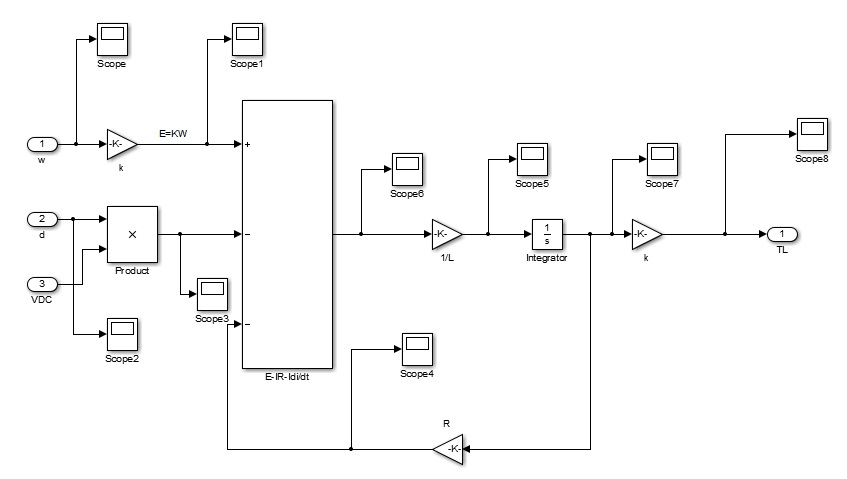
The generator could be simulated in the Matlab/Simulink software. In term of knowing the needed inputs and outputs of the generator, the model is easily built using basic DC machine equations. The figure 5-5 shows a simple generator model which according to the equation: E=U+IR+Ldi/dt. The detail is shown below. VDC is a constant voltage connected to the model.
Figure 5-5 the inside components of generator model
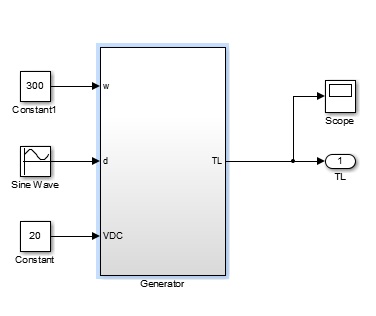
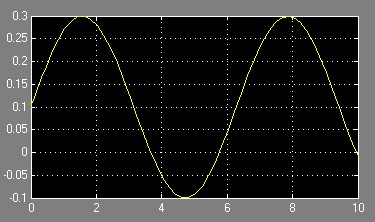
Figure 5-6 a) the generator block b) duty-cycle c) load torque
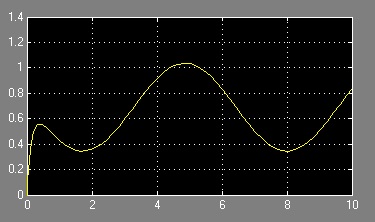
From the figure 5-6 a), constant voltage VDC= 20v, constant turbine speed w=300rpm. Changing duty-cycle as a sine wave to observe the output torque. When duty-cycle increases, output torque will decrease accordingly;when duty-cycle decreases,output power will increase. These results are based on the instantaneous condition because the turbine speed remains constant at 300rpm. These results mean when duty-cycle increases, the decreased output torque will impact on generator performace and shaft speed acceleration.Also, in actual wind turbine system, when duty-cycle increases, output voltage from H-bridge will increase which means the current will reduce. As a consequence, due to T=I*K, output torque will reduce.
Hardware Design and Construction
Motor Control Algorithms
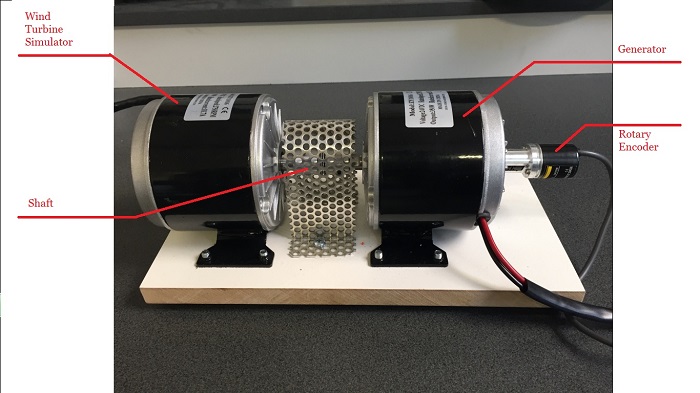
In order to build up a real rotating system to imitate the behavior of a wind turbine system, a DC motor is applied to act as the turbine while another DC motor is connected to behave as a generator.
Under a particular voltage, the relationship between torque and rotary speed is linear. Torque decreases while the shaft speed increases. There are generally 3 steps in the DC motor control algorithm of the system. Under a particular wind speed v and a specific shaft speed ω, the wind turbine simulator could derive a reference torque of the turbine system. Firstly, the controller will look at this torque from the wind turbine simulator. Then it would look at the torque speed curve of the DC motor and determine how much voltage is required to produce such amount of torque under this shaft speed. Lastly, the controller would apply this voltage to the motor by controlling the duty cycle of an H-bridge circuit board.
The “Exact controller” uses the exact parameters of the DC machines. By appropriate calculation and prediction based on these parameters, the “exact controller” is expected to determine an exact value of the real time supply voltage to the motor. Moreover, by adding a current feedback and a PI controller, the system could correct itself by comparing the expected current and the actual current. The “exact controller” is not a perfectly controller that controls the system precisely due to the error in data measurement. However, the advantage of this control algorithm is that motor speed changes more smoothly than using bang-bang controller.
Another important motor control algorithm is the bang-bang control. The bang-bang controller compares the actual current of the motor with the reference current. It then determines whether the motor is having a larger or smaller torque than the expected value. The controller therefore determines whether provide the motor a large voltage or a small one.
For both of these control algorithms, it is hard to start the motor by itself. This is because the co-efficient performance of a wind turbine is very low under a low shaft speed. It takes too long to start by itself. Therefore, we have set the lowest duty cycle of the controller to 25% to keep the machine could always start spinning fast.
Encoder Signal Processing
A single phase encoder is used in this project to measure the shaft speed of the motor. The encoder has a 200 resolution per round. It outputs 200 pules per round uniformly. By calculating this pules over time, the real time rotating speed is derived. This encoder reader is made in Simulink. The following figure shows how the encoder reader works. Firstly, the encoder pules are counted up by a counter. Then we take the discrete differential of this counted signal to obtain a signal of how fast this count is changing. Lastly, by multiplying with a specific gain value, a rotary speed with a unit of rpm is obtained.
In the further research of this wind turbine simulator, a two channel encoder could be used to avoid this additional calculation.
