Difference between revisions of "Projects:2016s1-121 Measurement of Transformer Parameters"
(→Method of Least Square for Phasors) |
(→Motivation) |
||
| (23 intermediate revisions by the same user not shown) | |||
| Line 4: | Line 4: | ||
=='''Student Name '''== | =='''Student Name '''== | ||
| + | |||
Chen Qiao | Chen Qiao | ||
| + | |||
Rahel Bekele Megersa | Rahel Bekele Megersa | ||
=='''Supervisors '''== | =='''Supervisors '''== | ||
| − | Dr. Andrew Alison Dr. Rastko Zivanovic | + | Dr. Andrew Alison |
| + | |||
| + | Dr. Rastko Zivanovic | ||
=='''Abstract'''== | =='''Abstract'''== | ||
| Line 17: | Line 21: | ||
=='''Motivation'''== | =='''Motivation'''== | ||
The demand for electrical power is significantly increasing in our world. This shows that the number of power transformers is growing enormously, which play main role by stepping up and down voltage levels within transmission network and also used in electronic equipment. Thus, while maintaining existing transformers and designing new transformer, especially for low voltage transformers, accuracy of transformer parameters should be given also one of the priorities. | The demand for electrical power is significantly increasing in our world. This shows that the number of power transformers is growing enormously, which play main role by stepping up and down voltage levels within transmission network and also used in electronic equipment. Thus, while maintaining existing transformers and designing new transformer, especially for low voltage transformers, accuracy of transformer parameters should be given also one of the priorities. | ||
| − | Our project, “Measurement of Transformer Parameter” has significance in this aspect as it investigates the | + | Our project, “Measurement of Transformer Parameter” has significance in this aspect as it investigates the method used for estimating transformer parameter, which is capable of providing more accurate values of the parameters. |
=='''Objective'''== | =='''Objective'''== | ||
| Line 26: | Line 30: | ||
=='''Introduction'''== | =='''Introduction'''== | ||
==''Transformer Parameter''== | ==''Transformer Parameter''== | ||
| − | Practically transformers produce loss during their operation life time. These losses are because of the electrical and mechanical characteristics of the transformers components, and thus they are considered as parameters | + | Practically transformers produce loss during their operation life time. These losses are because of the electrical and mechanical characteristics of the transformers components, and thus they are considered as parameters in transformer model[1]. The seven parameters of transformers are the following: |
| + | |||
-R1, R2: Represents the power loss due to the resistive characteristics of the windings | -R1, R2: Represents the power loss due to the resistive characteristics of the windings | ||
| − | -X1, X2: Represents the inductive property of the windings | + | |
| + | -X1, X2: Represents the inductive property of the windings due to flux leakage | ||
| + | |||
-Rc: Represents the eddy current and hysteresis power loss of the core | -Rc: Represents the eddy current and hysteresis power loss of the core | ||
| + | |||
-Xm: Represents the magnetization power needed to drive flux through the core | -Xm: Represents the magnetization power needed to drive flux through the core | ||
| − | |||
| + | -n(or a): the ratio of number of turns of primary to secondary winding | ||
| + | |||
| + | =='''Previous Study'''== | ||
| + | The previous project, “Estimation and Measurement of Transformer Parameters” has been taken as the basic input for our project. Developing Matlab code for least Square Spectral Analysis performed on the measured voltage and current values, applying T-parameters used to estimate the seven transformer parameters under linear condition, and developing non-linear model of transformer are the other aims of the project. | ||
| + | |||
| + | |||
| + | =='''Method and Result'''== | ||
==''Method of Least Square for Phasors''== | ==''Method of Least Square for Phasors''== | ||
| + | |||
Applying the fourier series theory [3] for a periodic function , having frequency of ω and N sample data, it can be represented as an infinite sum of cosine and sine terms of descrete frequency of integer multiple of ω. T | Applying the fourier series theory [3] for a periodic function , having frequency of ω and N sample data, it can be represented as an infinite sum of cosine and sine terms of descrete frequency of integer multiple of ω. T | ||
| − | We have used the LSSA to change AC current and voltage signal in time domain in to phasor domain due to the fact that phasor representation of signals can accurately represent the signals in time domain compared with RMS values of the signals. That means | + | We have used the LSSA to change AC current and voltage signal in time domain in to phasor domain due to the fact that phasor representation of signals can accurately represent the signals in time domain compared with RMS values of the signals. That means using phasor value of a sample data is equivalent to dealing with the instantaneous value of the sample taken during the experiment which can be used to estimate the best value of unknown variables in a model. [4]. |
[[File:Untitled.png]] | [[File:Untitled.png]] | ||
| − | ==''' | + | ==''Meter Measurement''== |
| − | The | + | |
| + | [[File:meter.jpg]] | ||
| + | |||
| + | ==''Physical Measurement''== | ||
| + | The physical measurement of the transformer has been performed by dismantling a transformer with identical model to the transformer under test (TR01-2016), The main objective is to reduce the seven (7) unknown parameters of the transformer 6 parameters, which can improve the Two-Port LSSA Method’s output value. The other aim of this experiment is to identify the transformer’s parameters, namely L1, L2, and Xm. This would be a comparison data for our main method result. The copper winding and the laminated core of the dismantled transformer is used for this part of the experiment | ||
| + | |||
| + | ==''One port Measurement, at low voltage and High voltage''== | ||
| + | |||
| + | [[File:lv hv.jpg]] | ||
| + | |||
| + | ==''Measurement Method Comparison''== | ||
| + | |||
| + | [[File:IMAG0388.jpg]] | ||
| + | |||
| + | |||
| + | The table above compares the impedance value of TR01-2016 for both primary and secondary winding obtained from different one-port measurement methods. | ||
| + | The trend of the comparison shows that the one-port least square method conducted in this project can be an intermediate between measuring with meter and open and short circuit test. It can be seen that as the method change from meter measurement to the one-port-least square method (by increasing the voltage source, VS), the model starts to change from ideal to simplified model where full rated voltage of the winding is suppled as an open circuit, the value of resistance increases. As the source voltage applied in the one-port network increased, the core resistance and magnetization reactance that exist in the core starts to be included, hence increasing the impedance obtained. | ||
| + | |||
| + | The secondary winding resistance value that has been found for One-port Least Square | ||
| + | at V s= 1.06V(RMS), and 100Hz, shows an error during running the matlab code or taking measured data from oscilloscope. It should be rechecked again. | ||
=='''Reference'''== | =='''Reference'''== | ||
[1]Soong, WL and Allison, AG 2014, ‘Electric Energy Systems’, School of Electrical and Electronic Engineering, University of Adelaide, SA. | [1]Soong, WL and Allison, AG 2014, ‘Electric Energy Systems’, School of Electrical and Electronic Engineering, University of Adelaide, SA. | ||
| + | |||
[2]P.C. Sen, "Principle of Electric Machine and Power Electronics", 2th ed. Ontario, Canada, Ch. 2 sec 2.2, pp. 50-53. | [2]P.C. Sen, "Principle of Electric Machine and Power Electronics", 2th ed. Ontario, Canada, Ch. 2 sec 2.2, pp. 50-53. | ||
| + | |||
| + | [3]Apostol, TM, “Mathematical Analysis", 2nd ed. California, USA, Ch. 15, sec 15-4, pp. 464-465 | ||
| + | [4]Huw Fox and Bill,Bolton, “Mathematics for Engineers and Technolofiessts", ISBN. 978-0-7506-5544-6., Ch. 1, , pp. 30. | ||
Latest revision as of 10:42, 27 October 2016
Contents
- 1 Project Title
- 2 Student Name
- 3 Supervisors
- 4 Abstract
- 5 Motivation
- 6 Objective
- 7 Introduction
- 8 Transformer Parameter
- 9 Previous Study
- 10 Method and Result
- 11 Method of Least Square for Phasors
- 12 Meter Measurement
- 13 Physical Measurement
- 14 One port Measurement, at low voltage and High voltage
- 15 Measurement Method Comparison
- 16 Reference
Project Title
Measurement of Transformer Parameters
Student Name
Chen Qiao
Rahel Bekele Megersa
Supervisors
Dr. Andrew Alison
Dr. Rastko Zivanovic
Abstract
This project is identifying a semi-automated method to perform best estimate of transformer parameters. The aim of the project is to use two-port network model to estimate the parameters for any transformer model using transmission parameters with less variable. The obtained data are analysed and compared with the corresponding values in different methods. It starts from an ideal and simplified transformer models, which applies one-port network on the transformer to be tested. The method of least squares is applied to obtain the best estimate input variables The optimization techniques, Lagrange Multiplier is also applied to minimise any discrepancy between the observed behaviour of a transformer and the predicted behaviour of the model. Analysis of non-linearity effects on transformer is the rest part of the project which involves identifying the characteristics in terms of magnetic field and current.
Motivation
The demand for electrical power is significantly increasing in our world. This shows that the number of power transformers is growing enormously, which play main role by stepping up and down voltage levels within transmission network and also used in electronic equipment. Thus, while maintaining existing transformers and designing new transformer, especially for low voltage transformers, accuracy of transformer parameters should be given also one of the priorities. Our project, “Measurement of Transformer Parameter” has significance in this aspect as it investigates the method used for estimating transformer parameter, which is capable of providing more accurate values of the parameters.
Objective
To develop a method for estimating the transformer parameters, the same transformers as the past project are used. To estimate the parameters, namely: winding resistance (R1, R2), winding leakage reactance (X1, X2), core resistance(Rc), and magnetizing reactance (Xm), four short circuit and open circuit tests are conducted on the transformer, setting it under unsaturated condition (linear model). From the test, the input and output voltages and currents of the transformer are measured. The 7th parameter is calculated through conducting a separate experiment, which involves winding a sensing coil on the transformer core.
Introduction
Transformer Parameter
Practically transformers produce loss during their operation life time. These losses are because of the electrical and mechanical characteristics of the transformers components, and thus they are considered as parameters in transformer model[1]. The seven parameters of transformers are the following:
-R1, R2: Represents the power loss due to the resistive characteristics of the windings
-X1, X2: Represents the inductive property of the windings due to flux leakage
-Rc: Represents the eddy current and hysteresis power loss of the core
-Xm: Represents the magnetization power needed to drive flux through the core
-n(or a): the ratio of number of turns of primary to secondary winding
Previous Study
The previous project, “Estimation and Measurement of Transformer Parameters” has been taken as the basic input for our project. Developing Matlab code for least Square Spectral Analysis performed on the measured voltage and current values, applying T-parameters used to estimate the seven transformer parameters under linear condition, and developing non-linear model of transformer are the other aims of the project.
Method and Result
Method of Least Square for Phasors
Applying the fourier series theory [3] for a periodic function , having frequency of ω and N sample data, it can be represented as an infinite sum of cosine and sine terms of descrete frequency of integer multiple of ω. T
We have used the LSSA to change AC current and voltage signal in time domain in to phasor domain due to the fact that phasor representation of signals can accurately represent the signals in time domain compared with RMS values of the signals. That means using phasor value of a sample data is equivalent to dealing with the instantaneous value of the sample taken during the experiment which can be used to estimate the best value of unknown variables in a model. [4].

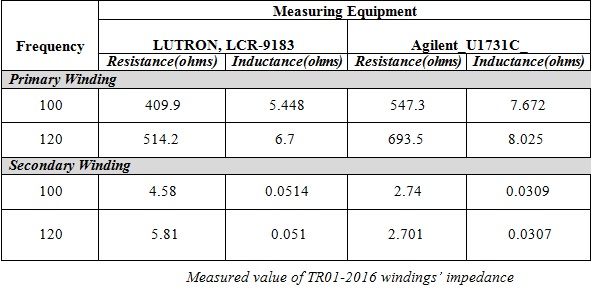
Meter Measurement
Physical Measurement
The physical measurement of the transformer has been performed by dismantling a transformer with identical model to the transformer under test (TR01-2016), The main objective is to reduce the seven (7) unknown parameters of the transformer 6 parameters, which can improve the Two-Port LSSA Method’s output value. The other aim of this experiment is to identify the transformer’s parameters, namely L1, L2, and Xm. This would be a comparison data for our main method result. The copper winding and the laminated core of the dismantled transformer is used for this part of the experiment
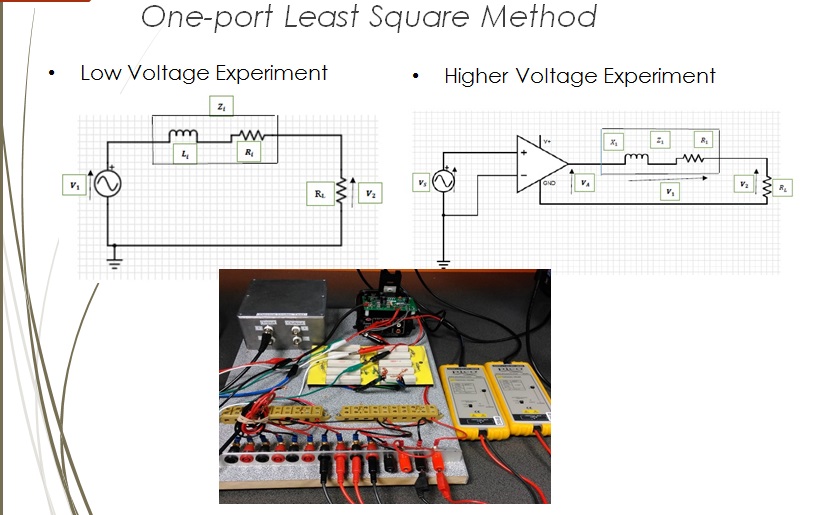
One port Measurement, at low voltage and High voltage
Measurement Method Comparison
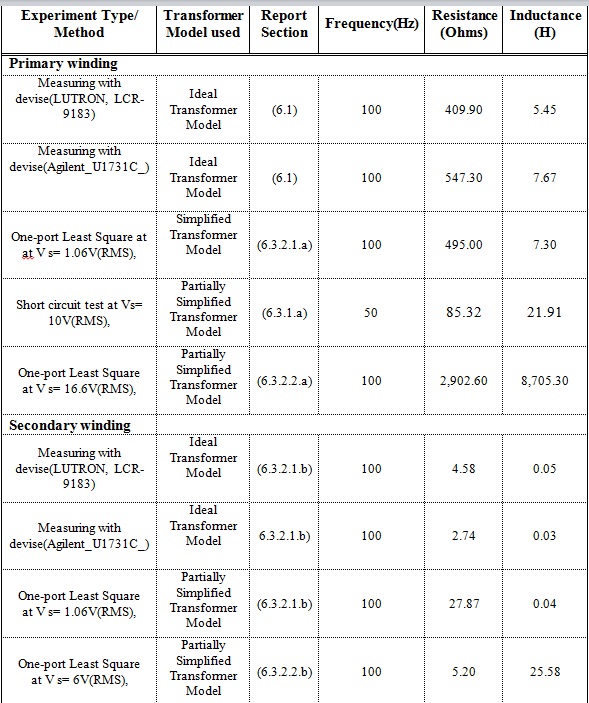
The table above compares the impedance value of TR01-2016 for both primary and secondary winding obtained from different one-port measurement methods.
The trend of the comparison shows that the one-port least square method conducted in this project can be an intermediate between measuring with meter and open and short circuit test. It can be seen that as the method change from meter measurement to the one-port-least square method (by increasing the voltage source, VS), the model starts to change from ideal to simplified model where full rated voltage of the winding is suppled as an open circuit, the value of resistance increases. As the source voltage applied in the one-port network increased, the core resistance and magnetization reactance that exist in the core starts to be included, hence increasing the impedance obtained.
The secondary winding resistance value that has been found for One-port Least Square at V s= 1.06V(RMS), and 100Hz, shows an error during running the matlab code or taking measured data from oscilloscope. It should be rechecked again.
Reference
[1]Soong, WL and Allison, AG 2014, ‘Electric Energy Systems’, School of Electrical and Electronic Engineering, University of Adelaide, SA.
[2]P.C. Sen, "Principle of Electric Machine and Power Electronics", 2th ed. Ontario, Canada, Ch. 2 sec 2.2, pp. 50-53.
[3]Apostol, TM, “Mathematical Analysis", 2nd ed. California, USA, Ch. 15, sec 15-4, pp. 464-465 [4]Huw Fox and Bill,Bolton, “Mathematics for Engineers and Technolofiessts", ISBN. 978-0-7506-5544-6., Ch. 1, , pp. 30.


