Difference between revisions of "Projects:2016s2-255 Solar Aquaponics"
(→Project Introduction) |
(→Improved Model) |
||
| (24 intermediate revisions by 2 users not shown) | |||
| Line 42: | Line 42: | ||
== System Implementation == | == System Implementation == | ||
| − | |||
| − | |||
| − | |||
=== Initial Model === | === Initial Model === | ||
| + | Group 2 had developed an initial Model. See [https://www.eleceng.adelaide.edu.au/students/wiki/projects/index.php/Projects:2016s1-181_Solar_Aquaponics#Solar_Aquaponic_System_Model_One Solar Aquaponic System Model One] | ||
| + | |||
=== Improved Model === | === Improved Model === | ||
| + | The improved solar aquaponic system model contains three main parts: '''Solar Power Subsystem''', '''Aquaponic Subsystem''' and '''Monitoring Subsystem'''. | ||
| + | [[File: Second model.jpg|500px|thumb|centre|The implement of second model]] | ||
| + | [[File: FlowChart_SAP.png|300px|thumb|right|Flow chart of an improved solar aquaponics system]] | ||
| + | |||
| + | === Solar Power Subsystem === | ||
| + | The major improvement on solar power subsystem is to design a sunlight tracker to increase the energy production. | ||
| + | |||
| + | ==== Sunlight Tracker Design ==== | ||
| + | Sunlight trackers increases the amount of energy harvested from the solar panels by maximising sunlight collection. Using azimuth sunlight tracker can significantly increase the energy production by 65% [13]. | ||
| + | The solar cells sets are placed on two sides divided by a board in the middle. Each side of the solar cells sets generate voltage and current. A 12V DC motor with an operating voltage range from 4.5V to 18V and 70 mA no load current will be used. Each solar cell has a rated voltage of 4.3V and hence a set of solar cells has a rated voltage of 12.9V. The current generated by the left-side may be different to the current generated by the right-side due to the Sun location. DC motor rotation direction depends on the polarity of current. Therefore, if the left-side current(I1) is larger than the right-side(I2), the current would rotate in anti-clockwise direction. Otherwise, it would rotate in clockwise direction. If the current difference is slight, the motor would stop working. It would happen only when the solar tracker is facing to the Sun during daytime. | ||
| + | |||
| + | [[File:TrackerCircuit.jpg|300px|thumb|center|Sunlight Tracker Circuit]] | ||
| + | |||
| + | To verify the design, solar cells sets on the both side would be replaced by two different current sources. By controlling the two different current sources magnitude, it shows the current difference between I1 and I2 is greater than 0.2A, the motor starts running. The larger the current difference is, the faster the motor runs. | ||
| + | [[File:Test.jpg.jpeg|300px|thumb|center|Sunlight Tracker Test Circuit]] | ||
| + | |||
| + | === Aquaponic Subsystem === | ||
| + | The major one among the improvements of the aquaponics model was the NFT part. In addition, the sizes of the fish tank and the grow media were increase. A bigger siphon was designed to direct water out of the grow media. | ||
| + | |||
| + | ==== NFT ==== | ||
| + | The most notable advantage of a NFT channel comparing to other forms of hydroponics is that the plant roots continuously contact to fair amount of water, air and nutrients. NFT also has other advantages including: | ||
| + | |||
| + | • Lower water consumption, higher space usage. | ||
| + | |||
| + | • Avoidance of the supply, disposal and cost problems related to media based systems. | ||
| + | |||
| + | • Environmentally friendliness. | ||
| + | |||
| + | A rectangular NFT channel of 1.5 metres was added to the system. As a result, the water is initially pumped up to the NFT, then flow into the grow media, then directed back to the fish tank. | ||
| + | |||
| + | The NFT channel is fixed on the frames of the system, with a slope of about 1:40 to ensure the water flow direction [12]. The water flow rate in the NFT is not essential and unlimited flow is acceptable. It means the pump duty would not affect the function of the NFT channel. | ||
| + | |||
| + | At the beginning of the NFT channel, where water comes in, a foam filter was attached to collect major solid wastes coming from fish tank [1]. This mechanical filter is easily detachable for regular cleaning. | ||
| + | |||
| + | ==== Siphon Design ==== | ||
| + | A 28-cm height siphon was designed in the new grow media, which is about 25 cm in depth. | ||
| + | |||
| + | In practical, the pump duty is set to 10 minutes for half an hour to realise the flood-and-drain irrigation in the grow media [1]. In this process, water level would keep rising to a specific level where triggers siphoning, then water level would keep dropping to a lower level where stops siphoning. With this method, the roots of plants in grow media can reach to nutrients carried by water without being soaked constantly, which can harm the roots [1]. | ||
| + | |||
| + | [[File:Siphon_model2.png|500px|thumb|center|new siphon design]] | ||
| + | |||
| + | The most inside stand pipe is 25 mm in diameter. The height of the stand pipe determines the starting level of siphoning. And water flow through the stand pipe out of the grow media. Outer pipe is 50 mm in diameter and sealed from the top but small openings were drilled close to its bottom end. The height of small openings determines the ending level of siphoning, and water would flow through openings into the stand pipe during siphoning. The clay protector is a pipe of 75 mm in diameter with a lid on top. Many small holes were drilled across the clay protector become its function is to let water flow inward freely and keep clay pellets out of the siphon. | ||
| + | |||
| + | === Monitoring Subsystem === | ||
| + | ==== System Integration ==== | ||
| + | To build a reliable and scalable system, sensing and sensors could be helpful to collect real-time parameters of the aquaponics system. The most important common feature of these sensors is that they should output a digital or analogue signal or a resistive value. Specifications including accuracy, resolution, calibration etc., should be considered in the design. | ||
| + | |||
| + | It is found that Arduino could be a suitable platform for this integration. Because it is a serial of products which is based on an open-source standard and wildly used in the world, and there are wide range of associated products and interface from which useful parts to the project can be chosen [4]. Additionally, they are tiny in term of size and cheap in terms of costs. | ||
| + | |||
| + | Among these Arduino boards, Arduino UNO was chosen to server the function. Because [5]: | ||
| + | |||
| + | 1. UNO can be powered by a wide range of voltage, that is 6 to 20 voltages. And it fits to the power system in current model, where 12 voltages DC is provided. | ||
| + | |||
| + | 2. UNO provides 6 analog pins and it is enough for current sensor integration. | ||
| + | |||
| + | 3. UNO provides 14 digital input or output pins and it is enough for receiving sensor signals and controlling pump. | ||
| + | |||
| + | 4. UNO has 32 KB memory space to store the program which would realise the function. | ||
| + | |||
| + | An additional realistic reason of choosing Arduino is that the initial model was using an Arduino UNO board already to control the water pump duty [3]. So, the design is only to be improved from here rather than to start from a different beginning. | ||
| + | |||
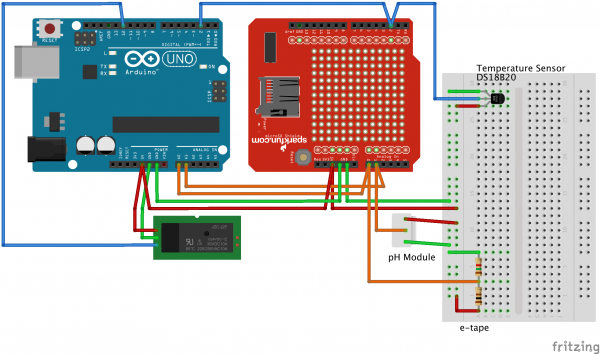
| + | Sensors are deployed to monitor several key ecological factors in the system, including temperature, water level and pH level. Real-time monitoring of these parameters is conducted and stored in digital format. The collected data are intended for integration with the developed model to allow an accurate yield prediction of fish and plants [8].[[File:AquaponicsMonitoringSystem bb.png|600px|thumb|center|circuit layout]] | ||
| + | |||
| + | ==== Water Level ==== | ||
| + | Water level is among the key parameters of the system, because it monitors the normality of water recircling. When the monitoring subsystem notice an extreme value from this sensor, alarm should be turned on. | ||
| + | |||
| + | Additionally, considering the management of the water chemical of the fish tank, first thing we need to know is the water volume. If this value is reasonably constant, it is easy to control chemicals in the water, then to determine the amount of fishes and plants. As a fish tank is often a regular shaped container, only water level is to be measured to find the volume. | ||
| + | |||
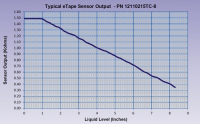
| + | To realise water level measurement, a sensor named eTape is identified to be integrated. An eTape sensor’s output resistance linearly varies according to the distance from the top of the sensor to water surface. The resistance gradient is 56/cm, and the resolution is no more than 0.25mm [6]. The length of the sensor (20 cm) is close the depth of the fish tank in the new model. Temperature Range is from -9°C to 65°C [6], which fits the symbiotic environment. The typical output characteristics of the sensor are show in the figure below: | ||
| + | |||
| + | [[File:etape_output.png|200px|thumb|right|Output characteristics of eTape sensor]] | ||
| + | |||
| + | The eTape sensor is attached to an internal side of the fish tank, part of it would be in the water. Because its output is a resistive value, voltage divider circuit is used to convert the output into a voltage value, which can be received by Arduino UNO via an analog pin. | ||
| + | |||
| + | ==== Water Temperature ==== | ||
| + | Water temperature may affect the fish growth rate and the activity of the bacteria. And different kinds of fish enjoy different optimal range. The sensor being used in the initial model is a standalone temperature meter with a sensor in the water, so it could not provide data to the monitoring subsystem. | ||
| + | |||
| + | In the new model, a temperature sensor DS18B20 and an adapter module are integrated. It can measure the temperature directly in the water in the fish tank. With pull-up resistor on board, the adapter module can be connected directly to a microcontroller such as Arduino UNO. Its resolution is up to 12 bits. Its measuring range is from -55 to 110 °C and the measuring accuracy is ±0.5°C [7]. These specifications meet the symbiotic environment. | ||
| + | |||
| + | The waterproof temperature sensor is attached in the middle bottom of the fish tank. The sensor is powered from Arduino UNO through the adapter module. The output from the adaptor module is a digital value which can be read from one of Arduino UNO digital pins [7]. | ||
| + | |||
| + | In the programming, the value is read from the associated digital pin, with the supports from these libraries: | ||
| + | • Wire bus | ||
| + | • Dallas Temperature | ||
| + | |||
| + | ==== pH Level ==== | ||
| + | The pH level would affect the efficiency of the process of nitrification [8]. And if it goes out of range, the fish and plant would be harmed [9]. So, it is important to monitor this value. In the initial model, two methods are used to measure pH level. Method A is to sample a small amount of water from the fish tank, add drops of another chemical, and wait for a while then compare to the colour card. This method is not accurate nor automatic. Method B is using a sensor branded as Vernier, which can send result to its own commercial software on a computer via USB cable, or to the App from same brand on a mobile device via Bluetooth. Method B indeed provides data but the data can only be available in its software environment, which is not open source and too expansive for scalable developing. Vernier has also developed interface between its sensors and Arduino board, but the costs are still high, which makes it out of the consideration in the integrated system. | ||
| + | |||
| + | In the new model, a pH electrode probe and its adapter module were integrated. The probe can be attached under water and measure the pH level in fish tank. It is powered by Arduino UNO through adapter module. The probe is connected to its adapter module via a BNC connector. The adapter module can be connected directly to Arduino UNO. The pH level measuring range of the probe is from 0 to 14, with an accuracy of ± 0.1pH at 25°C. Its response time is no more than 1 minute. Its working temperature is from 0 to 60 °C [4, 10]. | ||
| + | |||
| + | The output of the adapter is an analog voltage value so it is connected to an analog pin on Arduino UNO. The probe is attached on the fish tank to measure underwater. But before it was attached, the probe should be calibrated with three types of pH standard solution whose pH value are 4.00, 7.00 and 10.00, to figure out the offset of the probe [10]. The offset value can be easily changed in the programming as it is defined as a constant. To ensure a reliable pH reading, it is commonly recommended to regularly calibrate the probe monthly. | ||
| + | |||
| + | In the programming, the analog value is read from the pin, and calculated accordingly to indicate the real pH level. | ||
| + | |||
| + | ==== Data Collection ==== | ||
| + | After the data were calculated by the program, the Arduino program would write the data from sensors into a log file with .CSV suffix, which is stored in a SD card. This log file can be imported to the AnyLogic software model for yield prediction and data analysis. The 16GB SD card sits in the socket of a data logger shield. This shield is attached onto the Arduino UNO and designed specifically to log data [11]. | ||
| − | == Software Model Simulation | + | == Software Model Simulation == |
| − | + | Software Model Simulation was developed by Group 2. Please see their: [https://www.eleceng.adelaide.edu.au/students/wiki/projects/index.php/Projects:2016s1-181_Solar_Aquaponics#Software_Model_Simulation Software Model Simulation] | |
== Conclusion == | == Conclusion == | ||
| + | Solar Aquaponics Project was improved by Group 3 in Monitoring Subsystem, solar power subsystem and the aquaponics model. In Monitoring subsystem, sensors of water level, temperature and pH level in fish tank were integrated. As a result, data can be collected for yield prediction. A sunlight tracker was added to the power system for higher efficiency of solar energy harvest. A NFT channel was added to aquaponics model, where larger fish tank and grow media tub replaced the counterpart in the initial model. | ||
== Reference == | == Reference == | ||
| + | [1] S. Herbert and M. Herbert, Aquaponics in Australia, 1st ed. Mudgee, N.S.W.: Aquaponics Pty Ltd, 2008, pp. 7-59. | ||
| + | |||
| + | [2] G. Masters, Renewable and efficient electric power systems. pp. 550-565. | ||
| + | |||
| + | [3] H. Alabdullah and K. Zou, "Projects:2016s1-181 Solar Aquaponics", Projects wiki, 2016. | ||
| + | |||
| + | [4] J. Blum, Exploring Arduino. New York: John Wiley & Sons Inc, 2013, pp. 277-312. | ||
| + | |||
| + | [5] "Arduino - ArduinoBoardUno", Arduino.cc, 2017. [Online]. Available: https://www.arduino.cc/en/Main/ArduinoBoardUno. [Accessed: 16- Aug- 2016]. | ||
| + | |||
| + | [6] eTape Datasheet, 1st ed. Milone Technologies, Inc, pp. 1-2. | ||
| + | |||
| + | [7] "DS18B20 (digital temperature sensor) and Arduino", Arduino Project Hub. [Online]. Available: https://create.arduino.cc/projecthub/TheGadgetBoy/ds18b20-digital-temperature-sensor-and-arduino-9cc806. [Accessed: 06- Mar- 2017]. | ||
| + | |||
| + | [8] W. Lennard, Aquaponic System Design Parameters: Basic System Water Chemistry, 1st ed. Aquaponic Solutions, 2012, pp. 3-9. | ||
| + | |||
| + | [9] M. Badiola, D. Mendiola and J. Bostock, "Recirculating Aquaculture Systems (RAS) analysis: Main issues on management and future challenges", Aquacultural Engineering, vol. 51, pp. 29-32, 2012. | ||
| + | |||
| + | [10] "PH meter(SKU: SEN0161) - DFRobot Electronic Product Wiki and Tutorial: Arduino and Robot Wiki-DFRobot.com", Dfrobot.com. [Online]. Available: https://www.dfrobot.com/wiki/index.php/PH_meter(SKU:_SEN0161). [Accessed: 12- Apr- 2017]. | ||
| + | |||
| + | [11] B. Earl, Adafruit Data Logger Shield, 1st ed. Adafruit, 2015. | ||
| + | |||
| + | [12] A. Cooper, The ABC of NFT, 1st ed. Narrabeen, N.S.W.: Casper Publications, 1996. | ||
| + | |||
| + | [13]M. mehrtash, G. quesada, Y. dutil and D. rousse, "Performance Evaluation of Sun Tracking Photovoltaic Systems in Canada", pp. 3-4, 2012. | ||
Latest revision as of 21:44, 7 June 2017
Contents
Project Team
Team members
Yuqiang Li
Xinyu Dai
Supervisors
Rastko Zivanovic
Said Al-Sarawi
Project Introduction
Background
Aquaponics has a long history but the technologies are still developing. The fundamental idea is to transform fish waste into nutrient for plants in the process of nitrification, meanwhile the water is cleaned and recycle back to fish. This system is reasonably complex, because many parts are involved and many factors should be considered, such as dimension, symbiotic environment, chemicals, microbes, fish kinds and plants kinds [1]. An aquaponics system is basically sustainable but still requires electricity power. One of the sustainable power sources available is solar power. By carefully design and management, a solar aquaponics system can be feasible and scalable to large layout for commercial purpose.
Motivation
Aquaponics technologies are more and more demanded globally, with the increasing awareness of sustainable development. Bigger and bigger layout of aquaponics sites are seeking advanced technologies to ensure a robust system. So, the project developed technologies which can be utilised in a system which aims at scalable increasing and commercial purpose.
Solar Aquaponics is a continuous project. In the previous stage of this project, Group 1 has established the first software model with adapted and limited data, using a software named AnyLogic. They also developed a small solar aquaponics model for demonstration. Group 2 improved the software model, maintained the demonstration model, and initialise a bigger solar aquaponics model [3]. However, there are some constraints within this model that:
• Better system modelling required improved sensing and sensors,
• More feasible solutions were to be identified for industrial applications,
• Energy harvesting efficiency could be improved,
• Model scalability to allow larger system modelling with better fish and plants yield estimation.
Project Aim
Aiming industrial and commercial applications, we would like to build up an improved solar aquaponics module, where more parameters could be monitored, solar energy is harvest more efficiently, more fish are raised and more plants are cultivated. Our group are focusing on these targets:
a) to develop an integrated monitoring subsystem for data collection,
b) to improve the demonstration model, by increasing the size, adding growing methods and improving the structure,
c) to optimise the solar power conversion, by attaching a sunlight tracker to solar panels.
As group 3, we worked with group 2 during first half of our project, and worked with Group 4 during the second half. We were to develop a monitoring subsystem to which sensors were to be integrated, to improve and finish the design of the aquaponics model which would contain more fish and plants, and to design a sunlight tracker that would allow solar panels to follow the angle to the sun. The collected data would be exported from the software simulation model, where the yield can be predicted and then compared to the real amount.
System Implementation
Initial Model
Group 2 had developed an initial Model. See Solar Aquaponic System Model One
Improved Model
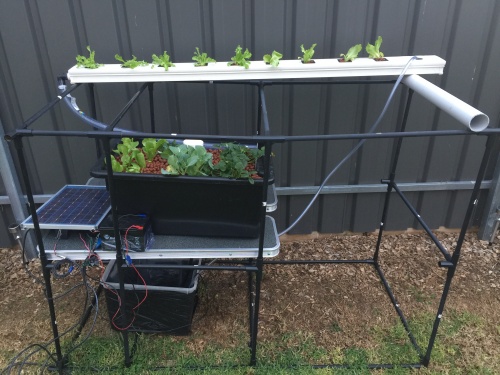
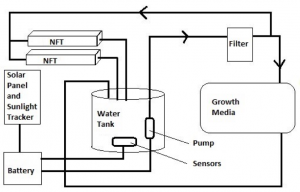
The improved solar aquaponic system model contains three main parts: Solar Power Subsystem, Aquaponic Subsystem and Monitoring Subsystem.
Solar Power Subsystem
The major improvement on solar power subsystem is to design a sunlight tracker to increase the energy production.
Sunlight Tracker Design
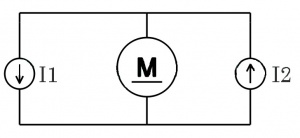
Sunlight trackers increases the amount of energy harvested from the solar panels by maximising sunlight collection. Using azimuth sunlight tracker can significantly increase the energy production by 65% [13]. The solar cells sets are placed on two sides divided by a board in the middle. Each side of the solar cells sets generate voltage and current. A 12V DC motor with an operating voltage range from 4.5V to 18V and 70 mA no load current will be used. Each solar cell has a rated voltage of 4.3V and hence a set of solar cells has a rated voltage of 12.9V. The current generated by the left-side may be different to the current generated by the right-side due to the Sun location. DC motor rotation direction depends on the polarity of current. Therefore, if the left-side current(I1) is larger than the right-side(I2), the current would rotate in anti-clockwise direction. Otherwise, it would rotate in clockwise direction. If the current difference is slight, the motor would stop working. It would happen only when the solar tracker is facing to the Sun during daytime.
To verify the design, solar cells sets on the both side would be replaced by two different current sources. By controlling the two different current sources magnitude, it shows the current difference between I1 and I2 is greater than 0.2A, the motor starts running. The larger the current difference is, the faster the motor runs.
Aquaponic Subsystem
The major one among the improvements of the aquaponics model was the NFT part. In addition, the sizes of the fish tank and the grow media were increase. A bigger siphon was designed to direct water out of the grow media.
NFT
The most notable advantage of a NFT channel comparing to other forms of hydroponics is that the plant roots continuously contact to fair amount of water, air and nutrients. NFT also has other advantages including:
• Lower water consumption, higher space usage.
• Avoidance of the supply, disposal and cost problems related to media based systems.
• Environmentally friendliness.
A rectangular NFT channel of 1.5 metres was added to the system. As a result, the water is initially pumped up to the NFT, then flow into the grow media, then directed back to the fish tank.
The NFT channel is fixed on the frames of the system, with a slope of about 1:40 to ensure the water flow direction [12]. The water flow rate in the NFT is not essential and unlimited flow is acceptable. It means the pump duty would not affect the function of the NFT channel.
At the beginning of the NFT channel, where water comes in, a foam filter was attached to collect major solid wastes coming from fish tank [1]. This mechanical filter is easily detachable for regular cleaning.
Siphon Design
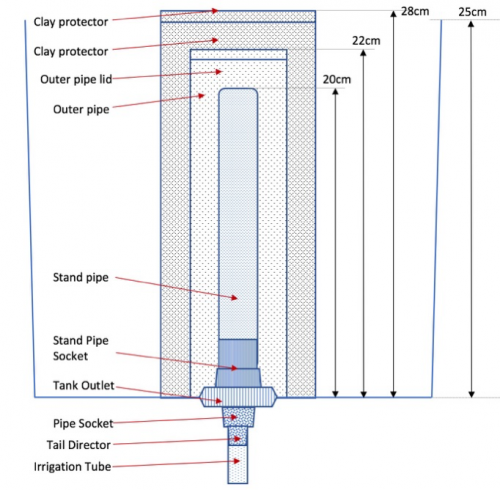
A 28-cm height siphon was designed in the new grow media, which is about 25 cm in depth.
In practical, the pump duty is set to 10 minutes for half an hour to realise the flood-and-drain irrigation in the grow media [1]. In this process, water level would keep rising to a specific level where triggers siphoning, then water level would keep dropping to a lower level where stops siphoning. With this method, the roots of plants in grow media can reach to nutrients carried by water without being soaked constantly, which can harm the roots [1].
The most inside stand pipe is 25 mm in diameter. The height of the stand pipe determines the starting level of siphoning. And water flow through the stand pipe out of the grow media. Outer pipe is 50 mm in diameter and sealed from the top but small openings were drilled close to its bottom end. The height of small openings determines the ending level of siphoning, and water would flow through openings into the stand pipe during siphoning. The clay protector is a pipe of 75 mm in diameter with a lid on top. Many small holes were drilled across the clay protector become its function is to let water flow inward freely and keep clay pellets out of the siphon.
Monitoring Subsystem
System Integration
To build a reliable and scalable system, sensing and sensors could be helpful to collect real-time parameters of the aquaponics system. The most important common feature of these sensors is that they should output a digital or analogue signal or a resistive value. Specifications including accuracy, resolution, calibration etc., should be considered in the design.
It is found that Arduino could be a suitable platform for this integration. Because it is a serial of products which is based on an open-source standard and wildly used in the world, and there are wide range of associated products and interface from which useful parts to the project can be chosen [4]. Additionally, they are tiny in term of size and cheap in terms of costs.
Among these Arduino boards, Arduino UNO was chosen to server the function. Because [5]:
1. UNO can be powered by a wide range of voltage, that is 6 to 20 voltages. And it fits to the power system in current model, where 12 voltages DC is provided.
2. UNO provides 6 analog pins and it is enough for current sensor integration.
3. UNO provides 14 digital input or output pins and it is enough for receiving sensor signals and controlling pump.
4. UNO has 32 KB memory space to store the program which would realise the function.
An additional realistic reason of choosing Arduino is that the initial model was using an Arduino UNO board already to control the water pump duty [3]. So, the design is only to be improved from here rather than to start from a different beginning.
Sensors are deployed to monitor several key ecological factors in the system, including temperature, water level and pH level. Real-time monitoring of these parameters is conducted and stored in digital format. The collected data are intended for integration with the developed model to allow an accurate yield prediction of fish and plants [8].
Water Level
Water level is among the key parameters of the system, because it monitors the normality of water recircling. When the monitoring subsystem notice an extreme value from this sensor, alarm should be turned on.
Additionally, considering the management of the water chemical of the fish tank, first thing we need to know is the water volume. If this value is reasonably constant, it is easy to control chemicals in the water, then to determine the amount of fishes and plants. As a fish tank is often a regular shaped container, only water level is to be measured to find the volume.
To realise water level measurement, a sensor named eTape is identified to be integrated. An eTape sensor’s output resistance linearly varies according to the distance from the top of the sensor to water surface. The resistance gradient is 56/cm, and the resolution is no more than 0.25mm [6]. The length of the sensor (20 cm) is close the depth of the fish tank in the new model. Temperature Range is from -9°C to 65°C [6], which fits the symbiotic environment. The typical output characteristics of the sensor are show in the figure below:
The eTape sensor is attached to an internal side of the fish tank, part of it would be in the water. Because its output is a resistive value, voltage divider circuit is used to convert the output into a voltage value, which can be received by Arduino UNO via an analog pin.
Water Temperature
Water temperature may affect the fish growth rate and the activity of the bacteria. And different kinds of fish enjoy different optimal range. The sensor being used in the initial model is a standalone temperature meter with a sensor in the water, so it could not provide data to the monitoring subsystem.
In the new model, a temperature sensor DS18B20 and an adapter module are integrated. It can measure the temperature directly in the water in the fish tank. With pull-up resistor on board, the adapter module can be connected directly to a microcontroller such as Arduino UNO. Its resolution is up to 12 bits. Its measuring range is from -55 to 110 °C and the measuring accuracy is ±0.5°C [7]. These specifications meet the symbiotic environment.
The waterproof temperature sensor is attached in the middle bottom of the fish tank. The sensor is powered from Arduino UNO through the adapter module. The output from the adaptor module is a digital value which can be read from one of Arduino UNO digital pins [7].
In the programming, the value is read from the associated digital pin, with the supports from these libraries: • Wire bus • Dallas Temperature
pH Level
The pH level would affect the efficiency of the process of nitrification [8]. And if it goes out of range, the fish and plant would be harmed [9]. So, it is important to monitor this value. In the initial model, two methods are used to measure pH level. Method A is to sample a small amount of water from the fish tank, add drops of another chemical, and wait for a while then compare to the colour card. This method is not accurate nor automatic. Method B is using a sensor branded as Vernier, which can send result to its own commercial software on a computer via USB cable, or to the App from same brand on a mobile device via Bluetooth. Method B indeed provides data but the data can only be available in its software environment, which is not open source and too expansive for scalable developing. Vernier has also developed interface between its sensors and Arduino board, but the costs are still high, which makes it out of the consideration in the integrated system.
In the new model, a pH electrode probe and its adapter module were integrated. The probe can be attached under water and measure the pH level in fish tank. It is powered by Arduino UNO through adapter module. The probe is connected to its adapter module via a BNC connector. The adapter module can be connected directly to Arduino UNO. The pH level measuring range of the probe is from 0 to 14, with an accuracy of ± 0.1pH at 25°C. Its response time is no more than 1 minute. Its working temperature is from 0 to 60 °C [4, 10].
The output of the adapter is an analog voltage value so it is connected to an analog pin on Arduino UNO. The probe is attached on the fish tank to measure underwater. But before it was attached, the probe should be calibrated with three types of pH standard solution whose pH value are 4.00, 7.00 and 10.00, to figure out the offset of the probe [10]. The offset value can be easily changed in the programming as it is defined as a constant. To ensure a reliable pH reading, it is commonly recommended to regularly calibrate the probe monthly.
In the programming, the analog value is read from the pin, and calculated accordingly to indicate the real pH level.
Data Collection
After the data were calculated by the program, the Arduino program would write the data from sensors into a log file with .CSV suffix, which is stored in a SD card. This log file can be imported to the AnyLogic software model for yield prediction and data analysis. The 16GB SD card sits in the socket of a data logger shield. This shield is attached onto the Arduino UNO and designed specifically to log data [11].
Software Model Simulation
Software Model Simulation was developed by Group 2. Please see their: Software Model Simulation
Conclusion
Solar Aquaponics Project was improved by Group 3 in Monitoring Subsystem, solar power subsystem and the aquaponics model. In Monitoring subsystem, sensors of water level, temperature and pH level in fish tank were integrated. As a result, data can be collected for yield prediction. A sunlight tracker was added to the power system for higher efficiency of solar energy harvest. A NFT channel was added to aquaponics model, where larger fish tank and grow media tub replaced the counterpart in the initial model.
Reference
[1] S. Herbert and M. Herbert, Aquaponics in Australia, 1st ed. Mudgee, N.S.W.: Aquaponics Pty Ltd, 2008, pp. 7-59.
[2] G. Masters, Renewable and efficient electric power systems. pp. 550-565.
[3] H. Alabdullah and K. Zou, "Projects:2016s1-181 Solar Aquaponics", Projects wiki, 2016.
[4] J. Blum, Exploring Arduino. New York: John Wiley & Sons Inc, 2013, pp. 277-312.
[5] "Arduino - ArduinoBoardUno", Arduino.cc, 2017. [Online]. Available: https://www.arduino.cc/en/Main/ArduinoBoardUno. [Accessed: 16- Aug- 2016].
[6] eTape Datasheet, 1st ed. Milone Technologies, Inc, pp. 1-2.
[7] "DS18B20 (digital temperature sensor) and Arduino", Arduino Project Hub. [Online]. Available: https://create.arduino.cc/projecthub/TheGadgetBoy/ds18b20-digital-temperature-sensor-and-arduino-9cc806. [Accessed: 06- Mar- 2017].
[8] W. Lennard, Aquaponic System Design Parameters: Basic System Water Chemistry, 1st ed. Aquaponic Solutions, 2012, pp. 3-9.
[9] M. Badiola, D. Mendiola and J. Bostock, "Recirculating Aquaculture Systems (RAS) analysis: Main issues on management and future challenges", Aquacultural Engineering, vol. 51, pp. 29-32, 2012.
[10] "PH meter(SKU: SEN0161) - DFRobot Electronic Product Wiki and Tutorial: Arduino and Robot Wiki-DFRobot.com", Dfrobot.com. [Online]. Available: https://www.dfrobot.com/wiki/index.php/PH_meter(SKU:_SEN0161). [Accessed: 12- Apr- 2017].
[11] B. Earl, Adafruit Data Logger Shield, 1st ed. Adafruit, 2015.
[12] A. Cooper, The ABC of NFT, 1st ed. Narrabeen, N.S.W.: Casper Publications, 1996.
[13]M. mehrtash, G. quesada, Y. dutil and D. rousse, "Performance Evaluation of Sun Tracking Photovoltaic Systems in Canada", pp. 3-4, 2012.
