Difference between revisions of "Projects:2018s1-191 Quasi-Linear Circuit Theory"
(→Simulations) |
|||
| (10 intermediate revisions by the same user not shown) | |||
| Line 20: | Line 20: | ||
| − | |||
== '''Method''' == | == '''Method''' == | ||
| Line 31: | Line 30: | ||
i. Linear Circuit elements have matrices, where diagonals are the non-zero elements | i. Linear Circuit elements have matrices, where diagonals are the non-zero elements | ||
i.e. R --> [R](figure1a) , 1/(jwc) --> [(1/jwL)](figure1b) ect. | i.e. R --> [R](figure1a) , 1/(jwc) --> [(1/jwL)](figure1b) ect. | ||
| − | Figure1a)Resistor Matrix | + | Figure1a)Resistor Matrix Figure1b)Capacitor Matrix |
<br />[[File:Resistor.jpg]] [[File:Capacitor.jpg]] | <br />[[File:Resistor.jpg]] [[File:Capacitor.jpg]] | ||
| Line 46: | Line 45: | ||
<br />c) 2)All the circuit elements are modeled as square matrices. If circuit element has a defined mathematical model and is linear i.e. V(L)=Ldi/dt then resulting matrix is a square diagonal matrix with all off-axis elements being 0 as seen in figure1a & figure1b.If circuit element is non-linear , the circuit element's matrix can be determined using least squares estimation.This is done by testing the circuit element with a large number of linearly independent periodic signals to which the circuit elements responses is measured and stored. The transfer matrix can then be found using the generalised inverse of Moore and Penrose to obtain the least-squares estimate of the non-linear device. | <br />c) 2)All the circuit elements are modeled as square matrices. If circuit element has a defined mathematical model and is linear i.e. V(L)=Ldi/dt then resulting matrix is a square diagonal matrix with all off-axis elements being 0 as seen in figure1a & figure1b.If circuit element is non-linear , the circuit element's matrix can be determined using least squares estimation.This is done by testing the circuit element with a large number of linearly independent periodic signals to which the circuit elements responses is measured and stored. The transfer matrix can then be found using the generalised inverse of Moore and Penrose to obtain the least-squares estimate of the non-linear device. | ||
| − | |||
| − | |||
| − | |||
| − | |||
| − | |||
| − | |||
| − | |||
| − | |||
== '''Simulations''' == | == '''Simulations''' == | ||
| − | Testing of theory on linear circuit involved using MATLAB. MATLAB code for converting signals into complex fourier coefficients i.e. CFA was provided by Dr Allision, All sources are converted to complex vectors and circuit elements are represented using square matrices.The time domain of the RC circuit is seen ins seen in | + | Testing of theory on linear circuit involved using MATLAB. MATLAB code for converting signals into complex fourier coefficients i.e. CFA was provided by Dr Allision, All sources are converted to complex vectors and circuit elements are represented using square matrices.The time domain of the RC circuit is seen ins seen in figure2a and the transformation of sources to complex Fourier coefficients and circuit elements to square matrices is seen in figure2b.As resistor and capacitor are both linear devices, their respective matrices (figure2b) only contain elements in the diagonal andall off-axis elements are 0. |
Once all the sources and circuit elements have been transformed, normal circuit analysis can take place. To illustrate this, the voltage across the capacitor was found and its output can be seen in figure1d. Vc was solved using solved using voltage divider i.e. Vc=(Vs*Zc)/(Zc+Zr) , but as matrices are not divisible the inverse operation is used instead, | Once all the sources and circuit elements have been transformed, normal circuit analysis can take place. To illustrate this, the voltage across the capacitor was found and its output can be seen in figure1d. Vc was solved using solved using voltage divider i.e. Vc=(Vs*Zc)/(Zc+Zr) , but as matrices are not divisible the inverse operation is used instead, | ||
| Line 66: | Line 57: | ||
| − | + | Figure2a)Time Domain of RC Circuit | |
<br />[[File:RC_Time.jpg]] | <br />[[File:RC_Time.jpg]] | ||
| − | <br /> | + | <br />Figure2b)QLCT of RC Circuit |
[[File:RC_QLCT.jpg]] | [[File:RC_QLCT.jpg]] | ||
| − | <br /> | + | <br />Figure2c)LTSPICE Simulation of RC Circuit |
<br />[[File:LTSPICE_RC.jpg]] | <br />[[File:LTSPICE_RC.jpg]] | ||
| − | <br /> | + | <br />Figure2d)Comparison |
<br />[[File:QLCTVsRC.jpg]] | <br />[[File:QLCTVsRC.jpg]] | ||
| + | |||
| + | Figure2d, a comparison of output from LTSPICE simulation vs output using proposed theory, confirms the validity of using complex Fourier series as a basis in circuit analysis of linear circuit. | ||
| + | |||
| + | Estimation of transfer matrix H i.e. linear operator of diode, using least squares estimate by testing diode with a large 50Hz signal and large 50Hz signal with small amounts different harmonics added to it. Output of diode from these tests was taken and H was estimated by multiplying Output of diode with generilised inverse of input. Figure 3a shows the array of input signals each with different harmonics injected into them. The component can be probed with a large number of linearly independent periodic signals, and the responses can be measured. It is then possible to use the generalised inverse of Moore and Penrose to obtain the best least-squares estimate of the required operator.This H matrix can be seen in figure3b. | ||
| + | |||
| + | <br />Figure3a)Input Signals with different harmonics injected in; | ||
| + | <br />[[File:signals_harmonics.jpg]] | ||
| + | |||
| + | |||
| + | |||
| + | |||
| + | <br />Figure3b)H matrix(Dr. Allison) | ||
| + | <br />[[File:H.jpg]] | ||
| + | |||
| + | |||
| + | |||
| + | H matrix was tested using samples from a signal generator and compared. The resulting outputs and comparisons are seen in figure3d.Figure3d shows that determining H from a simulation and using that on real world data does not work. The RMS error between Vdiode from experiment and Vdiode using H linear operator is huge and the resulting current Idiode also has large errors. However the actual graphs despite the large errors do show promise as the resulting waveforms do look close to what was expected. Therefore in order to determine linear operator H, need to do actual experiment using actual device. | ||
| + | |||
| + | |||
| + | <br />Figure3d)Comparison | ||
| + | <br />[[File:Using_H_Operator.jpg]] | ||
== '''Experiments''' == | == '''Experiments''' == | ||
| − | + | The purpose of this experiment was to determine if the proposed theory could handle a non-sinusoidal periodic signal with a circuit containing a device which was linear around its operating point. The setup of the proposed experiment can be seen in figure4a | |
| + | Figure4a) | ||
| + | [[File:setup1.jpg]] | ||
| + | |||
| + | |||
| + | Experiment3 involved testing the proposed theory on a circuit with a non-sinusoidal periodic signal with a circuit containing a non-linear device. The non-sinusoidal periodic input signal is limited to sine wave with small amounts of harmonics. This is representative of real world conditions where mains power is sinusoidal with only a small number of harmonics of an amplitude approx-35dB down from the fundamental frequency of 50Hz. This is confirmed from testing of mains power at the university laboratory NG06 as seen in figure 4b. Therefore when analysing circuits containing non-linear devices, proposed theory can be limited to deal with only non-sinusoidal signals containing harmonics with amplitudes approx.. 35dB below the fundamental frequency i.e. 176% smaller than the fundamental.Figure4c shows setup of experiment3. | ||
| + | |||
| + | Figure4b) | ||
| + | [[File:power2.jpg]] | ||
| − | + | Figure4c) | |
| + | [[File:setup2.jpg]] | ||
== '''Conclusion''' == | == '''Conclusion''' == | ||
| + | The following summaries the achievements of project: | ||
| + | |||
| + | <br />Proposed Theory of using complex Fourier domain to perform circuit analysis on sinusoidal signals and linear circuit element works. | ||
| + | |||
| + | <br />Proposed theory works with a non-sinusoidal periodic signals so long as all circuit elements are linear. | ||
| + | |||
| + | <br />Proposed theory works with sinusoidal periodic signals with small distortions i.e. limited number of harmonics and small amplitude of said harmonics with non-linear circuit elements. | ||
== '''Future Work''' == | == '''Future Work''' == | ||
| + | |||
| + | Due to time constraints the H matrix of only 1 240 to25V transformer was determined, the H matrix of a diode (1N4148) was found through simulation i.e. injecting low level harmonics into diode model in MATLAB. The diodes actual H matrix should be found using the same technique as discussed for experiment3.Transfer matrices for other transformers could also be found and a circuit comprised of these elements could be devised to test proposed theory properly. | ||
| + | |||
| + | Using the H matrix found for the transformer and other devices a simulation of a small power network could be built up, as shown in figure5a. Using QLCT theory, the flow of harmonics around a typical power network could be found. | ||
| + | |||
| + | Figure5a | ||
| + | [[File:transfer.jpg]] | ||
| + | |||
| + | Knowing the flow of harmonics through a circuit such as the one shown in the above figure. Power from different harmonics could be shifted to other parts of the network,. With the knowledge of where specific harmonics were the largest, harmonic filters could be placed accurately and be used to reduce harmonics in one section of the network and the power from the removed harmonics could be added into another sections of the network. . | ||
| + | Due to the number of tests required in building up the linear operator H i.e. for the transformer 27 tests were performer to get errors down. This procedure is cumbersome on a traditional oscilloscope and significant time. Automation of this procedure would be a significant step and would result in ease of procedure to obtain H matrices of various devices with relative ease, making proposed theory more useable and attractive to potential users. The modulator devised and built for experiment3 makes use of an zero-crossing detector and an Arduino to change the control signal Vc i.e into multiples of the fundamental frequency f, this means that a script could be written to change the frequency of the control signal and hence harmonic injected automatically over a range of cases, this combined with the use of a pico-scope which also can be loaded with python scripts to tell it to save X channels at Y times would result in automation of this procedures . | ||
| + | This automation would not be significantly hard to achieve, as already mentioned due to the use of the Arduino to generate multiples of the fundamental frequency f. This would prove to be a great starting point for another project. | ||
== '''References''' == | == '''References''' == | ||
Latest revision as of 23:58, 21 October 2018
Contents
Project Team
Students
- Yuan Yao a1674092
- Zizheng Ren a1680576
- Bruk Waldron a1645521
Supervisors
- Dr. Andrew Allison
- Prof. Derek Abbott
Introduction
As electrical power networks become more complicated, it becomes more important to analyse and control power quality. Harmonic is one of the most important aspect of power quality. Harmonics are defined as sinusoidal voltages or currents having frequencies that are integer multiples of the fundamental frequency in electric power system. Too much harmonic contents in power network will cause various problems such as excessive losses and heating in induction and synchronous machine, incorrect readings on meters and interference with other electronic devices and systems and so on. Some serious problems will lead to malfunction and even collapse of entire power system. Therefore, it is important for engineers to analyse and control harmonics for better power quality and normal operation of power system. One significant source of harmonics is the non-linear load. As non-linear loads create harmonics by drawing current in abrupt short pulses, rather than in a smooth sinusoidal manner. However, there is no suitable and sufficient circuit theory to model harmonics and their effect at the moment. As a result, the lack of theory has attracted our interest and inspired us to investigate this issue. We believe that the periodic analysis is one possible solution.
The aim of this project is to construct a complete and consistent circuit analysing theory to model non-linearity and effect of harmonics in electric circuits. To achieve this, the detailed periodic analysing method should be specified. A good notation to model circuit elements need to be determined. Simulation will be carried out using MATLAB and Simulink in terms of investigating the circuit response with non-linear load and non-sinusoidal signal. Finally, a complete theory will be proposed as described in project aim.
Method
Proposed theory uses the complex Fourier series as a basis for performing circuit analysis. Propitiation is to use the complex Fourier series as a type of domain i.e. similar to using the frequency or Laplace domain to performing circuit analysis. Hence it is an alternative to using traditional methods such as phasors.
Proposed Quasi Linear Circuit Theory;
a)Circuit sources are represented as vectors of complex numbers i.e. Vs(t) --> |Vs>
b)Circuit elements are represented as square matrices
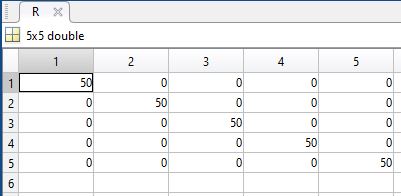
    i.	Linear Circuit elements have matrices, where diagonals are the non-zero elements
       i.e. R --> [R](figure1a) , 1/(jwc) --> [(1/jwL)](figure1b) ect.
Figure1a)Resistor Matrix Figure1b)Capacitor Matrix

ii. Non-Linear circuit elements have non-zero off-axis’s elements, but the diagonal elements are still dominant i.e. largest
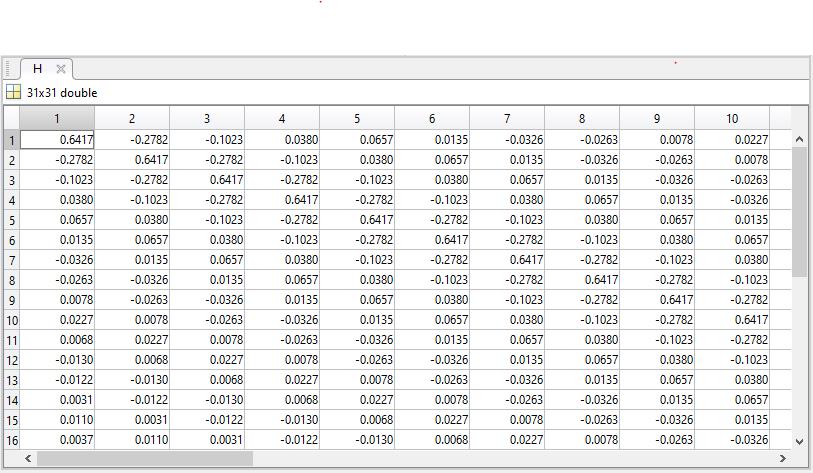
c)Given a non-linear device, a linear operator H i.e. a transfer matrix [H] can determined, which represents the least squares estimate of the non-linear process of the device.The transfer matrix [H] of a diode is shown in figure1c.
Figure1c)Transfer Matrix H for Diode
c)The following outlines the QCLT methodology given a time domain circuit)
c) 1)Al the circuit sources are converted to the complex Fourier domain.This is done by computing the signals complex Fourier series. The result of this transformation is a vector containing complex Fourier coefficients which using Dirac’s notation is l |V1⟩, hence V1(t) --> |V1⟩.
c) 2)All the circuit elements are modeled as square matrices. If circuit element has a defined mathematical model and is linear i.e. V(L)=Ldi/dt then resulting matrix is a square diagonal matrix with all off-axis elements being 0 as seen in figure1a & figure1b.If circuit element is non-linear , the circuit element's matrix can be determined using least squares estimation.This is done by testing the circuit element with a large number of linearly independent periodic signals to which the circuit elements responses is measured and stored. The transfer matrix can then be found using the generalised inverse of Moore and Penrose to obtain the least-squares estimate of the non-linear device.
Simulations
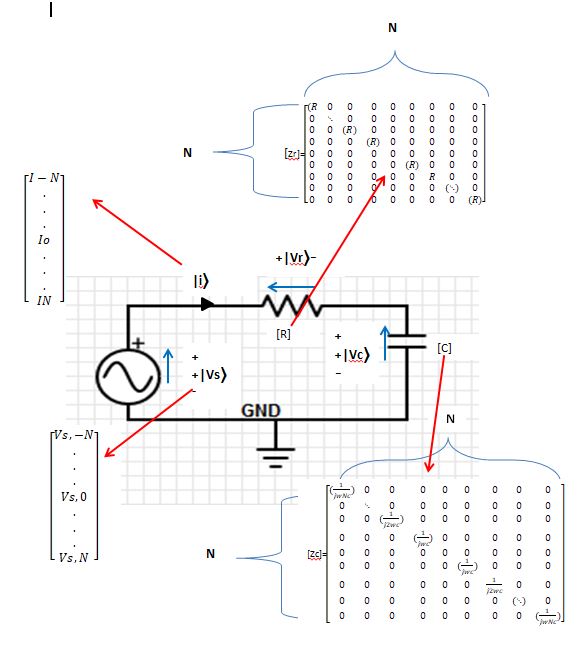
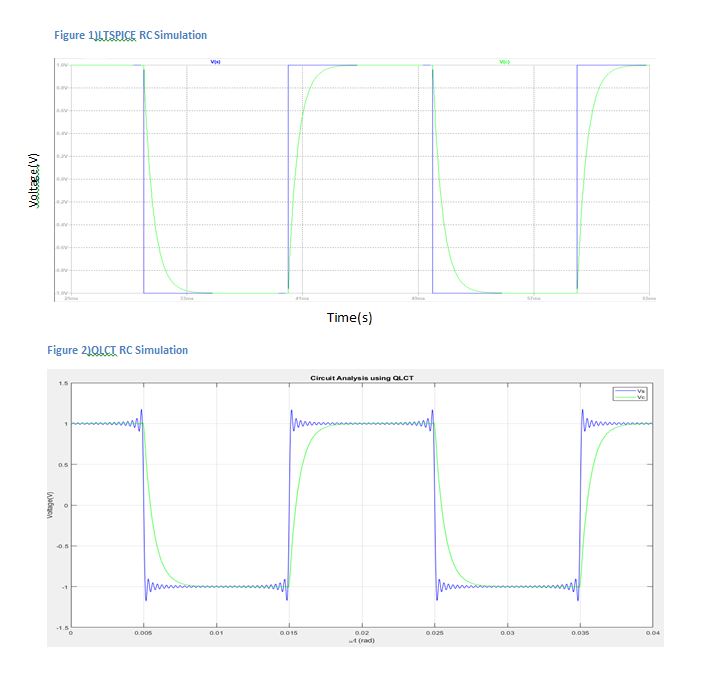
Testing of theory on linear circuit involved using MATLAB. MATLAB code for converting signals into complex fourier coefficients i.e. CFA was provided by Dr Allision, All sources are converted to complex vectors and circuit elements are represented using square matrices.The time domain of the RC circuit is seen ins seen in figure2a and the transformation of sources to complex Fourier coefficients and circuit elements to square matrices is seen in figure2b.As resistor and capacitor are both linear devices, their respective matrices (figure2b) only contain elements in the diagonal andall off-axis elements are 0.
Once all the sources and circuit elements have been transformed, normal circuit analysis can take place. To illustrate this, the voltage across the capacitor was found and its output can be seen in figure1d. Vc was solved using solved using voltage divider i.e. Vc=(Vs*Zc)/(Zc+Zr) , but as matrices are not divisible the inverse operation is used instead,
Hence have [vc]=([vs]*[zc])*[Zc+Zr]^(-1) i.e.and using dirac notation Have |Vc>=(|Vc>*[zc])*inverse[Zc+Zr] , Hence |Vc> can be converted from complex Fourier series domain using IDTFT for DS (again provided by Dr. Allison).
Figure2a)Time Domain of RC Circuit
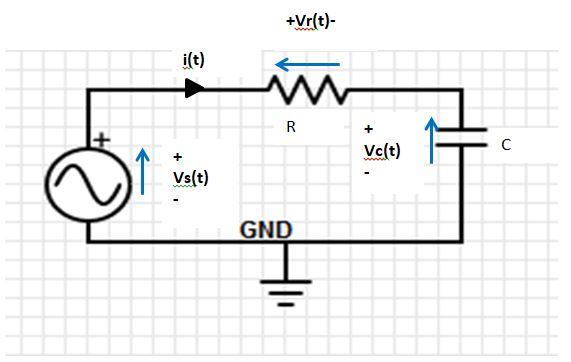
Figure2c)LTSPICE Simulation of RC Circuit
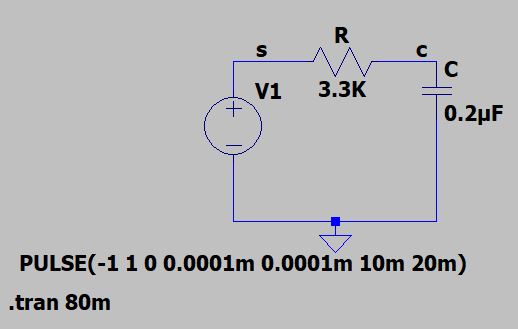
Figure2d, a comparison of output from LTSPICE simulation vs output using proposed theory, confirms the validity of using complex Fourier series as a basis in circuit analysis of linear circuit.
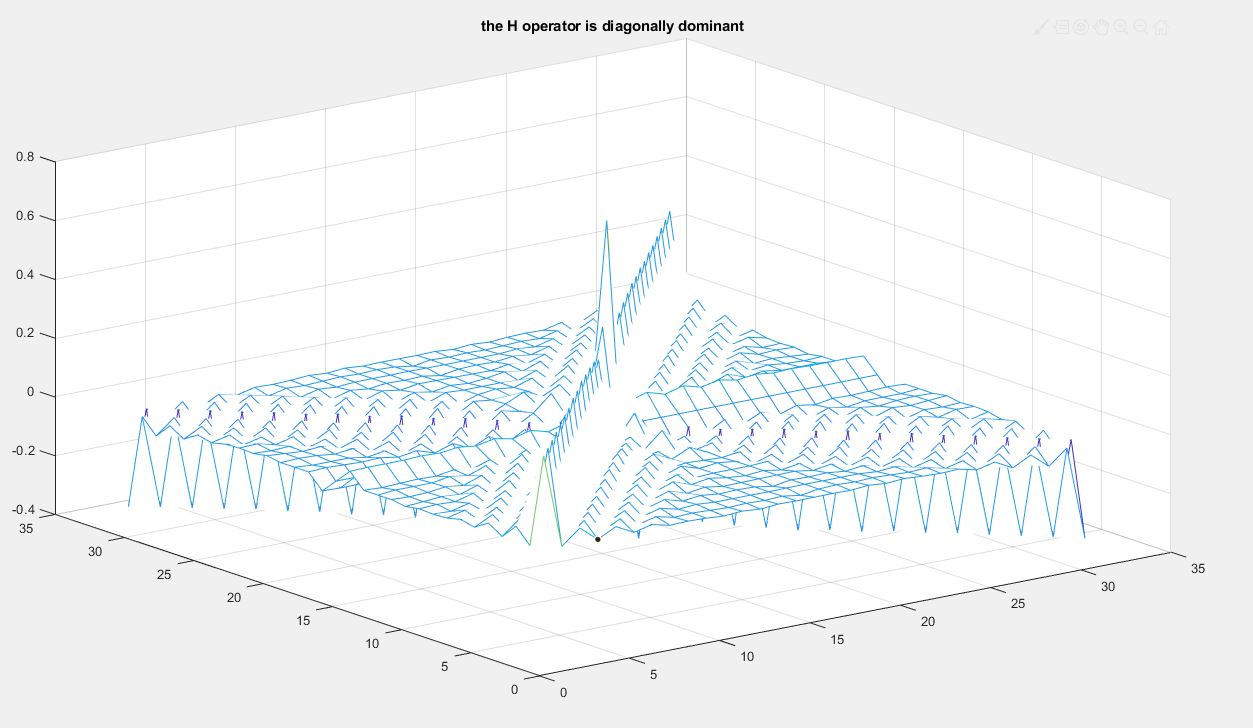
Estimation of transfer matrix H i.e. linear operator of diode, using least squares estimate by testing diode with a large 50Hz signal and large 50Hz signal with small amounts different harmonics added to it. Output of diode from these tests was taken and H was estimated by multiplying Output of diode with generilised inverse of input. Figure 3a shows the array of input signals each with different harmonics injected into them. The component can be probed with a large number of linearly independent periodic signals, and the responses can be measured. It is then possible to use the generalised inverse of Moore and Penrose to obtain the best least-squares estimate of the required operator.This H matrix can be seen in figure3b.
Figure3a)Input Signals with different harmonics injected in;
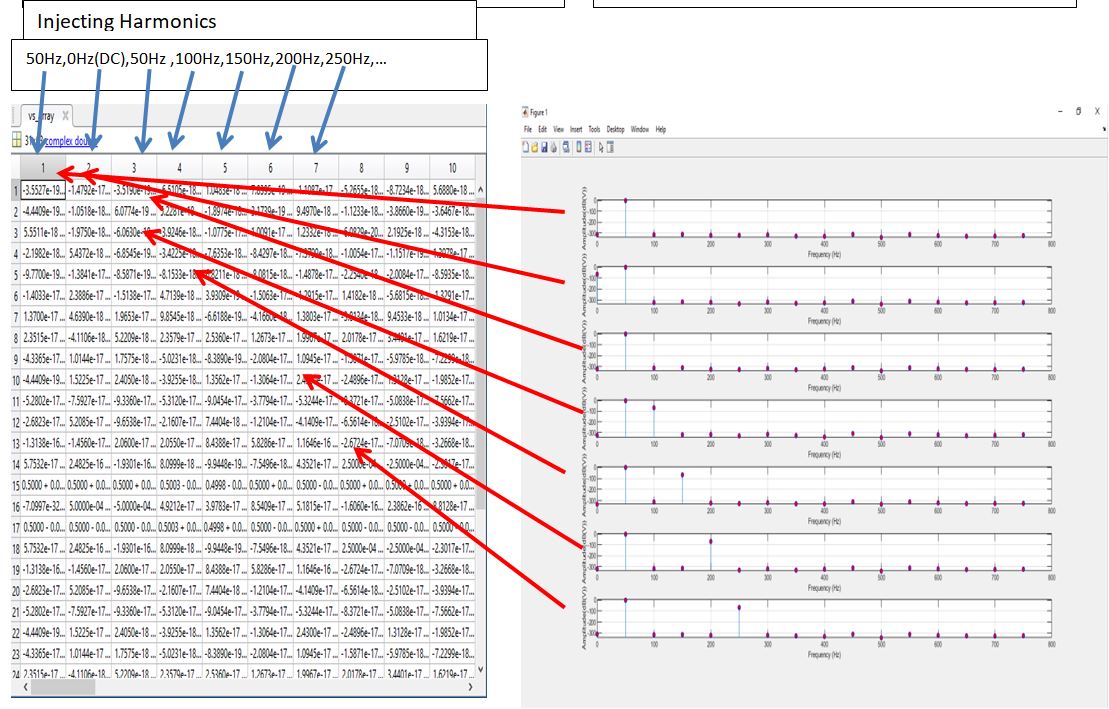
Figure3b)H matrix(Dr. Allison)
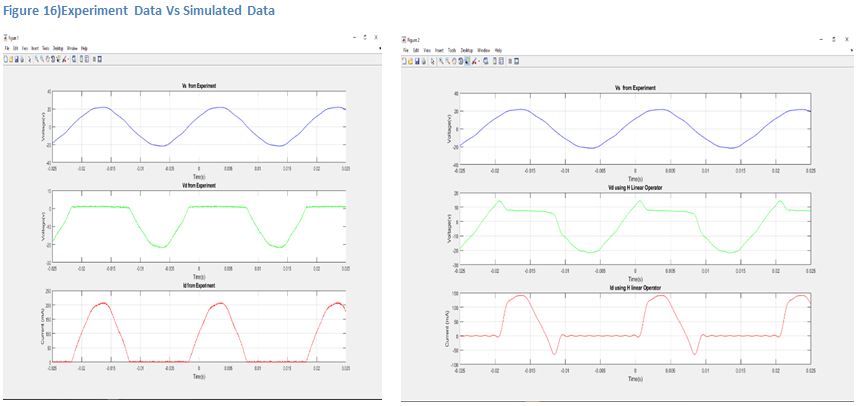
H matrix was tested using samples from a signal generator and compared. The resulting outputs and comparisons are seen in figure3d.Figure3d shows that determining H from a simulation and using that on real world data does not work. The RMS error between Vdiode from experiment and Vdiode using H linear operator is huge and the resulting current Idiode also has large errors. However the actual graphs despite the large errors do show promise as the resulting waveforms do look close to what was expected. Therefore in order to determine linear operator H, need to do actual experiment using actual device.
Experiments
The purpose of this experiment was to determine if the proposed theory could handle a non-sinusoidal periodic signal with a circuit containing a device which was linear around its operating point. The setup of the proposed experiment can be seen in figure4a
Figure4a)
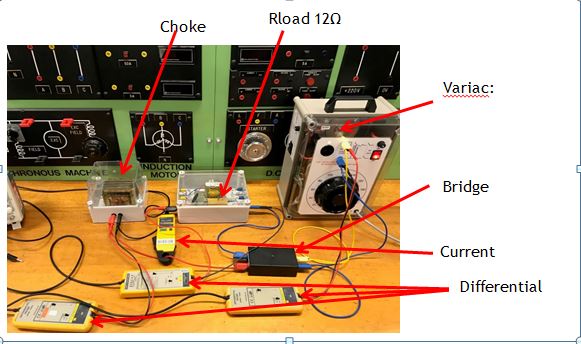
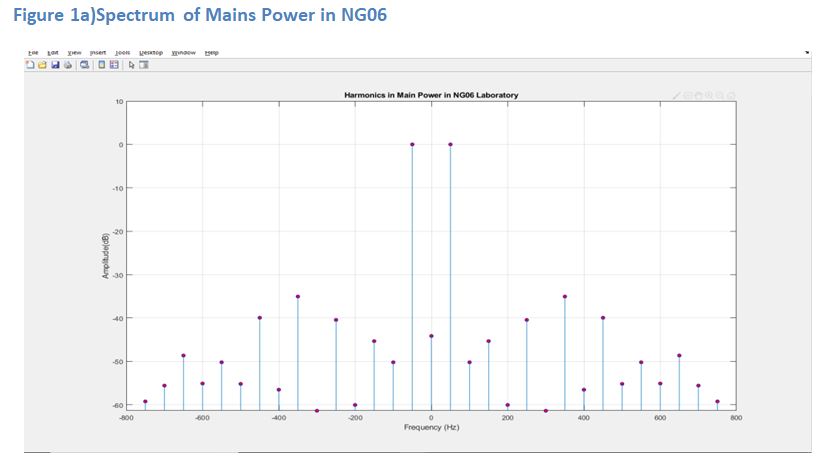
Experiment3 involved testing the proposed theory on a circuit with a non-sinusoidal periodic signal with a circuit containing a non-linear device. The non-sinusoidal periodic input signal is limited to sine wave with small amounts of harmonics. This is representative of real world conditions where mains power is sinusoidal with only a small number of harmonics of an amplitude approx-35dB down from the fundamental frequency of 50Hz. This is confirmed from testing of mains power at the university laboratory NG06 as seen in figure 4b. Therefore when analysing circuits containing non-linear devices, proposed theory can be limited to deal with only non-sinusoidal signals containing harmonics with amplitudes approx.. 35dB below the fundamental frequency i.e. 176% smaller than the fundamental.Figure4c shows setup of experiment3.
Conclusion
The following summaries the achievements of project:
Proposed Theory of using complex Fourier domain to perform circuit analysis on sinusoidal signals and linear circuit element works.
Proposed theory works with a non-sinusoidal periodic signals so long as all circuit elements are linear.
Proposed theory works with sinusoidal periodic signals with small distortions i.e. limited number of harmonics and small amplitude of said harmonics with non-linear circuit elements.
Future Work
Due to time constraints the H matrix of only 1 240 to25V transformer was determined, the H matrix of a diode (1N4148) was found through simulation i.e. injecting low level harmonics into diode model in MATLAB. The diodes actual H matrix should be found using the same technique as discussed for experiment3.Transfer matrices for other transformers could also be found and a circuit comprised of these elements could be devised to test proposed theory properly.
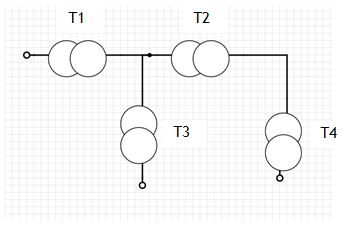
Using the H matrix found for the transformer and other devices a simulation of a small power network could be built up, as shown in figure5a. Using QLCT theory, the flow of harmonics around a typical power network could be found.
Knowing the flow of harmonics through a circuit such as the one shown in the above figure. Power from different harmonics could be shifted to other parts of the network,. With the knowledge of where specific harmonics were the largest, harmonic filters could be placed accurately and be used to reduce harmonics in one section of the network and the power from the removed harmonics could be added into another sections of the network. . Due to the number of tests required in building up the linear operator H i.e. for the transformer 27 tests were performer to get errors down. This procedure is cumbersome on a traditional oscilloscope and significant time. Automation of this procedure would be a significant step and would result in ease of procedure to obtain H matrices of various devices with relative ease, making proposed theory more useable and attractive to potential users. The modulator devised and built for experiment3 makes use of an zero-crossing detector and an Arduino to change the control signal Vc i.e into multiples of the fundamental frequency f, this means that a script could be written to change the frequency of the control signal and hence harmonic injected automatically over a range of cases, this combined with the use of a pico-scope which also can be loaded with python scripts to tell it to save X channels at Y times would result in automation of this procedures . This automation would not be significantly hard to achieve, as already mentioned due to the use of the Arduino to generate multiples of the fundamental frequency f. This would prove to be a great starting point for another project.
