Difference between revisions of "Projects:2015s1-58 Design And Development Of A New Respiratory Monitor For Detection Of Sleep Apnoea"
(→Detection based on Wavelet) |
(→Power Density) |
||
| (110 intermediate revisions by 2 users not shown) | |||
| Line 1: | Line 1: | ||
| − | == | + | == Project Team == |
| − | |||
| − | |||
| − | |||
| − | == | + | === Supervisor === |
Dr. Said Al-Sarawi | Dr. Said Al-Sarawi | ||
| + | === Co-supervisors === | ||
Prof. Jagan Mazumdar | Prof. Jagan Mazumdar | ||
Dr. Cleto Mernone | Dr. Cleto Mernone | ||
| − | + | === Students === | |
| − | == Students == | ||
Jian Shi | Jian Shi | ||
Sandeep Singh | Sandeep Singh | ||
| − | == Background Information == | + | == Acknowledgements == |
| − | Sleep apnea is a kind of sleep disorder that is characterized with suspension in breathing during sleep | + | First and foremost, we would like to express our sincere gratitude to our supervisor Dr. Said Al-Sarawi for his continuous assistance in the project, also for his patience, inspiration, enthusiasm and immense knowledge. |
| + | |||
| + | Secondly, we would like to thank our co-supervisors, Prof. Jagan Mazumdar and Dr. Cleto Mernone. The project could not be a success without their encouragement, insightful comments and helpful suggestions. | ||
| + | |||
| + | Our sincere thanks also goes to A/Prof. Baumert for providing the test data and valuable feedbacks. | ||
| + | |||
| + | == Introduction == | ||
| + | |||
| + | === Background Information=== | ||
| + | Sleep apnea is a kind of sleep disorder that is characterized with suspension in breathing during sleep. Each interruption, called as an apnea interval, can last from ten seconds to several minutes. | ||
Apneic events can be classified according to the nature of the underlying physiological cause. Central Sleep Apnea (CSA) is usually caused by the absence of correct signals from brain areas in charge of breathing to the relevant muscles and a normal breathing action cannot be implemented. Obstructive Sleep Apnea (OSA) is much likely to happen when the patient’s pharyngeal narrows or the upper airway collapses during sleep. The complex or mixed type of sleep apnea is a mix of CSA and OSA. | Apneic events can be classified according to the nature of the underlying physiological cause. Central Sleep Apnea (CSA) is usually caused by the absence of correct signals from brain areas in charge of breathing to the relevant muscles and a normal breathing action cannot be implemented. Obstructive Sleep Apnea (OSA) is much likely to happen when the patient’s pharyngeal narrows or the upper airway collapses during sleep. The complex or mixed type of sleep apnea is a mix of CSA and OSA. | ||
| − | The latest research result | + | The latest research result illustrates that obstructive sleep apnea is the most common type with a percentage. |
| − | + | The below figure is an illustration of the cause mechanism of OSA. | |
| − | == Motivation == | + | [[File:apnea.jpg|center]] [[File:proportion.png|thumb|Proportion of different types of sleep apnea]] |
| − | Regardless of type, an individual with sleep apnea suffers from difficulty of breathing during sleep, which leads to detrimental effects on sleep-quality and health. Some typical consequences of sleep apnea to the patient are as follows | + | |
| + | === Motivation === | ||
| + | Regardless of type, an individual with sleep apnea suffers from difficulty of breathing during sleep, which leads to detrimental effects on sleep-quality and health. | ||
| + | |||
| + | Some typical consequences of sleep apnea to the patient are as follows. | ||
• High blood pressure | • High blood pressure | ||
| Line 44: | Line 54: | ||
Fundamentally, the development of a sleep apnea monitor is extremely helpful to fill some gaps in the research of sleep apnea and make a contribution to the medical applications. | Fundamentally, the development of a sleep apnea monitor is extremely helpful to fill some gaps in the research of sleep apnea and make a contribution to the medical applications. | ||
| + | === Project Context === | ||
| + | |||
| + | The ultimate aim of this project is to develop a respiratory monitor prototype for detection of sleep apnea. | ||
| + | |||
| + | It is hoped that the prototype will eventually achieve the real-time monitoring of the patient’s sleep state and record the relevant information of sleep apnea events. | ||
| + | |||
| + | In this academic year, the work on detection algorithm has been accomplished and a design plan to construct a physical monitor has been established for the future groups. | ||
| + | |||
| + | === Project Objectives === | ||
| + | Actually, this project is an ongoing project and the group received the outcome from the previous Bachelor group at the beginning of this project. | ||
| + | |||
| + | Specifically, the previous group finished the detection and analysis work on one test case. However, with more cases tested by using their algorithm, we found that the feasibility and performance of their detection algorithm is not satisfying. | ||
| + | |||
| + | Therefore, more work on the improvement of the detection algorithm is required first and designing a monitor prototype is the second step. | ||
| + | |||
| + | Following is the three objectives of this project established. | ||
| + | |||
| + | -Fundamental – develop a reliable and accurate algorithm to detect the occurrence of sleep apnea | ||
| + | |||
| + | -Improvement – investigate the sleep apnea events and find out more information regarding sleep apnea | ||
| + | -Supplementary – put forward a design plan of a physical monitor prototype for implementation in the future | ||
== Data Acquisition == | == Data Acquisition == | ||
| − | The data for use in detection tests are provided by A/Prof Baumert under the assistance of the project supervisor, Dr. Said Al-Sarawi | + | === Data Format === |
| + | The data for use in detection tests are provided by A/Prof Baumert under the assistance of the project supervisor, Dr. Said Al-Sarawi. | ||
Those data files are stored in EDF and XML formats. | Those data files are stored in EDF and XML formats. | ||
• EDF file – contains an multi-channel overnight recording of sleep signals and labels of each acquisition channel with some available information , such as sampling frequency. | • EDF file – contains an multi-channel overnight recording of sleep signals and labels of each acquisition channel with some available information , such as sampling frequency. | ||
| + | |||
• XML file – contains the corresponding annotations of all the sleep events happening in the recording period and those annotations are used as reference while verifying if the detection statement is correct or not. | • XML file – contains the corresponding annotations of all the sleep events happening in the recording period and those annotations are used as reference while verifying if the detection statement is correct or not. | ||
| + | |||
| + | === EDF Viewer === | ||
The initial step to do analysis work is to observe the features of those provided signals. | The initial step to do analysis work is to observe the features of those provided signals. | ||
| − | A free EDF viewer (see | + | A free EDF viewer (see the figure below) from National Sleep Research Source is employed in this stage to combine the EDF files and XML files. The viewer enables the user to combine an EDF file with a corresponding sleep annotation file. The user has a myriad of ways to view the signals including scrolling, clicking on a specific annotation and determining the display channels of signal. |
| + | |||
| + | [[File:EDF viewer.jpg|1000px|center]] | ||
| + | |||
| + | In this project, the channel of airflow signal is selected to implement the signal processing work. | ||
| + | |||
| + | == Detection Method based on Wavelet Transform == | ||
| + | |||
| + | === CWT Analysis=== | ||
| + | |||
| + | The figure below shows the frequency distribution variation from normal breathing session to apnea session by implementing a CWT operation. | ||
| + | |||
| + | Obviously, there is a significant power variation where the bright color denotes a higher power level and the darker color denotes a lower power level. | ||
| + | A tendency of signal power from high frequency range to low frequency range has been discovered. | ||
| + | |||
| + | [[File:CWT result.png|1000px|center]] | ||
| + | |||
| + | === Power Density === | ||
| + | |||
| + | Based on the CWT analysis, the indication of power variation in higher frequency band is considered to be utilized as the indicator to detect the occurrence of sleep apnea. | ||
| + | |||
| + | The next step is to extract the desired frequency components and calculate their power level so as to find out the power variation ratio. | ||
| + | |||
| + | The procedure of obtaining the power density of the airflow signal can be illustrated by the following chart. | ||
| + | |||
| + | [[File:power density.png|600px|center]] | ||
| + | |||
| + | The below figure demonstrates the power reduction in apnea intervals. | ||
| + | |||
| + | [[File:power.png|800px|center]] | ||
| + | |||
| + | Based on over 200 tests on the power variation ratio of apnea events, 70% is selected as the threshold to determine an apnea event. | ||
| + | |||
| + | [[File:ratio.png|800px|center]] | ||
| + | |||
| + | === Duration Measurement === | ||
| + | |||
| + | The duration of apnea interval is the other parameter to assess the sleep apnea events. | ||
| + | |||
| + | With the assistance of duration measurement algorithm, some short-time sleep apnea events can be discarded and the detection accuracy can increase correspondingly. | ||
| + | |||
| + | The step-by-step illustration of measuring the sleep apnea interval is shown below. | ||
| + | |||
| + | [[File:Duration Measurement of SA.png|600px|center]] | ||
| + | |||
| + | |||
| + | Duration of apnea intervals is achieved by employing the reduction function. The reduction function will keep positive (above zero) in the apnea period and will become negative in normal respiration. | ||
| + | |||
| + | Two flags denoting the beginning and ending of the sleep apnea are captured in the intersection point with the reduction function curve with the horizontal axis. | ||
| + | |||
| + | Below figure is to demonstrate the result of obtaining the reduction function to measure the apnea duration. | ||
| + | |||
| + | [[File:duration_apneaw.png|800px|center]] | ||
| + | |||
| + | === Confidence Factor === | ||
| + | |||
| + | The previous chapters has explained the principle of how to identify the power reduction for apnea events and how to measure the duration of apnea intervals. | ||
| + | |||
| + | However, at this stage, the detection statement could not be 100% definitely correct. In other words, it is also possible to make some false detections. | ||
| + | |||
| + | Therefore, a novel parameter, defined as confidence factor, is put forward to evaluate each detection statement. | ||
| + | |||
| + | The determination of confidence factor is based on statistical analysis of 200 individual apnea events. | ||
| + | |||
| + | To be specific, in the project, 200 individual apnea cases have been analysed and their power variation from normal breathing to apnea period has been recorded. | ||
| + | |||
| + | The histogram of those 200 data is like the shape of normal distribution and the quantile plot is roughly like a straight line (see the figure below). | ||
| + | |||
| + | [[File:distribution.png|center]] | ||
| + | |||
| + | Therefore, a normal distribution model is suitable for the power ratio data space. | ||
| + | |||
| + | An example to calculate the confidence factor is shown below. | ||
| + | |||
| + | [[File:Confidence Factor.png|center]] | ||
| + | |||
| + | The participation of confidence factor can help us to evaluate the detection statements and discard those detection results with low confidence level (less than 70%). | ||
| + | |||
| + | The below figure demonstrates the positive detection results for one case and the corresponding confidence levels. | ||
| + | |||
| + | [[File:ConfidenceAll.png|center]] | ||
| + | |||
| + | === Overall Detection Mechanism=== | ||
| + | |||
| + | There are three criteria in the overall detection principle. | ||
| + | |||
| + | Primary criteria: power reduction ratio > 70% | ||
| + | |||
| + | Secondary criteria: measured duration > 10 seconds | ||
| − | + | Third criteria: confidence factor for this detection statement > 70% | |
| − | + | The overall detection principle is demonstrated in the following flow chart. | |
| − | + | [[File:overall detection.png|700px|center]] | |
| − | [[File: | + | == Detection Method based on HHT == |
| + | |||
| + | ===Hilbert Huang Transform based analysis === | ||
| + | |||
| + | Decompose low pass filtered signal using HHT into Intrinsic mode functions (IMFs).First 3-level IMF has chosen to identify Sleep Apnea, because they eliminate background variations in Signal, moreover contains higher modulations while detecting sleep apnea. | ||
| + | |||
| + | === Detection of sleep apnea=== | ||
| + | |||
| + | Analysis on first three IMFs used for processing show a distinctive feature to identify sleep apnea. There is Power increase up to 0.4 Hz in case of sleep apnea . | ||
| + | |||
| + | === Detection parameters=== | ||
| + | |||
| + | The special features from airflow signal can be utilized to differentiate sleep apnea episode and the normal breathing. So examining the data set it is interesting to know in case of sleep apnea ,there is power increase at low frequencies and it is also mentioned in literature [38]. In case of normal breathing the power level is distributed on wide range of frequencies but sleep apnea shows power increase in low frequency up to 0.4 Hz. | ||
| + | Hilbert-Huang transform is useful signal processing tool to examine non stationary signal, it can extract different intrinsic mode function related to signal and features at low frequency can be preserved, removing respiratory and other background variations introduced while recording. For this project ,first 3 IMFs has been used as these shows highest sensitivity to sleep apnea ,actually basis of sleep apnea detection. | ||
| + | |||
| + | |||
| + | The basic sleep apnea detection process consists few steps and each step discussed as follows: | ||
| + | |||
| + | The original signal is composed of various signals at various frequencies ,to de-noise the | ||
| + | signal For study ,low pass filter with the cut off frequency of 0.4 Hz has implemented to get | ||
| + | ride of higher frequency that might interfare with detection of sleep apnea . | ||
| + | The filtered signal is decomposed into IMFs in next stage of the algorithm. The first three | ||
| + | IMFs shows the highest sensitivity combined together to observe power increase at low frequency. | ||
| + | it is demonstrated in figure below ,a high power component in low frequency till 0.4 Hz. | ||
| + | |||
| + | |||
| + | Parameter 1-Power increase at low frequencies in case of Sleep Apnea is utilized as an indicator | ||
| + | - Primary apnea detection parameter | ||
| + | |||
| + | [[File:10sec.png|600px|center]][[File:Power increase.png|600px|center]] | ||
| + | |||
| + | Parameter 2-Duration measurement Algorithm detects time more Than 10 seconds | ||
| + | - Secondary parameter – improve accuracy | ||
| + | |||
| + | The motive of this algorithm is to find the time difference between two consecutive minima peak values. To combine with power increase method of apnea detection to reduce false positives.The steps of this algorithm are mentioned as follows: | ||
| + | • Peak finder algorithm finds minima peaks , minima threshold can be set to zero as it will serve the purpose to detect all the lower peaks and this threshold can be set to a specific value to make algorithm more selective in terms of detecting lower peaks(Minima) | ||
| + | |||
| + | [[File:duration10.png|600px|center]] | ||
| + | |||
| + | • Then it calculates the time difference between two consecutive peaks, if time difference is less than 10seconds it will consider this as non apnea but if the difference is more or equal to 10seconds it will consider it as an ‘Apnea’ | ||
| + | • Then, its result is compared with the other method, which uses power increase in apnea case ,if both the conditions from combined method are satisfied ,an apnea is declared | ||
| + | |||
| + | ===Combined method=== | ||
| + | A sleep apnea event lasts for more than 10 seconds. The duration measurement of sleep apnea is useful to improve accuracy of detection algorithm. The combination of HHT and apnea duration measurement produce better improvement in results. | ||
| + | |||
| + | |||
| + | Combination of these two parameters give an indication of Apnea | ||
| + | |||
| + | |||
| + | [[File:combinemethod.jpg|800px|center]] | ||
| + | |||
| + | Basically ,the flow chart shows two detection parameter | ||
| + | |||
| + | 1) power increase at low frequency(Primary detection parameter) | ||
| + | This parameter forms the basis for apnea detection . If condition of power boost in low frequency satisfies only then there is need to compare with duration parameter. Hence ,it is primary indication parameter for apnea detection | ||
| + | |||
| + | 2) Duration measurement(Secondary detection parameter) | ||
| + | The duration of apnea determined separately ,it is compared only ,if there is already potential apnea indication from the power increase parameter. So ,apnea duration measurement is secondary detection parameter in the combined algorithm. | ||
| + | |||
| + | |||
| + | |||
| + | All of these shows power increase for certain time ,more than 10 seconds ,within a certain power level through that time. Hence ,these events can be clearly observed in this time-frequency domains.So, power increase up to 0.4 Hz can be utilized as an apnea indicator. A certain power level is maintained while sleep apnea event ,which has potential to make threshold . A mean and standard deviation variation in certain range can be used to detect sleep apnea ,a variable range can accommodate any variations within 20 seconds window, for instance it can adjust the different time durations of sleep apnea events. | ||
| + | |||
| + | |||
| + | [[File:3min.png|600px|center]] | ||
== Result Analysis == | == Result Analysis == | ||
| + | After implementing massive tests on 100 different cases, the average detection accuracy of the method based on wavelet transform comes to around 85% and the sensitivity reaches up to 95%. | ||
| + | The method based on HHT produced an average of 70% accuracy, acheiving sensitivity up to 80%. | ||
| + | |||
| + | [[File:Apnea detection result.png|800px|center]] | ||
| + | |||
| + | From the above results demonstration, the score of sensitivity is the highlight which has exceeded that of the approaches in literatures. | ||
| + | |||
| + | However, the accuracy is a drawback of the method, where there is still a potential to be improved in the future. | ||
| + | |||
| + | The prime results evaluation parameters accuracy and sensitivity defines the feasibility | ||
| + | Of the detection method. There are some detection terminologies used in results as | ||
| + | Follows: | ||
| + | |||
| + | |||
| + | '''Standard Reference (SR)'''-it is total number of true apneas in signal, annotated by a professional with timing information | ||
| + | |||
| + | |||
| + | '''Total Detections (TD)''' - The total number of apnea detections by algorithm | ||
| + | |||
| + | |||
| + | '''True Positive (TP)''' - The correct number of apnea detection by algorithm. The correctness is determined comparing results with annotation data | ||
| + | |||
| + | |||
| + | '''False Positive (FP)''' - It is difference between TD and TP, means the apnea detection by algorithm which exactly is not real apnea case with reference of annotation file | ||
| + | |||
| + | '''True Negative (TN)''' – Apnea events missed by algorithm ,although being real apnea events. | ||
| + | |||
| + | Accuracy is defined as percentage of true positives detected by apnea detection method to standard reference | ||
| + | |||
| + | '''Accuracy''' =(True positive)/(Standard reference)×100% | ||
| + | |||
| + | |||
| + | Sensitivity is defined as percentage of true positives detected by apnea detection method to total detection by the algorithm | ||
| + | |||
| + | |||
| + | '''Sensitivity''' = (True positive)/(Total detections)×100% | ||
| + | |||
| + | The false positive detections can be blamed for other sleep events and the poor quality of some signals. | ||
| + | |||
| + | a. Some other sleep events, such as arousal or hypopnea, have the similar power charateristics to apnea events. | ||
| + | |||
| + | b. The poor quality of input signal will act as a significant interference for detection. | ||
== Design Plan == | == Design Plan == | ||
| + | The last objective of this project is to formulate a design plan of a monitor prototype to be used in the actual implementation by future groups. | ||
| + | |||
| + | The below diagram is an overview of the design plan. | ||
| + | |||
| + | [[File:Design Plan.png|900px|center]] | ||
| + | |||
| + | Functions of each component are listed below: | ||
| + | |||
| + | a. The combination of an airflow sensor and a mask is used as the signal acquisition device. The airflow from the patient will be accumulated by the medical mask mounted on the face of the patient. Subsequently, the airflow will pass through the tube and into the digital airflow sensor. The sensor is extremely sensitive to any variation of airflow and it could provide a digital output as well. | ||
| + | b. Considering that the interface of the airflow sensor is I^2 C, an adaptor is needed to achieve the interface transform from I^2 C to USB, which is compatible with the master PC. | ||
| + | c. Master PC is employed to control the operation of data acquisition device, process the input signals, visualize the collected signals, implement the apnea detection operation and store the measurement data into disk. | ||
| + | |||
| + | d. The software link is based on MATLAB and it could realize the data measurement connection between MATLAB and external hardware under the participation of the built-in Data Acquisition Toolbox. | ||
== Conclusion == | == Conclusion == | ||
| + | All things considered, the aims of the project have been accomplished successfully and a conclusion is required to be summarized at this stage. | ||
| + | The project focused on creating an effective algorithm for detection of sleep apnea and putting forward a draft design plan for use to construct a physical sleep monitor in the future. | ||
| + | The three objectives listed in sub-chapter 2.4 have been achieved and the present achievements are listed below. | ||
| + | |||
| + | • Sleep apnea occurrence detection: the algorithm is able to utilize the power indication to capture the power variation in high frequency band from normal respiration to apnea interval so as to detect the occurrence of sleep apnea event. | ||
| + | |||
| + | • Duration measurement for sleep apnea: a reduction function is employed to monitor the amplitude reduction of airflow signal through the comparison with a prior baseline established and the duration of apnea event can be measured by quantifying the positive interval length of the reduction function. | ||
| + | |||
| + | • Confidence factor evaluation: a statistical confidence level is established to evaluate each detection statement via calculating the derivation of the power ratio from the mean value of the normal distribution which is used to represent the power ratio reference for apnea events. | ||
| + | |||
| + | • Design plan of a monitor prototype: a preliminary design plan is put forward for the further integration of the algorithm with the data acquisition hardware. | ||
| + | |||
| + | == Future Work == | ||
| + | The ultimate target of the project is to produce a physical monitor prototype with practical diagnosis value for implementation of sleep apnea detection in medical institutions. | ||
| + | |||
| + | Due to the limitations of time and manpower, the group is not able to complete the work on both software programming and hardware construction. | ||
| + | |||
| + | There is potential that could be implemented by future project groups. These include: | ||
| + | |||
| + | • Algorithm improvement: | ||
| + | |||
| + | As mentioned in the introduction, sleep apnea is classified into three types according to different cause mechanism, but at this stage, the classification work has not been considered. It might be advantageous to assess the features of some other signal channels (i.e. ECG, SaO2 etc.) in apnea period to extract the indication used to classify sleep apnea events. | ||
| + | |||
| + | • Decline of the false positive rate: | ||
| + | |||
| + | The drawback of the presented detection algorithm is the presence of false positive detections, which has a adverse effect on the accuracy. There is a need to consider an approach to lower the false positive rate. This issue could be achieved by employing a new indicator to have a more strict restriction in detection. | ||
| + | |||
| + | • Software and hardware integration: | ||
| + | |||
| + | The next stage in the process would be to turn this detection algorithm into actual hardware and a physical monitor is expected to be constructed by future groups. Some issues worth mentioning include the sensor selection (i.e. specifications of the sensor, resolution, I/O voltage, sampling frequency etc.), interface where the program and hardware interact and budget control. | ||
== References == | == References == | ||
| + | [1] W. Roger & F. Henry, Sudden Infant Death Syndrome, 2001.
| ||
| + | |||
| + | [2] Varaday, Peter, et al. “A Novel Method for Detection of Apnea and Hypopnea Events in Respiration Signals”, IEEE Transactions on Biomedical Engineering 49.9 (2002): 936-42.
| ||
| + | |||
| + | [3] Z. Shinar et al. 2000 “Obstructive Sleep Apnea Detection Based on Electrocardiogram Analysis”, Computers in Cardiology, vol.27, pp. 757-760. | ||
| + | |||
| + | [4] J. Soler et al. 2003 “Spectral Envelope Analysis in Snoring Signals from Simple Snores and Patients with Obstructive Sleep Apnea”, Proceedings of the 25th Annual International Conferences of the IEEE EMBS, pp.17-21. | ||
| + | |||
| + | [5] SIDS and Kids. Fast Facts 2013. [online]. Available: http://www.sidsandkids.org/wpcontent/uploads/SIDS-7032-Fast-FactsLR5
| ||
| + | |||
| + | [6] A. Ajmani et al. 1996, “Spectral Analysis of an Acoustic Respiratory Signal with a View to Developing an Apnoea Monitor”, Australian Physical & Engineering Sciences in Medicine, vol.19, no.2, pp. 1-7.
| ||
| + | |||
| + | [7] S. Hill et al. 2010, “Acoustic Sleep Apnea Detector”, Department of Anesthesiology, Vanderbilt University Medical Center
| ||
| + | |||
| + | [8] HANS PASTERKAMP, S. KRAMAN STEVE, and R. WODICKA GEORGE "Respiratory Sounds",American Journal of Respiratory and Critical Care Medicine, Vol.156, No. 3 (1997) | ||
| + | |||
| + |
[9] A.Ajmani , J Mazumdar ,D.Jarvis,”Spectral analysis of an acoustic respiratory system with a view to developing a sleep apnoea monitor”,Australian physical and engineering science in medicine(1996)vol.19 no.2
| ||
| + | |||
| + | [10] Varaday, Peter, et al. "A Novel Method for the Detection of Apnea and Hypopnea Events in
Respiration Signals." IEEE Transactions on Biomedical Engineering 49.9 (2002): 936-42.
| ||
| + | |||
| + | [11] Cafer Avcı1, İbrahim Delibaşoğlu2, Ahmet Akbaş3 ,”Sleep Apnea Detection Using Wavelet Analysis of ECG Derived Respiratory Signal” 2012 International Conference on Biomedical Engineering (ICoBE),27-28 February 2012,Penang. | ||
| + | |||
| + | [12] Qiang Zhu, Yansong Wang and Gongqi Shen,”Research and Comparison of Time-frequency Techniques for Nonstationary Signals”, JOURNAL OF COMPUTERS, VOL. 7, NO. 4, APRIL 2012 | ||
| + | |||
| + |
[13] T. Penzel1 J. McNames2 P. de Chazal3 B. Raymond4A. Murray, Moody6,”Systematic comparison of differentalgorithms for apnoea detection basedon electrocardiogram recordings”, Med. Biol. Eng. Comput., 2002, 40, 402–407 [14] S. Mallat, “A Theory for Multi-Resolution Signal Decomposition Wavelet Representation,” IEEE Trans. On Pattern Analysis and Machine Intell. 11(7), 674-693, 1989. | ||
| + | |||
| + | [15] N.Padmaja1 Dr.S.Varadarajan2 R.Swathi,”SIGNAL PROCESSING OF RADARECHOESUSING WAVELETS ANDHILBERT HUANG TRANSFORM” Signal & Image Processing : An International Journal (SIPIJ) Vol.2, No.3, September 2011
| ||
| + | |||
| + | [16] Z.K. Peng, Peter W. Tseb, F.L. Chu. “An improved Hilbert–Huang transform and its application in Vibration signal analysis”. Journal of Sound and Vibration 286 (2005) 187–205 | ||
| + | |||
| + | [17] Yuan Li. ”Wavelet Analysis for Change Points and Nonlinear Wavelet Estimates in Time Series.” Beijing: China Statistics Press, 2001.
[18] Narcolepsy and Overwhelming Daytime Sleep Society of Australia. Sleep Apnea. [online]. Available: http://www.nodss.org.au/sleep_apnoeas.html | ||
| + | |||
| + | [19] S.L. Chuah, “SIDS Monitoring Device”, Rep, 2004.
| ||
| + | |||
| + | [20] Sleep Health Foundation, “Re-awakening Australia: the economic cost of sleep disorders in Australia, 2010”, Deloitte Access Economics Pty Ltd, UK, Rep, 2011.
| ||
| + | |||
| + | [21] Andrew K. Ng et al. “Bispectral Analysis of Snore Signals for Obstructive Sleep Apnea Detection”, Proceeding of the 29th Annual International Conference of the IEEE EMBS, August 23-26, 2007. | ||
| + | |||
| + | [22] Findley LJ, Wilhoit SC, Suratt PM.” Apnea duration and hypoxemia during REM sleep in patients with obstructive sleep apnea”, Chest. 1985 Apr;87(4):432-6. | ||
| + | |||
| + | [23] Peretz Lavie, professor,Paula Herer, statisticiaaVictor Hoffstein, professor of medicine. ”Obstructive sleep apnoea syndrome as a risk factor for hypertension: population study”,BMJ 2000;320:479 | ||
| + | |||
| + | [24] P. Caseiroa, R. Fonseca-Pintoa, A. Andradea,” Screening of obstructive sleep apnea using Hilbert–Huang decomposition of oronasal airway pressure recordings”, Medical Engineering & Physics 32561–568 | ||
| + | |||
| + | [25] John I. Salisbury a,, Ying Sun b,” Rapid screening test for sleep apnea using a nonlinear and nonstationary signal processing technique”, Medical Engineering & Physics 29 (2007) 336–343 | ||
| + | |||
| + | [26] D. Liu, Z. Pang, and S. Lloyd, “A Neural Network Method for Detection of Obstructive Sleep Apnea EEG,” in IEEE Transactions on Neural Networks., vol. 19, no. 2,pp.308–318, 2008. | ||
| + | |||
| + | [27] R. Lin, R. Lee, C. Tseng, H. Zhou, C. Chao, and J. Jiang, “A New Approach for Identifying Sleep Apnea Transform and Neural Networks,” Biomedical Engineering:Applications, Basis & Communications., vol.143,2006 | ||
| + | |||
| + | [28] Huang NE, Shen Z, Long SR, Wu MC, Shih HH, Zheng A, et al. “The empirical mode decomposition and and non-stationary time series analysis”. Proc Roy Soc London Ser A1998;454:903–95. | ||
| + | |||
| + | [29] Huang NE, Shen Z, Long SR. A new view of nonlinear water waves:the Hilbert spectrum. Ann Rev | ||
| + | |||
| + | [30] P. DUHAMEL,M. VETTERLI.” FAST FOURIER TRANSFORMS: A TUTORIAL REVIEW ANDA STATE OF THE ART”. | ||
| + | |||
| + | [31] Yufeng Zhang ab,∗, Zhenyu Guo a, Weilian Wang ab, Side He ab, Ting Lee a,Murray Loew a.” A comparison of the wavelet and short-time fourier transforms for Doppler spectral analysis”. Medical Engineering & Physics 25 (2003) 547–557 | ||
| + | |||
| + | [32] Semion Kizhner, Thomas P. Flatley, Dr. Norden E. Huangl Karin Blank, Evette Conwell.” On the Hilbert-Huang Transform Data Processing System Development”2. 2004 IEEE Aerospace Conference | ||
| + | |||
| + | [33] P. Caseiroa,b,∗, R. Fonseca-Pintoa,c, A. Andradea.’”Screening of obstructive sleep apnea using Hilbert–Huang decomposition of oronasal airway pressure recordings”. Medical Engineering & Physics | ||
| + | |||
| + | [34] B. Lind, J. Goodwin, J. Hill, T. Ali, S. Redline, and S. Quan, “Recruitment of healthy adults into a study in the home: experience of the sleep heart health study,” Sleep Breath, vol. 7, no. 1, pp. 13–24, 2003 | ||
| + | |||
| + | [35]EDF viewer [online].Available https://sleepdata.org/ | ||
| + | |||
| + | [36] EDF viewer [online].Available https://sleepdata.org/tools/edf-viewer | ||
| + | |||
| + | [37] Huang N, Shen S. Hilbert–Huang transform and its applications. World Scientific Publishing Co; 2005. | ||
| + | |||
| + | [38] Nandakumar Selvaraj_ and Ravi Narasimhan. Detection of Sleep Apnea on a Per-Second Basis Using Respiratory Signals, 35th Annual International Conference of the IEEE EMBS | ||
| + | Osaka, Japan, 3 - 7 July, 2013 | ||
| + | |||
| + | [39] Philip de Chazal*, Conor Heneghan, , Elaine Sheridan, Richard Reilly, Member, IEEE,Philip Nolan, and Mark O’Malley. Automated Processing of the Single-Lead | ||
| + | “Electrocardiogram for the Detection of Obstructive Sleep Apnoea, IEEE TRANSACTIONS ON BIOMEDICAL ENGINEERING”, VOL. 50, NO. 6, JUNE 2003 | ||
| + | |||
| + | [40] HANS PASTERKAMP, S. KRAMAN STEVE, and R. WODICKA GEORGE "Respiratory Sounds, " American Journal of Respiratory and Critical Care Medicine, Vol. 156, No. 3 (1997) | ||
| + | |||
| + | [41] A.Ajmani, J Mazumdar, D.Jarvis,”Spectral analysis of an acoustic respiratory system with a view to developing a sleep apnoea monitor”,Australian physical and engineering science in medicine,vol.19 no.2 , 1996 | ||
| + | |||
| + | [42] Thinklabs Stethoscope Software ,[Online] ,Available:http://www.thinklabs.com/ | ||
Latest revision as of 10:09, 23 October 2015
Contents
Project Team
Supervisor
Dr. Said Al-Sarawi
Co-supervisors
Prof. Jagan Mazumdar
Dr. Cleto Mernone
Students
Jian Shi
Sandeep Singh
Acknowledgements
First and foremost, we would like to express our sincere gratitude to our supervisor Dr. Said Al-Sarawi for his continuous assistance in the project, also for his patience, inspiration, enthusiasm and immense knowledge.
Secondly, we would like to thank our co-supervisors, Prof. Jagan Mazumdar and Dr. Cleto Mernone. The project could not be a success without their encouragement, insightful comments and helpful suggestions.
Our sincere thanks also goes to A/Prof. Baumert for providing the test data and valuable feedbacks.
Introduction
Background Information
Sleep apnea is a kind of sleep disorder that is characterized with suspension in breathing during sleep. Each interruption, called as an apnea interval, can last from ten seconds to several minutes.
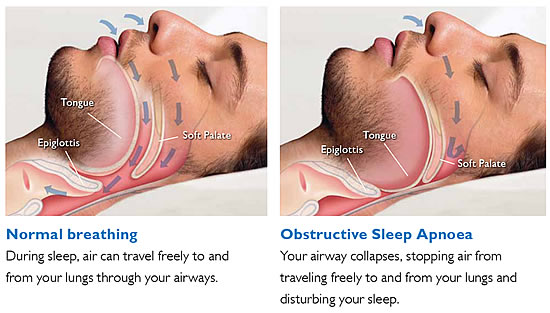
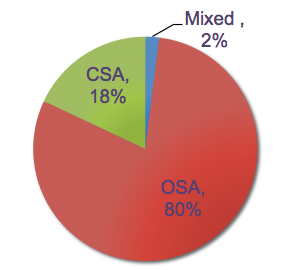
Apneic events can be classified according to the nature of the underlying physiological cause. Central Sleep Apnea (CSA) is usually caused by the absence of correct signals from brain areas in charge of breathing to the relevant muscles and a normal breathing action cannot be implemented. Obstructive Sleep Apnea (OSA) is much likely to happen when the patient’s pharyngeal narrows or the upper airway collapses during sleep. The complex or mixed type of sleep apnea is a mix of CSA and OSA.
The latest research result illustrates that obstructive sleep apnea is the most common type with a percentage.
The below figure is an illustration of the cause mechanism of OSA.
Motivation
Regardless of type, an individual with sleep apnea suffers from difficulty of breathing during sleep, which leads to detrimental effects on sleep-quality and health.
Some typical consequences of sleep apnea to the patient are as follows.
• High blood pressure
• Stroke
• Heart failure, heart attack or irregular heart beats
• Depression and lack of concentration in daytime
It is quite difficult to exactly specify how many Australians suffer from sleep apnea. It is generally thought that approximately 9% of women and 25% of men in Australia have clinically significant sleep apnea and 4% of men and women have symptomatic sleep apnea [5].
Due to the serious effects of sleep apnea and the enormous quantity of patients, the medical and health professions have been seeking for reliable sleep apnea detection and therapy approach in recent decades.
Fundamentally, the development of a sleep apnea monitor is extremely helpful to fill some gaps in the research of sleep apnea and make a contribution to the medical applications.
Project Context
The ultimate aim of this project is to develop a respiratory monitor prototype for detection of sleep apnea.
It is hoped that the prototype will eventually achieve the real-time monitoring of the patient’s sleep state and record the relevant information of sleep apnea events.
In this academic year, the work on detection algorithm has been accomplished and a design plan to construct a physical monitor has been established for the future groups.
Project Objectives
Actually, this project is an ongoing project and the group received the outcome from the previous Bachelor group at the beginning of this project.
Specifically, the previous group finished the detection and analysis work on one test case. However, with more cases tested by using their algorithm, we found that the feasibility and performance of their detection algorithm is not satisfying.
Therefore, more work on the improvement of the detection algorithm is required first and designing a monitor prototype is the second step.
Following is the three objectives of this project established.
-Fundamental – develop a reliable and accurate algorithm to detect the occurrence of sleep apnea
-Improvement – investigate the sleep apnea events and find out more information regarding sleep apnea
-Supplementary – put forward a design plan of a physical monitor prototype for implementation in the future
Data Acquisition
Data Format
The data for use in detection tests are provided by A/Prof Baumert under the assistance of the project supervisor, Dr. Said Al-Sarawi.
Those data files are stored in EDF and XML formats.
• EDF file – contains an multi-channel overnight recording of sleep signals and labels of each acquisition channel with some available information , such as sampling frequency.
• XML file – contains the corresponding annotations of all the sleep events happening in the recording period and those annotations are used as reference while verifying if the detection statement is correct or not.
EDF Viewer
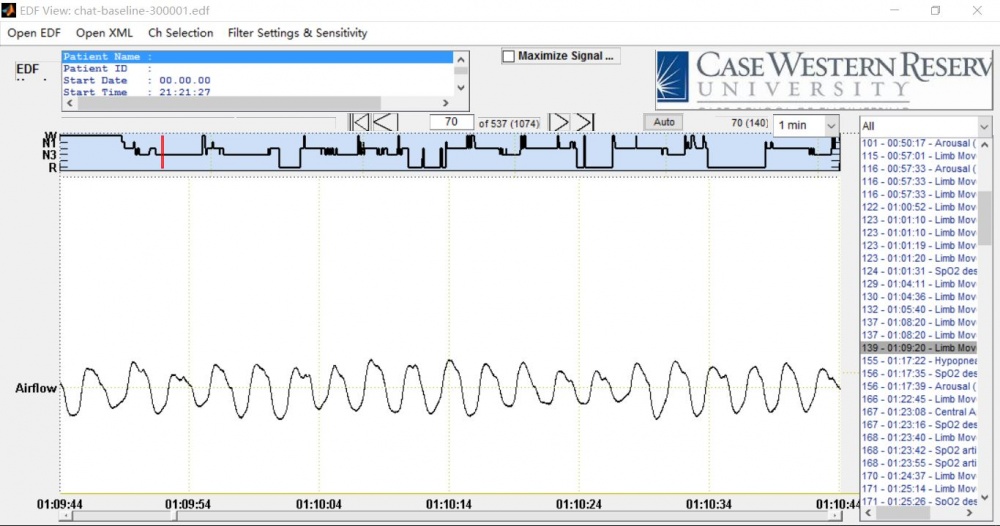
The initial step to do analysis work is to observe the features of those provided signals.
A free EDF viewer (see the figure below) from National Sleep Research Source is employed in this stage to combine the EDF files and XML files. The viewer enables the user to combine an EDF file with a corresponding sleep annotation file. The user has a myriad of ways to view the signals including scrolling, clicking on a specific annotation and determining the display channels of signal.
In this project, the channel of airflow signal is selected to implement the signal processing work.
Detection Method based on Wavelet Transform
CWT Analysis
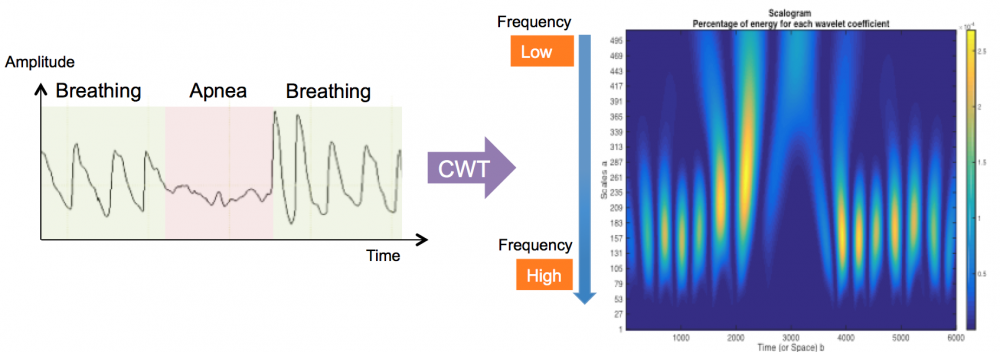
The figure below shows the frequency distribution variation from normal breathing session to apnea session by implementing a CWT operation.
Obviously, there is a significant power variation where the bright color denotes a higher power level and the darker color denotes a lower power level. A tendency of signal power from high frequency range to low frequency range has been discovered.
Power Density
Based on the CWT analysis, the indication of power variation in higher frequency band is considered to be utilized as the indicator to detect the occurrence of sleep apnea.
The next step is to extract the desired frequency components and calculate their power level so as to find out the power variation ratio.
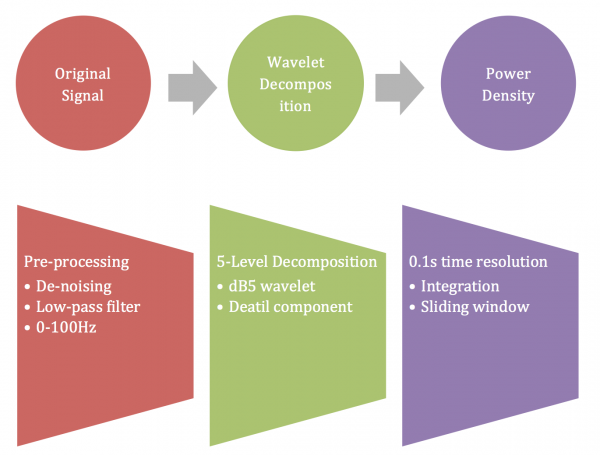
The procedure of obtaining the power density of the airflow signal can be illustrated by the following chart.
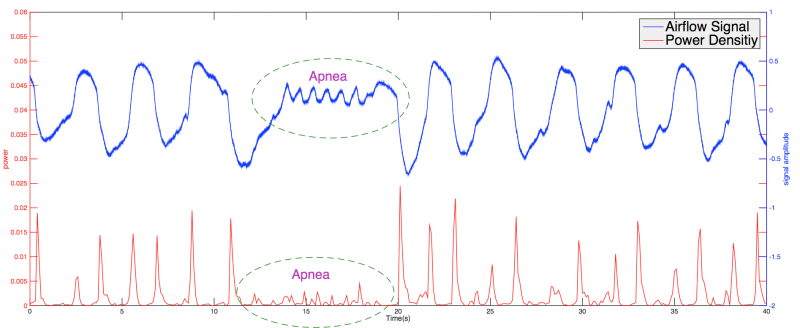
The below figure demonstrates the power reduction in apnea intervals.
Based on over 200 tests on the power variation ratio of apnea events, 70% is selected as the threshold to determine an apnea event.
Duration Measurement
The duration of apnea interval is the other parameter to assess the sleep apnea events.
With the assistance of duration measurement algorithm, some short-time sleep apnea events can be discarded and the detection accuracy can increase correspondingly.
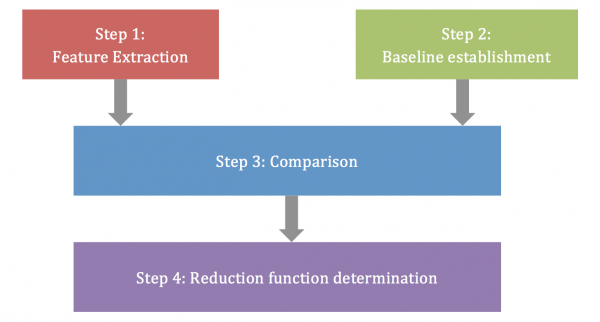
The step-by-step illustration of measuring the sleep apnea interval is shown below.
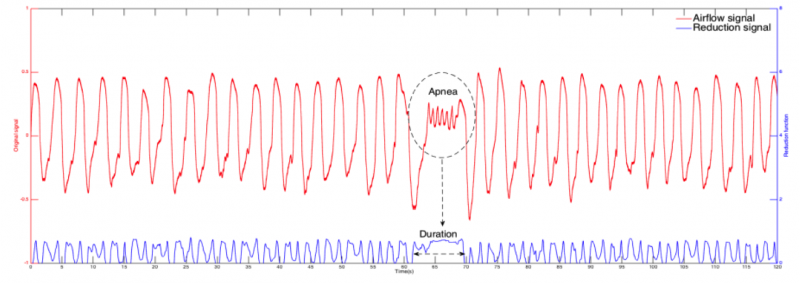
Duration of apnea intervals is achieved by employing the reduction function. The reduction function will keep positive (above zero) in the apnea period and will become negative in normal respiration.
Two flags denoting the beginning and ending of the sleep apnea are captured in the intersection point with the reduction function curve with the horizontal axis.
Below figure is to demonstrate the result of obtaining the reduction function to measure the apnea duration.
Confidence Factor
The previous chapters has explained the principle of how to identify the power reduction for apnea events and how to measure the duration of apnea intervals.
However, at this stage, the detection statement could not be 100% definitely correct. In other words, it is also possible to make some false detections.
Therefore, a novel parameter, defined as confidence factor, is put forward to evaluate each detection statement.
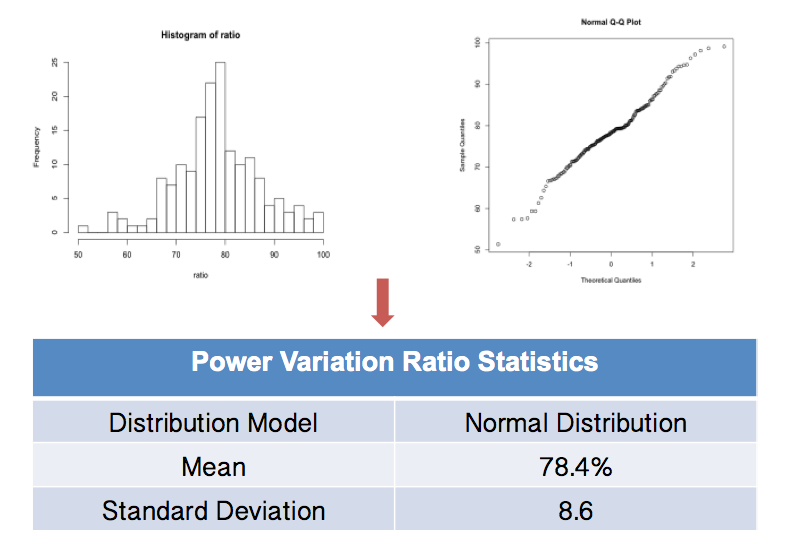
The determination of confidence factor is based on statistical analysis of 200 individual apnea events.
To be specific, in the project, 200 individual apnea cases have been analysed and their power variation from normal breathing to apnea period has been recorded.
The histogram of those 200 data is like the shape of normal distribution and the quantile plot is roughly like a straight line (see the figure below).
Therefore, a normal distribution model is suitable for the power ratio data space.
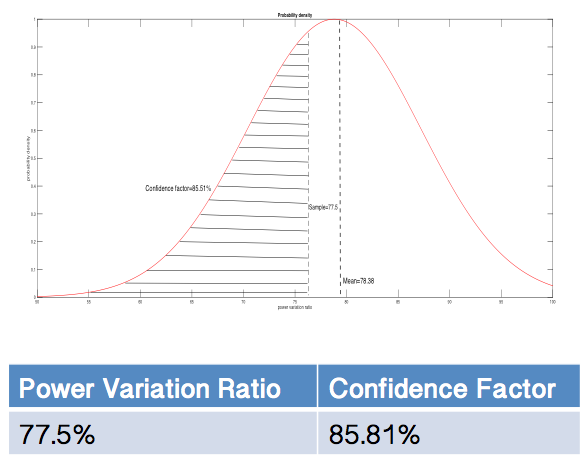
An example to calculate the confidence factor is shown below.
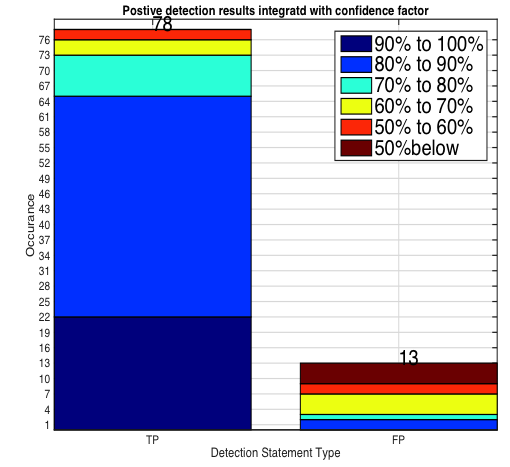
The participation of confidence factor can help us to evaluate the detection statements and discard those detection results with low confidence level (less than 70%).
The below figure demonstrates the positive detection results for one case and the corresponding confidence levels.
Overall Detection Mechanism
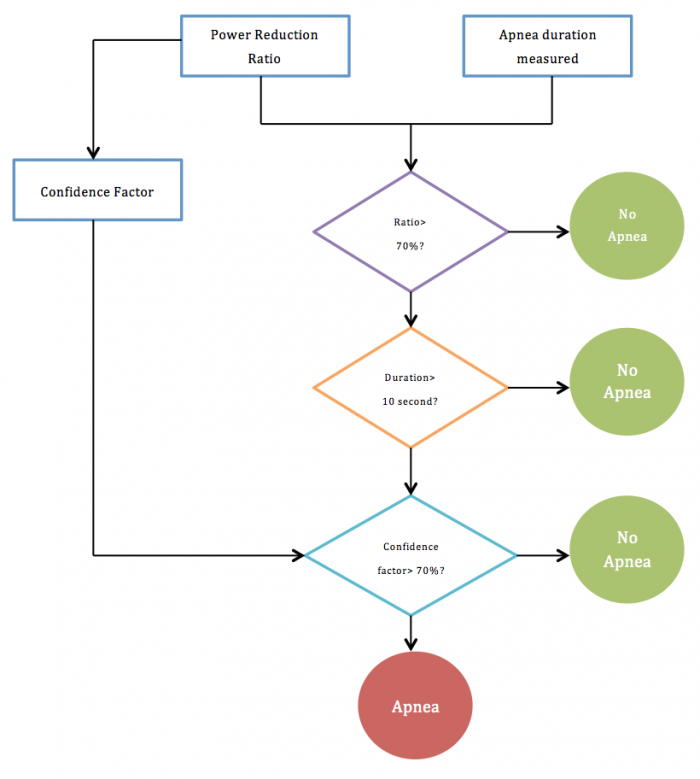
There are three criteria in the overall detection principle.
Primary criteria: power reduction ratio > 70%
Secondary criteria: measured duration > 10 seconds
Third criteria: confidence factor for this detection statement > 70%
The overall detection principle is demonstrated in the following flow chart.
Detection Method based on HHT
Hilbert Huang Transform based analysis
Decompose low pass filtered signal using HHT into Intrinsic mode functions (IMFs).First 3-level IMF has chosen to identify Sleep Apnea, because they eliminate background variations in Signal, moreover contains higher modulations while detecting sleep apnea.
Detection of sleep apnea
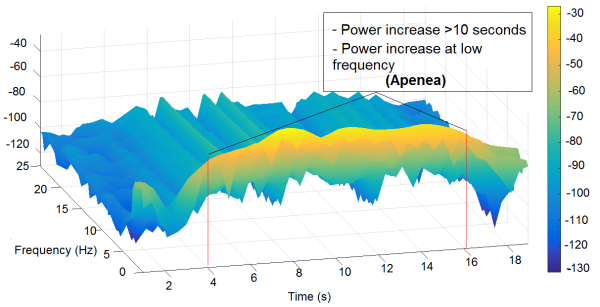
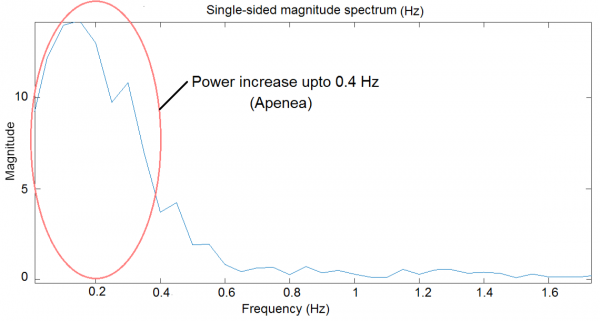
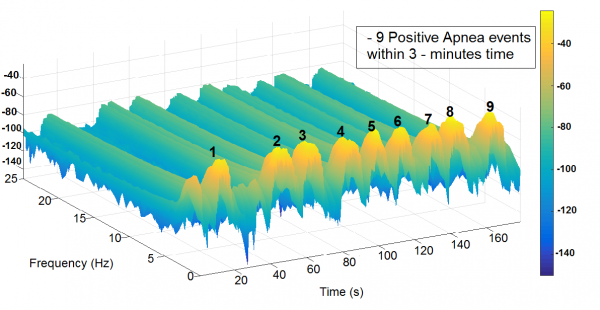
Analysis on first three IMFs used for processing show a distinctive feature to identify sleep apnea. There is Power increase up to 0.4 Hz in case of sleep apnea .
Detection parameters
The special features from airflow signal can be utilized to differentiate sleep apnea episode and the normal breathing. So examining the data set it is interesting to know in case of sleep apnea ,there is power increase at low frequencies and it is also mentioned in literature [38]. In case of normal breathing the power level is distributed on wide range of frequencies but sleep apnea shows power increase in low frequency up to 0.4 Hz. Hilbert-Huang transform is useful signal processing tool to examine non stationary signal, it can extract different intrinsic mode function related to signal and features at low frequency can be preserved, removing respiratory and other background variations introduced while recording. For this project ,first 3 IMFs has been used as these shows highest sensitivity to sleep apnea ,actually basis of sleep apnea detection.
The basic sleep apnea detection process consists few steps and each step discussed as follows:
The original signal is composed of various signals at various frequencies ,to de-noise the signal For study ,low pass filter with the cut off frequency of 0.4 Hz has implemented to get ride of higher frequency that might interfare with detection of sleep apnea .
The filtered signal is decomposed into IMFs in next stage of the algorithm. The first three
IMFs shows the highest sensitivity combined together to observe power increase at low frequency.
it is demonstrated in figure below ,a high power component in low frequency till 0.4 Hz.
Parameter 1-Power increase at low frequencies in case of Sleep Apnea is utilized as an indicator
- Primary apnea detection parameter
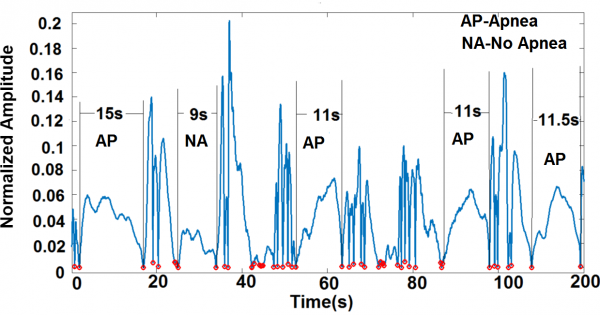
Parameter 2-Duration measurement Algorithm detects time more Than 10 seconds
- Secondary parameter – improve accuracy
The motive of this algorithm is to find the time difference between two consecutive minima peak values. To combine with power increase method of apnea detection to reduce false positives.The steps of this algorithm are mentioned as follows: • Peak finder algorithm finds minima peaks , minima threshold can be set to zero as it will serve the purpose to detect all the lower peaks and this threshold can be set to a specific value to make algorithm more selective in terms of detecting lower peaks(Minima)
• Then it calculates the time difference between two consecutive peaks, if time difference is less than 10seconds it will consider this as non apnea but if the difference is more or equal to 10seconds it will consider it as an ‘Apnea’ • Then, its result is compared with the other method, which uses power increase in apnea case ,if both the conditions from combined method are satisfied ,an apnea is declared
Combined method
A sleep apnea event lasts for more than 10 seconds. The duration measurement of sleep apnea is useful to improve accuracy of detection algorithm. The combination of HHT and apnea duration measurement produce better improvement in results.
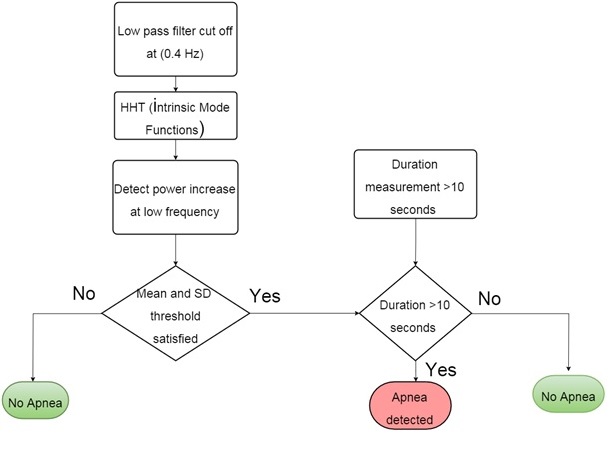
Combination of these two parameters give an indication of Apnea
Basically ,the flow chart shows two detection parameter
1) power increase at low frequency(Primary detection parameter) This parameter forms the basis for apnea detection . If condition of power boost in low frequency satisfies only then there is need to compare with duration parameter. Hence ,it is primary indication parameter for apnea detection
2) Duration measurement(Secondary detection parameter) The duration of apnea determined separately ,it is compared only ,if there is already potential apnea indication from the power increase parameter. So ,apnea duration measurement is secondary detection parameter in the combined algorithm.
All of these shows power increase for certain time ,more than 10 seconds ,within a certain power level through that time. Hence ,these events can be clearly observed in this time-frequency domains.So, power increase up to 0.4 Hz can be utilized as an apnea indicator. A certain power level is maintained while sleep apnea event ,which has potential to make threshold . A mean and standard deviation variation in certain range can be used to detect sleep apnea ,a variable range can accommodate any variations within 20 seconds window, for instance it can adjust the different time durations of sleep apnea events.
Result Analysis
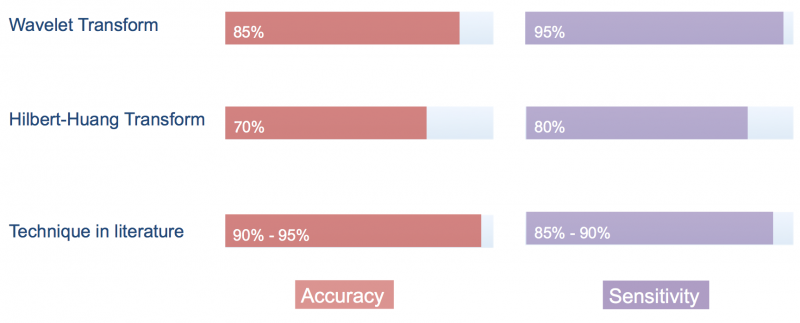
After implementing massive tests on 100 different cases, the average detection accuracy of the method based on wavelet transform comes to around 85% and the sensitivity reaches up to 95%. The method based on HHT produced an average of 70% accuracy, acheiving sensitivity up to 80%.
From the above results demonstration, the score of sensitivity is the highlight which has exceeded that of the approaches in literatures.
However, the accuracy is a drawback of the method, where there is still a potential to be improved in the future.
The prime results evaluation parameters accuracy and sensitivity defines the feasibility Of the detection method. There are some detection terminologies used in results as Follows:
Standard Reference (SR)-it is total number of true apneas in signal, annotated by a professional with timing information
Total Detections (TD) - The total number of apnea detections by algorithm
True Positive (TP) - The correct number of apnea detection by algorithm. The correctness is determined comparing results with annotation data
False Positive (FP) - It is difference between TD and TP, means the apnea detection by algorithm which exactly is not real apnea case with reference of annotation file
True Negative (TN) – Apnea events missed by algorithm ,although being real apnea events.
Accuracy is defined as percentage of true positives detected by apnea detection method to standard reference
Accuracy =(True positive)/(Standard reference)×100%
Sensitivity is defined as percentage of true positives detected by apnea detection method to total detection by the algorithm
Sensitivity = (True positive)/(Total detections)×100%
The false positive detections can be blamed for other sleep events and the poor quality of some signals.
a. Some other sleep events, such as arousal or hypopnea, have the similar power charateristics to apnea events.
b. The poor quality of input signal will act as a significant interference for detection.
Design Plan
The last objective of this project is to formulate a design plan of a monitor prototype to be used in the actual implementation by future groups.
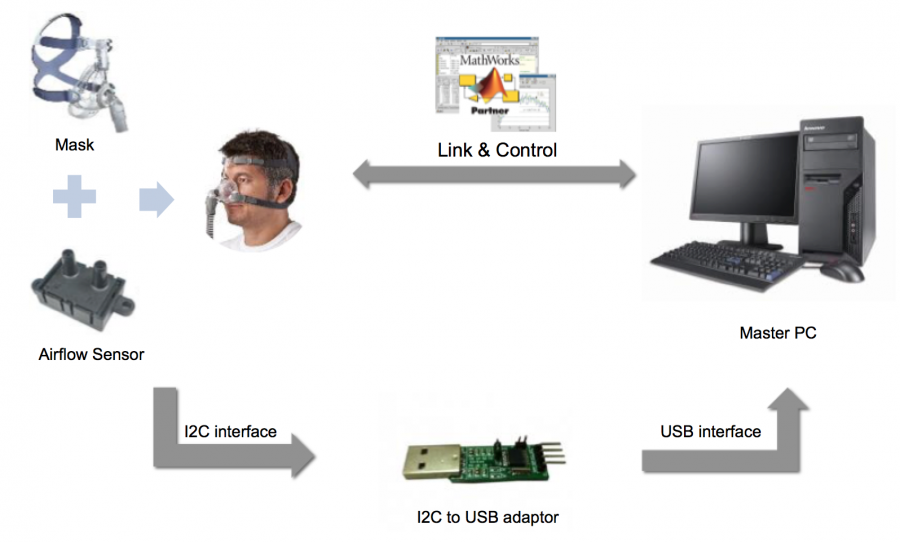
The below diagram is an overview of the design plan.
Functions of each component are listed below:
a. The combination of an airflow sensor and a mask is used as the signal acquisition device. The airflow from the patient will be accumulated by the medical mask mounted on the face of the patient. Subsequently, the airflow will pass through the tube and into the digital airflow sensor. The sensor is extremely sensitive to any variation of airflow and it could provide a digital output as well.
b. Considering that the interface of the airflow sensor is I^2 C, an adaptor is needed to achieve the interface transform from I^2 C to USB, which is compatible with the master PC.
c. Master PC is employed to control the operation of data acquisition device, process the input signals, visualize the collected signals, implement the apnea detection operation and store the measurement data into disk.
d. The software link is based on MATLAB and it could realize the data measurement connection between MATLAB and external hardware under the participation of the built-in Data Acquisition Toolbox.
Conclusion
All things considered, the aims of the project have been accomplished successfully and a conclusion is required to be summarized at this stage.
The project focused on creating an effective algorithm for detection of sleep apnea and putting forward a draft design plan for use to construct a physical sleep monitor in the future.
The three objectives listed in sub-chapter 2.4 have been achieved and the present achievements are listed below.
• Sleep apnea occurrence detection: the algorithm is able to utilize the power indication to capture the power variation in high frequency band from normal respiration to apnea interval so as to detect the occurrence of sleep apnea event.
• Duration measurement for sleep apnea: a reduction function is employed to monitor the amplitude reduction of airflow signal through the comparison with a prior baseline established and the duration of apnea event can be measured by quantifying the positive interval length of the reduction function.
• Confidence factor evaluation: a statistical confidence level is established to evaluate each detection statement via calculating the derivation of the power ratio from the mean value of the normal distribution which is used to represent the power ratio reference for apnea events.
• Design plan of a monitor prototype: a preliminary design plan is put forward for the further integration of the algorithm with the data acquisition hardware.
Future Work
The ultimate target of the project is to produce a physical monitor prototype with practical diagnosis value for implementation of sleep apnea detection in medical institutions.
Due to the limitations of time and manpower, the group is not able to complete the work on both software programming and hardware construction.
There is potential that could be implemented by future project groups. These include:
• Algorithm improvement:
As mentioned in the introduction, sleep apnea is classified into three types according to different cause mechanism, but at this stage, the classification work has not been considered. It might be advantageous to assess the features of some other signal channels (i.e. ECG, SaO2 etc.) in apnea period to extract the indication used to classify sleep apnea events.
• Decline of the false positive rate:
The drawback of the presented detection algorithm is the presence of false positive detections, which has a adverse effect on the accuracy. There is a need to consider an approach to lower the false positive rate. This issue could be achieved by employing a new indicator to have a more strict restriction in detection.
• Software and hardware integration:
The next stage in the process would be to turn this detection algorithm into actual hardware and a physical monitor is expected to be constructed by future groups. Some issues worth mentioning include the sensor selection (i.e. specifications of the sensor, resolution, I/O voltage, sampling frequency etc.), interface where the program and hardware interact and budget control.
References
[1] W. Roger & F. Henry, Sudden Infant Death Syndrome, 2001.
[2] Varaday, Peter, et al. “A Novel Method for Detection of Apnea and Hypopnea Events in Respiration Signals”, IEEE Transactions on Biomedical Engineering 49.9 (2002): 936-42.
[3] Z. Shinar et al. 2000 “Obstructive Sleep Apnea Detection Based on Electrocardiogram Analysis”, Computers in Cardiology, vol.27, pp. 757-760.
[4] J. Soler et al. 2003 “Spectral Envelope Analysis in Snoring Signals from Simple Snores and Patients with Obstructive Sleep Apnea”, Proceedings of the 25th Annual International Conferences of the IEEE EMBS, pp.17-21.
[5] SIDS and Kids. Fast Facts 2013. [online]. Available: http://www.sidsandkids.org/wpcontent/uploads/SIDS-7032-Fast-FactsLR5
[6] A. Ajmani et al. 1996, “Spectral Analysis of an Acoustic Respiratory Signal with a View to Developing an Apnoea Monitor”, Australian Physical & Engineering Sciences in Medicine, vol.19, no.2, pp. 1-7.
[7] S. Hill et al. 2010, “Acoustic Sleep Apnea Detector”, Department of Anesthesiology, Vanderbilt University Medical Center
[8] HANS PASTERKAMP, S. KRAMAN STEVE, and R. WODICKA GEORGE "Respiratory Sounds",American Journal of Respiratory and Critical Care Medicine, Vol.156, No. 3 (1997)
[9] A.Ajmani , J Mazumdar ,D.Jarvis,”Spectral analysis of an acoustic respiratory system with a view to developing a sleep apnoea monitor”,Australian physical and engineering science in medicine(1996)vol.19 no.2
[10] Varaday, Peter, et al. "A Novel Method for the Detection of Apnea and Hypopnea Events in Respiration Signals." IEEE Transactions on Biomedical Engineering 49.9 (2002): 936-42.
[11] Cafer Avcı1, İbrahim Delibaşoğlu2, Ahmet Akbaş3 ,”Sleep Apnea Detection Using Wavelet Analysis of ECG Derived Respiratory Signal” 2012 International Conference on Biomedical Engineering (ICoBE),27-28 February 2012,Penang.
[12] Qiang Zhu, Yansong Wang and Gongqi Shen,”Research and Comparison of Time-frequency Techniques for Nonstationary Signals”, JOURNAL OF COMPUTERS, VOL. 7, NO. 4, APRIL 2012
[13] T. Penzel1 J. McNames2 P. de Chazal3 B. Raymond4A. Murray, Moody6,”Systematic comparison of differentalgorithms for apnoea detection basedon electrocardiogram recordings”, Med. Biol. Eng. Comput., 2002, 40, 402–407 [14] S. Mallat, “A Theory for Multi-Resolution Signal Decomposition Wavelet Representation,” IEEE Trans. On Pattern Analysis and Machine Intell. 11(7), 674-693, 1989.
[15] N.Padmaja1 Dr.S.Varadarajan2 R.Swathi,”SIGNAL PROCESSING OF RADARECHOESUSING WAVELETS ANDHILBERT HUANG TRANSFORM” Signal & Image Processing : An International Journal (SIPIJ) Vol.2, No.3, September 2011
[16] Z.K. Peng, Peter W. Tseb, F.L. Chu. “An improved Hilbert–Huang transform and its application in Vibration signal analysis”. Journal of Sound and Vibration 286 (2005) 187–205
[17] Yuan Li. ”Wavelet Analysis for Change Points and Nonlinear Wavelet Estimates in Time Series.” Beijing: China Statistics Press, 2001. [18] Narcolepsy and Overwhelming Daytime Sleep Society of Australia. Sleep Apnea. [online]. Available: http://www.nodss.org.au/sleep_apnoeas.html
[19] S.L. Chuah, “SIDS Monitoring Device”, Rep, 2004.
[20] Sleep Health Foundation, “Re-awakening Australia: the economic cost of sleep disorders in Australia, 2010”, Deloitte Access Economics Pty Ltd, UK, Rep, 2011.
[21] Andrew K. Ng et al. “Bispectral Analysis of Snore Signals for Obstructive Sleep Apnea Detection”, Proceeding of the 29th Annual International Conference of the IEEE EMBS, August 23-26, 2007.
[22] Findley LJ, Wilhoit SC, Suratt PM.” Apnea duration and hypoxemia during REM sleep in patients with obstructive sleep apnea”, Chest. 1985 Apr;87(4):432-6.
[23] Peretz Lavie, professor,Paula Herer, statisticiaaVictor Hoffstein, professor of medicine. ”Obstructive sleep apnoea syndrome as a risk factor for hypertension: population study”,BMJ 2000;320:479
[24] P. Caseiroa, R. Fonseca-Pintoa, A. Andradea,” Screening of obstructive sleep apnea using Hilbert–Huang decomposition of oronasal airway pressure recordings”, Medical Engineering & Physics 32561–568
[25] John I. Salisbury a,, Ying Sun b,” Rapid screening test for sleep apnea using a nonlinear and nonstationary signal processing technique”, Medical Engineering & Physics 29 (2007) 336–343
[26] D. Liu, Z. Pang, and S. Lloyd, “A Neural Network Method for Detection of Obstructive Sleep Apnea EEG,” in IEEE Transactions on Neural Networks., vol. 19, no. 2,pp.308–318, 2008.
[27] R. Lin, R. Lee, C. Tseng, H. Zhou, C. Chao, and J. Jiang, “A New Approach for Identifying Sleep Apnea Transform and Neural Networks,” Biomedical Engineering:Applications, Basis & Communications., vol.143,2006
[28] Huang NE, Shen Z, Long SR, Wu MC, Shih HH, Zheng A, et al. “The empirical mode decomposition and and non-stationary time series analysis”. Proc Roy Soc London Ser A1998;454:903–95.
[29] Huang NE, Shen Z, Long SR. A new view of nonlinear water waves:the Hilbert spectrum. Ann Rev
[30] P. DUHAMEL,M. VETTERLI.” FAST FOURIER TRANSFORMS: A TUTORIAL REVIEW ANDA STATE OF THE ART”.
[31] Yufeng Zhang ab,∗, Zhenyu Guo a, Weilian Wang ab, Side He ab, Ting Lee a,Murray Loew a.” A comparison of the wavelet and short-time fourier transforms for Doppler spectral analysis”. Medical Engineering & Physics 25 (2003) 547–557
[32] Semion Kizhner, Thomas P. Flatley, Dr. Norden E. Huangl Karin Blank, Evette Conwell.” On the Hilbert-Huang Transform Data Processing System Development”2. 2004 IEEE Aerospace Conference
[33] P. Caseiroa,b,∗, R. Fonseca-Pintoa,c, A. Andradea.’”Screening of obstructive sleep apnea using Hilbert–Huang decomposition of oronasal airway pressure recordings”. Medical Engineering & Physics
[34] B. Lind, J. Goodwin, J. Hill, T. Ali, S. Redline, and S. Quan, “Recruitment of healthy adults into a study in the home: experience of the sleep heart health study,” Sleep Breath, vol. 7, no. 1, pp. 13–24, 2003
[35]EDF viewer [online].Available https://sleepdata.org/
[36] EDF viewer [online].Available https://sleepdata.org/tools/edf-viewer
[37] Huang N, Shen S. Hilbert–Huang transform and its applications. World Scientific Publishing Co; 2005.
[38] Nandakumar Selvaraj_ and Ravi Narasimhan. Detection of Sleep Apnea on a Per-Second Basis Using Respiratory Signals, 35th Annual International Conference of the IEEE EMBS Osaka, Japan, 3 - 7 July, 2013
[39] Philip de Chazal*, Conor Heneghan, , Elaine Sheridan, Richard Reilly, Member, IEEE,Philip Nolan, and Mark O’Malley. Automated Processing of the Single-Lead “Electrocardiogram for the Detection of Obstructive Sleep Apnoea, IEEE TRANSACTIONS ON BIOMEDICAL ENGINEERING”, VOL. 50, NO. 6, JUNE 2003
[40] HANS PASTERKAMP, S. KRAMAN STEVE, and R. WODICKA GEORGE "Respiratory Sounds, " American Journal of Respiratory and Critical Care Medicine, Vol. 156, No. 3 (1997)
[41] A.Ajmani, J Mazumdar, D.Jarvis,”Spectral analysis of an acoustic respiratory system with a view to developing a sleep apnoea monitor”,Australian physical and engineering science in medicine,vol.19 no.2 , 1996
[42] Thinklabs Stethoscope Software ,[Online] ,Available:http://www.thinklabs.com/
