Difference between revisions of "Projects:2015s1-61 Computer Aided Measurement and Analysis of Equal Efficiency Characteristics of Electrical Machines"
(→DC Machine) |
(→Switched Reluctance Machine) |
||
| (4 intermediate revisions by 2 users not shown) | |||
| Line 12: | Line 12: | ||
====Efficiency and losses of electrical machines==== | ====Efficiency and losses of electrical machines==== | ||
| − | According to W. Cao [ | + | According to W. Cao [1], accurate measurement of losses is a key point to determine efficiency of electric machine. In the two standard IEEE 112 and IEC 60034-2-1, there are various identified losses, such as stator conduction losses, stray load losses, rotor conductor loss, friction and windage loss. The approaches of measuring losses are different in the two standards. For instance, in the IEEE 112 standard the core loss is assumed to be the same at all load points, but the core loss varies with load in IEC 60034-2-1 standard. |
Although the approaches of measuring losses are different, the methods of calculating efficiency are the same. In order to calculate the efficiency of a test machine, the input electric power and output mechanical power need to be calculated. In this project, a dynamometer system that has integrated torquemeter and power analyser is available to measure some vital data for iso- efficiency map plotting. | Although the approaches of measuring losses are different, the methods of calculating efficiency are the same. In order to calculate the efficiency of a test machine, the input electric power and output mechanical power need to be calculated. In this project, a dynamometer system that has integrated torquemeter and power analyser is available to measure some vital data for iso- efficiency map plotting. | ||
| Line 81: | Line 81: | ||
The motor has just been run for one time, later on when the start button pressed the overvoltage light lit and motor does not have any response again. According to the fault finding section of the user manual, all the wiring should be correct and the voltage should also be correct, then if nothing faulty can be found on the Gate Drive Board (GDB) of the drive, then the drive could be have damaged. Later on the drive has been disassembled and the GDB has been checked by using a multimeter but nothing suspectable to cause the issue has been found until the report is submitted. | The motor has just been run for one time, later on when the start button pressed the overvoltage light lit and motor does not have any response again. According to the fault finding section of the user manual, all the wiring should be correct and the voltage should also be correct, then if nothing faulty can be found on the Gate Drive Board (GDB) of the drive, then the drive could be have damaged. Later on the drive has been disassembled and the GDB has been checked by using a multimeter but nothing suspectable to cause the issue has been found until the report is submitted. | ||
| + | |||
| + | Though the iso-efficiency map for SRM is not measured, we can predict the iso-efficiency map for SRM as shown below. The efficiency of SRM is very high at high speed, and SRM usually has low torque at high speed. | ||
| + | |||
| + | [[File:SRM_prediction.png]] | ||
== Squirrel Cage Induction Machine == | == Squirrel Cage Induction Machine == | ||
| Line 91: | Line 95: | ||
== Reference == | == Reference == | ||
| − | [1] D. Vanhooydonck et al., “Calculating Energy Consumption of Motor Systems with Varying Load using Iso Efficiency Contours”, in XIX Int. Conf. Elect. Mach., Rome, 2010. | + | [1] Wenping Cao, “Comparison of IEEE 112 and New IEC Standard 60034-2-1”,Dept. Sci. Tech., Univ. Teesside, United Kingdom, pp. 264. |
| + | |||
| + | [2] D. Vanhooydonck et al., “Calculating Energy Consumption of Motor Systems with Varying Load using Iso Efficiency Contours”, in XIX Int. Conf. Elect. Mach., Rome, 2010. | ||
| + | |||
| + | [3] W. Deprez et al., “Iso efficiency contours as a concept to characterize variable speed drive efficiency,” in 2010 XIX Int. Conf. on Elect. Mach. (ICEM), Sep. 2010, pp. 1-6. | ||
| − | [ | + | [4] K. Stockman et al., “Iso efficiency contour measurement results for variable drives,” in 2010 XIX Int. Conf. on Elect. Mach. (ICEM), Sep. 2010. pp. 1-6. |
| − | [ | + | [5] Wen Soong, “DC Machines: Parameter Measurement and Performance Prediction”, Power Eng. Briefing Note Series, May 2008. |
== Project team == | == Project team == | ||
Latest revision as of 15:59, 26 October 2015
Contents
Project Group 61 introduction
Aim
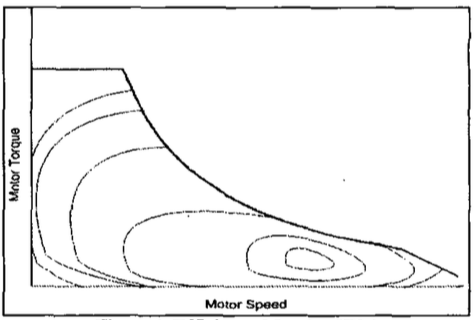
The main goals of the project is to explore the iso-efficiency map for a variety of electric machines, including brushed DC machines, switched reluctance machines (SRM) and squirrel cage induction machines (SC IM). The comparison and analysis of the iso-efficiency maps are tasks in the project. Iso-efficiency map is a new concept to describe the efficiency at each operating point in the operating region. The process involves machine testing, system setup, data acquisition to obtain the resulted iso-efficiency map to form a comprehensive view of electrical machine efficiency characteristics. The expected iso-efficiency map for electrical machine is similar with K. Stockman’s work [1], this is a typical iso-efficiency map for an induction machine.
Motivation
Iso-efficiency map describes the efficiency of each operating point on the torque-speed operating region. With the iso-efficiency map of each type of electrical machines, industry could predict the energy consumption in particular application and select the most efficient electrical machine, thus energy could be saved. In this project, the team carry out computer aided measurement and plotting of iso-efficiency map. It provided brief image about the efficient operating region of different machine.
Background
Efficiency and losses of electrical machines
According to W. Cao [1], accurate measurement of losses is a key point to determine efficiency of electric machine. In the two standard IEEE 112 and IEC 60034-2-1, there are various identified losses, such as stator conduction losses, stray load losses, rotor conductor loss, friction and windage loss. The approaches of measuring losses are different in the two standards. For instance, in the IEEE 112 standard the core loss is assumed to be the same at all load points, but the core loss varies with load in IEC 60034-2-1 standard.
Although the approaches of measuring losses are different, the methods of calculating efficiency are the same. In order to calculate the efficiency of a test machine, the input electric power and output mechanical power need to be calculated. In this project, a dynamometer system that has integrated torquemeter and power analyser is available to measure some vital data for iso- efficiency map plotting.
By using the dynamometer system associated with the integrated data acquisition equipment, the value of output torque (𝑇) and rotational speed (𝜔) could be obtained on the labview interface of the test computer. Then the instantaneous output mechanical power could be calculated.
The instantaneous output mechanical power is defined as
𝑃𝑚𝑒𝑐h(𝑡) = 𝑇(𝑡).𝜔(𝑡) (1)
The voltage (𝑉), current (𝐼) and power factor (𝑐𝑜𝑠𝜑) could also be measured by a power analyser that has been integrated into the labview interface and the values could be obtained easily. Thus the 3 phase instantaneous input electric power could be calculated.
The 3 phase instantaneous input electric power is defined as
𝑃𝑒𝑙𝑒𝑐(𝑡) = 3. 𝑉(𝑡). 𝐼(𝑡)𝑐𝑜𝑠𝜑 (2)
Therefore the efficiency could be calculated by using
𝜂(𝑡) = 𝑃𝑚𝑒𝑐h(𝑡)/𝑃𝑒𝑙𝑒𝑐(𝑡) (%) (3)
As the losses are unavoidable during the measurement, e.g. the 𝑃𝑚𝑒𝑐h(𝑡) is always less than 𝑃𝑒𝑙𝑒𝑐(𝑡), the efficiency should be less than unity.
Proposed Approach
All electric machine will be tested in the Dynamometer system. One of the PHD student, Gabriel, has built the dynamometer system in the power laboratory at the University of Adelaide. The Machines will be integrated into this system. The development of computer interface for DC and Switched Reluctance Machine is one of major task in the integration. As the DC and SWR machine do not have a software-based interface, an interface board is required to built to allow computer control the drive. The USB DAQ 6009 is selected by the team and supervisor. It is I/O device that can transmit and receive digital and analogue signal.
Dynamometer System
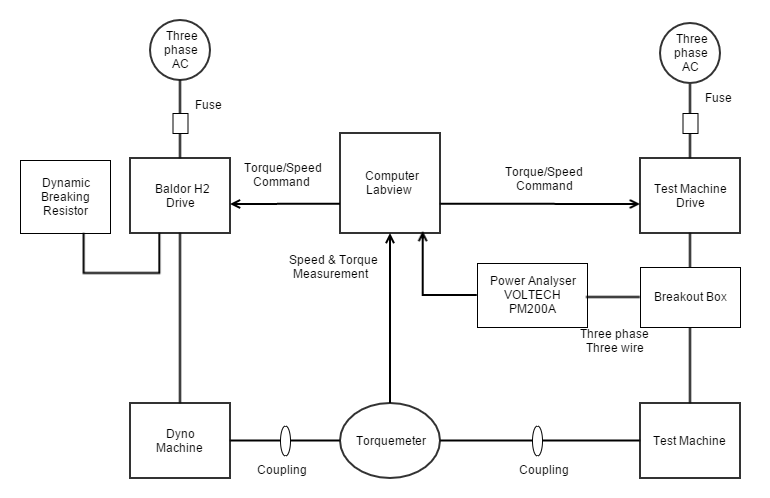
Electric Machine is integrated into the dynamometer system. The system facilitate accurate measurement of efficiency. The Dyno machine acts as load and H2 drive controls the torque systemically. The function of computer is to send command to the drives and received data from measurement equipment. The control system monitor measured value and compare with reference value. The computer send speed and torque command to drive until certain condition is achieved.
DC Machine
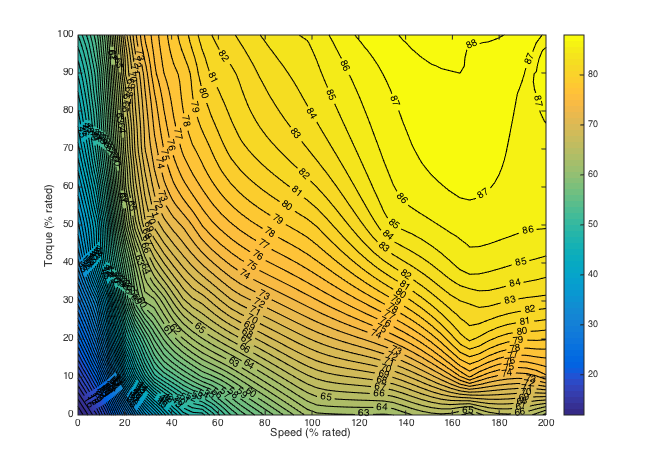
The DC machine tested is a 5kW brushed DC machine. It is connected to a SIEMENS drive and the No-Load test is done. The first picture is the calculated efficiency for fixed load test, and the second test is the performance prediction done by Assoc. Prof Wen[4]
From this map it has shown some interesting properties of this DC machine. First to notice is that the efficiency map for this DC machine is linear, but it goes bi-directional. In horizontal direction, when the torque is fixed, then the efficiency should be similar for a range of speeds. Nevertheless, for higher efficiency, the speed range reduces as the minimum speed required goes higher, including slightly increasing of torque. For example, from the plot, the 25% efficiency covers speed from about 0 rad/s to 100 rad/s but for 70% efficiency the minimum speed is approximately 60 rad/s and the torque increases from 0.05 Nm to about 0.25Nm.
It is observed that the efficiency is not vertical in y-axis, increasing the efficiency decreases the slope. That means for higher efficiencies, if the speed is maintained, apart from the enclosed region, increasing or decreasing the torque will lower the efficiency dramatically if operates in high efficiency point.
The another aspect is that for DC machines, it is possible to maintain the speed and efficiency by shifting the torque to the upper or lower level whereas the opposite each torque can have a range of speed associate with that efficiency depending on how much efficiency is required.
Based on the findings, it is recommended that for DC machine it is better to operate at rated torque then speed up to the rated speed. The machine efficiency is normally low if running at high load but slow speed. If the load is too low, then no matter how fast the machine is, the efficiency does not improve by accelerating the machine.
Switched Reluctance Machine
The model of the SRM is Oulton Drive 112S, it is rated at 4kw and 1500rpm, the rated voltage is 415/380V and the rated current is 9A.
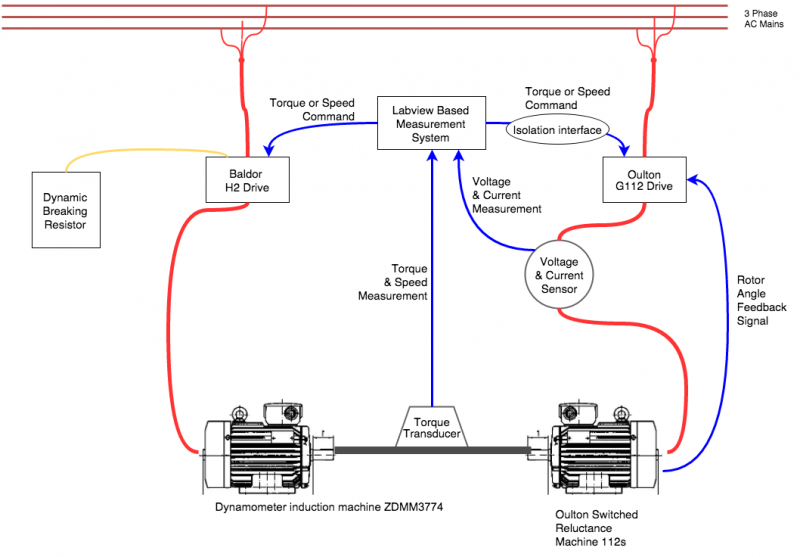
The system layout for SRM is shown below for developing a system level of how the system works and essential parameters are measured.
As shown in the system layout diagram, the red lines represent the power cable and the blue lines represent the signal cable, the yellow line represents the power consumed in the Dynamic Breaking Resistor (DBR). While the system is operating, the SRM is used as a motor and the dynamometer is used as a load, i.e. generator. The dynamometer converts the mechanical power into electrical power which is finally consumed in the DBR. For every operating point needs measurement, the Labview based test computer will send torque or speed command to the drives, and collect data directly from torquemeter and power analyser/voltage & current sensor then record the data in the worksheet.
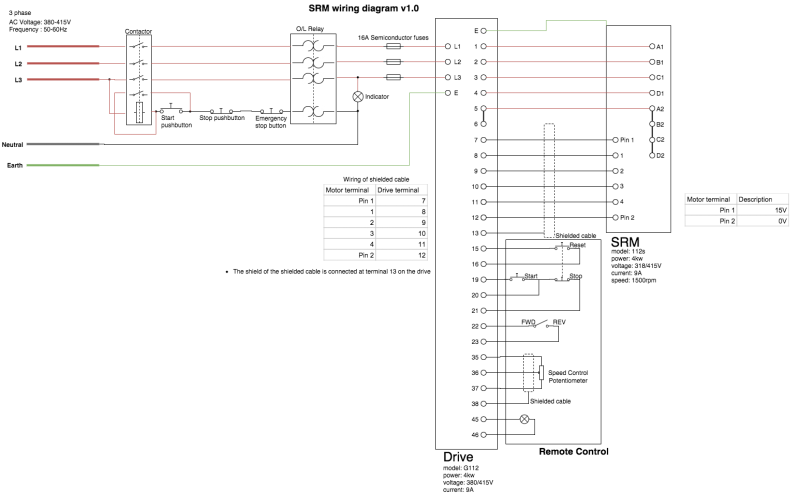
However, to get all these things work, the wiring diagram has to be developed and the SRM get tested on a pot first. The requirement of using IEEE standard symbols has been met after several updates and should be easy to follow with. It clearly indicates the terminal accordance and listed a list of terminal accordance for the shielded feedback signal cable between the switched reluctance machine and the drive. The main part to build is the power circuit of the system which addressed the issue of ordering the proper equipment to set up the testing system. This process involves learning the specifications of different equipment and understanding their compatibility to make sure everything is able to match with each other. The final version of the wiring diagram of the SRM can be found below.
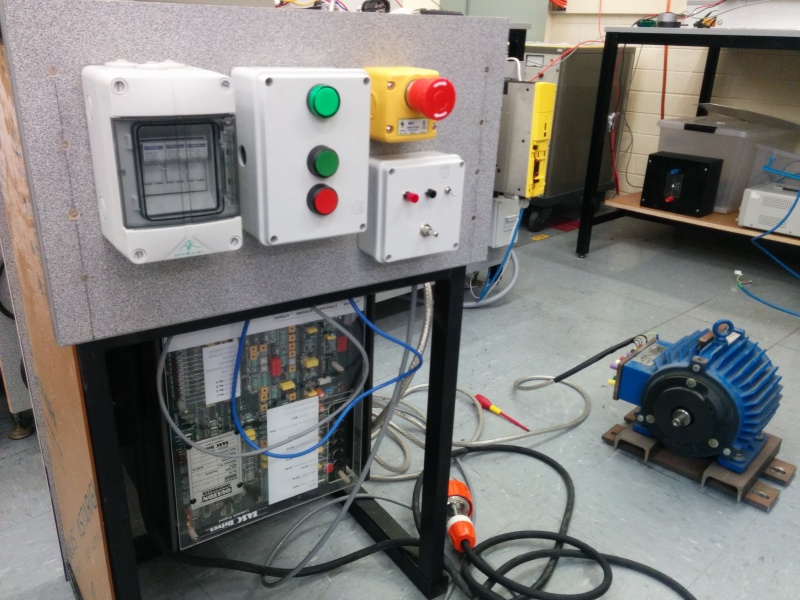
After the SRM has been setup, it need to be tested without load first to make sure all the functions of the drive is in order. The picture of SRM testing is shown below.
After the power cable is connected and start button depressed, the SRM did not start running as expected even the potentiometer has been rotated, and the reverser light always lit somehow no matter how the reverse switch is switched. Later on the reverse switch part has been checked with multimeter and nothing wrong has been found, this might be an issue inherently with the circuit board of the drive.  However, the machine has been tested multiple times and it suddenly started running with a loud acoustic noise after the start button pressed and potentiometer rotated, but the speed adjustment by rotating the potentiometer is not very effective, the picture below shows the situation of the indictors under that circumstance. Where we can found the reverse light still lit. This might be caused be the modification of the control panel circuit board of the drive.
The motor has just been run for one time, later on when the start button pressed the overvoltage light lit and motor does not have any response again. According to the fault finding section of the user manual, all the wiring should be correct and the voltage should also be correct, then if nothing faulty can be found on the Gate Drive Board (GDB) of the drive, then the drive could be have damaged. Later on the drive has been disassembled and the GDB has been checked by using a multimeter but nothing suspectable to cause the issue has been found until the report is submitted.
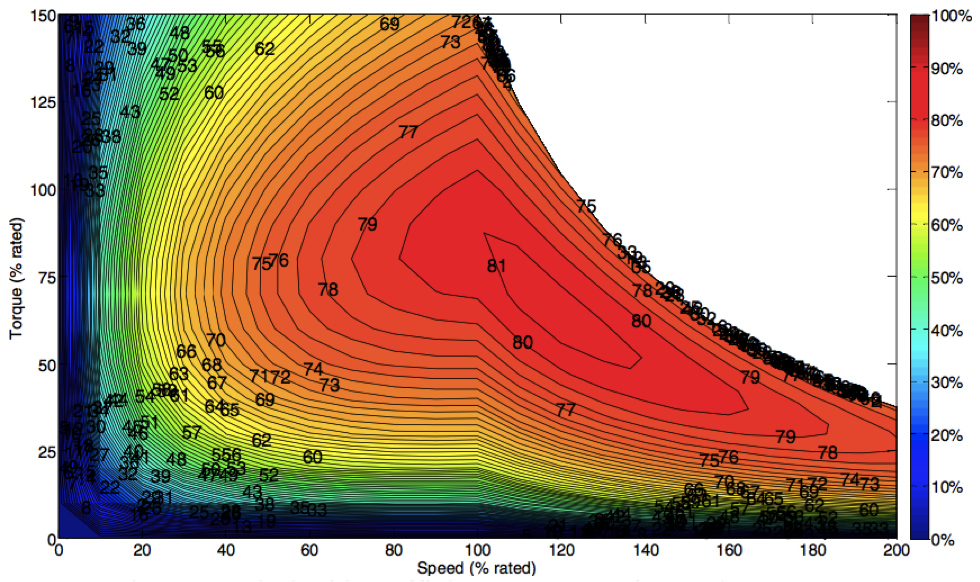
Though the iso-efficiency map for SRM is not measured, we can predict the iso-efficiency map for SRM as shown below. The efficiency of SRM is very high at high speed, and SRM usually has low torque at high speed.
Squirrel Cage Induction Machine
The SC IM is a 2.2 kW Baldor machine. The induction machine is widely used in the industry. The drive used is Motiflex e100. It has a user-friendly interface and facilitate software configuration via "Mint WorkBench". As the manufacture has designed computer interface between drive and computer, the integration into the system does not take much time compared with DC and SWR Machine. All connection must be correct to ensure the functionality of drive, such as temperature switch, encoder cable(feedback).
Reasult - Iso-efficiency Map of SC IM
The Squirrel Cage Induction Machine is integrated and tested in the Dynomometer system. The 10x10 speed amd torque value is measured. The iso-efficiency map has been plotted in MATLAB. The result shows that the machine operate efficiently at relatively high speed and low torque rather than rated value. The lowest efficiency is at low speed. It is found that the efficiency is increasing when higher torque is added to the test machine. One of the limitation is overload operating region. As the machine can only run overload for short time, the data set above rated torque is missing.
Reference
[1] Wenping Cao, “Comparison of IEEE 112 and New IEC Standard 60034-2-1”,Dept. Sci. Tech., Univ. Teesside, United Kingdom, pp. 264.
[2] D. Vanhooydonck et al., “Calculating Energy Consumption of Motor Systems with Varying Load using Iso Efficiency Contours”, in XIX Int. Conf. Elect. Mach., Rome, 2010.
[3] W. Deprez et al., “Iso efficiency contours as a concept to characterize variable speed drive efficiency,” in 2010 XIX Int. Conf. on Elect. Mach. (ICEM), Sep. 2010, pp. 1-6.
[4] K. Stockman et al., “Iso efficiency contour measurement results for variable drives,” in 2010 XIX Int. Conf. on Elect. Mach. (ICEM), Sep. 2010. pp. 1-6.
[5] Wen Soong, “DC Machines: Parameter Measurement and Performance Prediction”, Power Eng. Briefing Note Series, May 2008.
Project team
Supervised by: Assoc Prof. Nesimi Ertugrul and Assoc Prof. Wen Soong
Team Members: Ka Kit Poon, Zeyu Chen, Kejie Huang
