Difference between revisions of "Projects:2017s1-100 Face Recognition using 3D Data"
m (→Introduction) |
|||
| (38 intermediate revisions by 3 users not shown) | |||
| Line 12: | Line 12: | ||
* Facial recognition from 3D models | * Facial recognition from 3D models | ||
| + | |||
| + | == 3D data from Polarimetry == | ||
| + | |||
| + | ==== Method ==== | ||
| + | |||
| + | The method used shall reflect the process that Gurton et al. used in their papers. Surface normals are calculated by applying Fresnel equations to the Kirchoff radiation law and then equating to degree of linear polarisation (DoLP). The surface normal are then integrated using the Frankot-Chellappa method to reconstruct the three-dimensional surface. | ||
| + | |||
| + | Firstly, known absorptivity and reflectivity as well as experimental directional spectral emissivity is input into the Kirchoff radiation law relationship pictured in Equation 1. | ||
| + | |||
| + | [[File:E1.png]] | ||
| + | |||
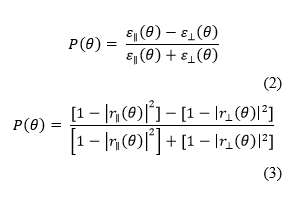
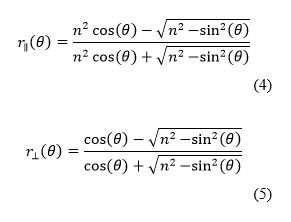
| + | Next, DoLP is calculated by applying Fresnel reflection coefficients to the DoLP formula in Equation 2 to get Equation 3. | ||
| + | |||
| + | [[File:E2.png]] | ||
| + | |||
| + | Where | ||
| + | |||
| + | [[File:E4.png]] | ||
| + | |||
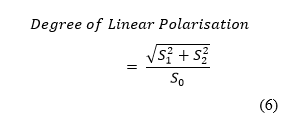
| + | This is then equated to the experimentally-found values for the DoLP calculated from the Stokes images using Equation 6. The equated function can then be numerically solved by a range of equivalent methods but for computational speed and ease of use, Matlab’s fzero function is implemented. Also important is to take the modulo of theta with pi to ensure correct phase. | ||
| + | |||
| + | [[File:E6.png]] | ||
| + | |||
| + | The formula for the normal of a surface is given by Equation 7. | ||
| + | |||
| + | [[File:E7.png]] | ||
| + | |||
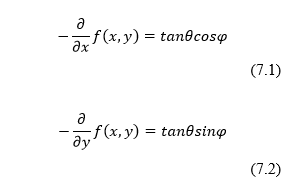
| + | From basic trigonometry it is then implied that for this application the partial derivatives are as shown in Equations 7.1 and 7.2. | ||
| + | |||
| + | [[File:E71.png]] | ||
| + | |||
| + | These partial derivatives show that the magnitude of the normal is given by the tangent of theta, or how close theta is to parallel to the camera’s line of sight and the direction is provided by the real and imaginary components of the azimuthal angle. | ||
| + | |||
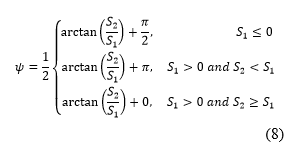
| + | Phi is calculated as according to the conditions used in Equation 8. These conditions exist to correct the phase, which is falsely aligned, so that slopes are found in both directions. Again, like the calculations for theta, the modulo of phi with π must be taken to ensure correct values. The limitation of this calculation, is that phi values are only calculated in the range 0 to π whereas, phi, being any direction with a circle, should be of the range 0 to 2 π, meaning that some of the angles are π lower than they should be. There is no equation to calculate with certainty whether or not an angle phi should have π added to it, instead previous papers[13] have used the generally convex nature of the face to apply known values at the edges and then, assuming a relatively smooth surface, iterate inwards adjusting the nearby values if they are outside a threshold when compared to the corrected edge values. | ||
| + | |||
| + | [[File:E8.png]] | ||
| + | |||
| + | The final step is to integrate the normals using the Frankot-Chellapa method used by Gurton et al. for the reasons of ease and smoothing[13]. For this paper the open source Frankot-Chellappa Matlab code provided by Peter Kovesi[14] as shown in appendix a was used. | ||
| + | |||
| + | |||
| + | ==== Initial Using US A.R.L. Database ==== | ||
| + | The results portrayed in this section are downsampled for purposes of illustration from original 250x200 images in the database to 50x40 arrays. All images are of Subject A in the ARL database and oriented such that the forehead is at the top of the image and chin at the bottom. | ||
| + | |||
| + | [[File:USARL.png]] | ||
| + | |||
| + | As expected, the theta values appear to be highest where the facets of the face are most oblique to the camera whereas flat portions have values close to zero. | ||
| + | |||
| + | Phi values appear rather differently with parts of the face that are changing predominantly in the x axis being blue and those changing predominantly in the y axis being yellow. | ||
| + | |||
| + | The x components of the derivative appear mostly as expected. Note the lack of variation in the y axis as the image is cropped such that the top and bottom of the head, where there most slope is in that axis, are not present. Also note that the values are inverted and there are outliers in the visibly low parts of Fig 7 but mathematically high parts. | ||
| + | |||
| + | The y components of the derivative appear mostly as expected. Note, again, the lack of variation in the y axis as the image is cropped such that the top and bottom of the head, where there most slope is in that axis, are not present. The values are also inverted and there are outliers in the visibly low but mathematically high parts however they are notably less significant than in the x component. | ||
| + | |||
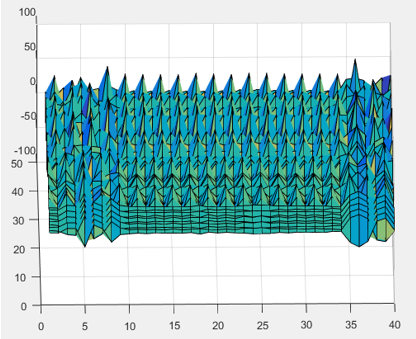
| + | The figure below shows the integral calculated. The face is not visible, instead there are rows and columns of spikes, a peculiar effect of the smoothing effect of the Frankot-Chellappa method. This may be fixed by a combination of changes such as cropping the faces before integrating and doing pre-smoothing of dx and dy to get more consistent magnitudes to prevent smoothing of spikes in dx and dy propagating incorrectly and serving only to raise the magnitude of the column and row they are in. | ||
| + | |||
| + | [[File:Old Result.png]] | ||
| + | |||
| + | ==== Frankot-Chellappa Verification ==== | ||
| + | As previous Frankot-Chellappa integral results had provided unexpected outputs and investigation was done to test and verify that Peter Kovesi’s code functioned correctly. This involved the construction of a range of three dimensional surfaces, calculation of their partial derivatives and putting them through the Frankot-Chellappa function. These worked almost immediately, confirming the accuracy of the function though some experimentation was required to sort out some minor issues. | ||
| + | |||
| + | [[File:Linear.png]] | ||
| + | |||
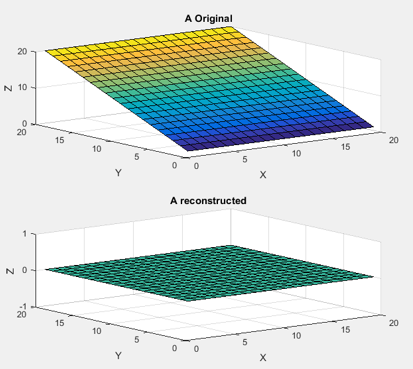
| + | Shown above is the first shape tested with the Frankot-Chellappa function. This shows one major limitation of the Frankot-Chellappa method, that it does not work well for surfaces with large linear components due to the lack of differences in Fourier representation. | ||
| + | |||
| + | [[File:Linear Fixed.png]] | ||
| + | |||
| + | As can be seen in the figure above, padding the boundary with zeros fixed the problem of linear surfaces not being constructed. This works because adding the second plane now forces a single Fourier representation of the shape. | ||
| + | |||
| + | Another issue identified with Frankot-Chellappa reconstructions was that large amplitudes towards the corners had a tendency to be mirrored in other corners, albeit with slightly lower amplitude. Again, padding with zeros solved this. | ||
| + | |||
| + | In fact, all surfaces were reconstructed in near-perfection once the zero padding was added, with only minor errors noticeable at the discontinuities between shapes and the zero padding plane. The algorithm was even able to reconstruct relatively complex surfaces such as the two variable sinusoidal peak pattern shown below. | ||
| + | |||
| + | [[File:Complex.png]] | ||
| + | |||
| + | |||
| + | ==== Re-application to US A.R.L. Database ==== | ||
| + | As tests with synthetic surfaces had proven successful with the Frankot-Chellappa code, it was re-integrated back into the program for reconstructing the US A.R.L. images. At this point integrals started being calculated correctly, suggesting that there had been a simple error made somewhere in the code implementing Peter Kovesi’s function. Despite the integrals now looking as though they were plausible, reconstructions of the provided information, the surfaces were not accurately depicting the subjects’ faces. This demonstrated errors in the calculation of earlier components, namely the angles theta and phi. | ||
| + | |||
| + | Code review identified a number of potential sources of the errors visible in the reconstruction. One such error was that the DoLP values being used in the calculation of theta which were not being correctly normalised for a 16 bit integer and were also too high a magnitude, having been normalised by the camera, and as such had to be multiplied by another coefficient, nominally 0.04, to bring the values into a reasonable range. This value was provided by a trained LWIR camera operator and was based off their experience. There was also an issue with the numerical solving function, fsolve, not finding solutions for theta at all points. This was rectified by detecting the error flag output and if a solution was not found, simply using the previous pixel’s theta value as an approximation. | ||
| + | |||
| + | |||
| + | The theta values shown look like those calculated previously but have considerable noise, which should not be present for a relatively smooth human face so median filtering the values was tested, the result of which is illustrated below. | ||
| + | |||
| + | [[File:Theta.png]] | ||
| + | |||
| + | With reasonable values of theta calculated, phi could be found from them. Phi values also looked acceptable, other than a significant outlier in the middle of Subject A’s face which was solved by median filtering as used to control noise in theta values. The filtered values of phi are provided below. | ||
| + | |||
| + | [[File:Phi.png]] | ||
| + | |||
| + | From theta and phi, the partial derivatives were calculated and the integral done again, the results of which are shown below. | ||
| + | |||
| + | [[File:Result.png]] | ||
| + | |||
| + | As is visible in above, a face shape was becoming visible, a major improvement from the spiky grid shown at the start that had resulted previously. The partial reconstruction with a portion ‘missing’ or smoothed out immediately suggests a frequency or phase having been calculated incorrectly. The spikes in the previous reconstruction are thought to have been due to theta and phi being of inverted forms what they should have been and the modulo bounding the magnitudes causing significant spike components. | ||
| + | |||
| + | Working backwards in the analysis of where the code had gone wrong it was noticed that the partial derivatives were symmetric as they should not have been for a convex shape. The partial derivative of a cylinder, a rough analogy for a face, in x and y in respect to one variable should be positive on one side and negative on the other. Another concern was that downsampling may have been adding discontinuities affecting the frequency representation of the surface and so, to minimise this, images were used at their native resolution though cropped tighter to the facial area for both computational speed and ease of analysis. Without this the drop to a flat background surrounding the faces in the databases’ images exhibited some bending and undulation that should not have been present. | ||
| + | |||
| + | The angle phi determines what direction the derivative goes in and as such it was determined that the error must have come from there. After going back to existing papers on the topic it was realised that the calculation for phi has an ambiguity of exactly pi. The range of phi is from 0 to 2π however the calculation to get phi only provides answers from 0 to π. It is therefore necessary to correct some values by applying known boundary conditions, e.g. that the right side of the face should have vectors pointing towards the right and thus be close to 0 to 2 π. Similarly, the top should have vectors pointing upwards towards π/2, the left towards π and the bottom towards 3π/2. The method used by Yuffa et al. was to apply these known conditions to the boundaries of the data and then correct nearby values to whichever of the phi or phi + π was closest to the known value next to it. This is continued from the edges inwards towards the centre until all values have been corrected. | ||
| + | |||
| + | An attempt to implement a similar algorithm to correct phi was attempted but, due to time constraints, not completed. Estimates of the correct partial derivatives were calculated by simply reversing the sign of half of each derivative, in the y axis for dx values and in the x axis for dy values, and then shifting them so they meet the original values. This resulted in the far more accurate and detailed face reconstruction shown in above. | ||
| + | |||
| + | This face is another large improvement on the previous reconstruction though still not ideal. In particular, the noticeable effects of a discontinuity can be seen from the top to the bottom down the middle of the face. It was hoped that this discontinuity would be improved by smoothing the partial derivatives however the integration is not significantly improved. This is likely due to the filter window being too small to cover the indentation at the discontinuity. While a larger windowed filter may be able to remove this valley, excessive use of post-processing would only serve to remove discriminative features present in the faces required for facial recognition applications. | ||
| + | |||
| + | [[File:Stokes.png]] | ||
| + | |||
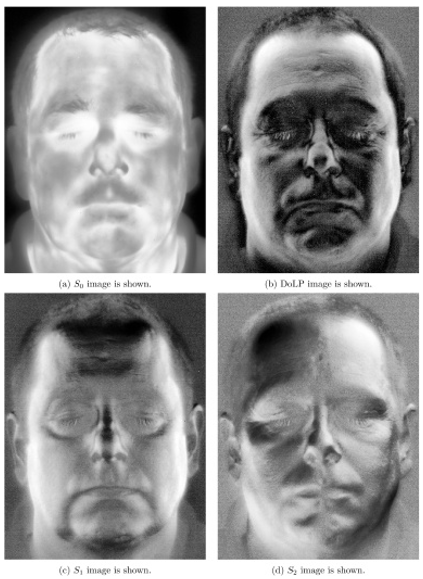
| + | We also gained access to a high quality IR camera that enabled us to take our own polarimetric images shown above. Unfortunately, these were not suitable for use with the existing algorithm due to relatively high noise preventing the numerical solver from calculating values. | ||
| + | |||
| + | == 3D data from Xbox Kinect and Pre-processing == | ||
| + | |||
| + | This section involves the creation of the software responsible for interfacing the newest Kinect camera (Kinect V2) hardware with MATLAB software on a computer. It included the canonical preprocessing techniques done from the 3D depth point cloud data resulting to a 3D facial image aligned to a frontal view pose for face recognition. | ||
| + | |||
| + | === Method & Results === | ||
| + | |||
| + | ==== Kinect and Eurecom Database Interface ==== | ||
| + | The acquisition of the image using the Kinect V2 was done first through connecting the Kinect camera with the MATLAB software. The subject was set up to have a distance no further than 1 metre away from the camera. The reasoning behind this is to allow the depth resolution to work around the 1.5mm depth resolution accuracy of a Kinect Camera. The image acquisition toolbox present in Matlab allows the user to acquire three sets of possible data, a 2D RGB image, a grayscale depth map or a RGB-D point cloud. This thesis worked with the RGB-D point cloud to be consistent with the data acquired from the available database. An added bonus is that Matlab has already aligned the coloured image with its subsequent grayscale point cloud and thus preventing any misalignment issues presented by the difference in camera locations. The figure below displays the result of the image acquisition step for the Kinect camera | ||
| + | [[File:KinectImage.JPG]] | ||
| + | |||
| + | |||
| + | |||
| + | The Eurecom database was used as it already provides the array for the creation of point clouds with each subject and is the current database used for the facial recognition software. Another reason is due to the point cloud already been processed in a way that the background and any possible outliers from the front of the subject have been separated from the needed point cloud which in this case is the person being captured. The image below shows the three different poses the subjects mad which shows the initial processing done on the database already. The yellow and blue areas from the image of the point cloud represents the outliers, both the background and the frontal outliers. The main area of work is the green shaded area of the point cloud. The interface is currently working with images with no major occlusions, however eyeglasses are an exception. The reasoning behind this is to allow the nose-tip detection and face cropping stages described ahead with relative ease. | ||
| + | [[File:EURECOMInitial.jpg]] | ||
| + | |||
| + | |||
| + | ==== Nose Tip Detection ==== | ||
| + | Nose-tip detection for the point cloud acquired from the Kinect data is fully automatic. It is done through the use of the Viola - Jones algorithm. The algorithm uses the already aligned coloured image to detect the face initially. The image is cropped on the detected face and is put through Viola - Jones again to acquire the nose of the face. This reduces the incidence of false detection and improves the accuracy of the nose-tip detection. The point cloud is then cropped depending on the detected nose, and the closest point to the camera is selected as the nose-tip. Although, this way of nose-tip detection may provide only a rough location of the nose-tip, the nose-tip point is only needed for the purpose of a finding a rough centre point of the face for face cropping. The subsequent face cropping algorithm is robust enough that it will work as long as the nose-tip detected is within a few points from the actual nose - tip.Due to the Viola - Jones algorithm not working for tilted heads, the detection for tilted head is done by first rotating the image point cloud until a face is detected. To improve robustness the algorithm also checks if the other necessary features which is needed for the face cropping is detected. As the location of the head has barely changed with the rotation of the image it is assumed that the rotated image detected face is at the same place as the tilted head and that the nose tip is within the same area as the nose point cloud. The figures below summarizes the steps in determining the nose tip point for the Kinect camera both with frontal and tilted heads. | ||
| + | |||
| + | [[File:CroppingKinect.JPG]] | ||
| + | [[File:TiltedHeadNose.JPG]] | ||
| + | |||
| + | |||
| + | |||
| + | With outliers and the background already removed from the point cloud acquired from the database an automatic nose-tip method can be done albeit a little different with the Kinect camera captured data. One of the major issues is the misalignment of the coloured images present in the database compared to the point cloud data and thus the same method is not viable. Nose-tip detection is done by utilizing the vertical facial symmetry of the average human face, by first finding the closest points to the camera for frontal poses or by finding the smallest or largest point values in X depending on left or right pose and creating a histogram with Y values. This is followed by disregarding points not around the middle section of the head and allowing only points that are within two thirds distance from the centre. The correct nose tip is determined by choosing the closest point to the camera for frontal poses or the leftmost or rightmost point of the face for profile photos within the now enclosed area. The two thirds distance leeway is to account for any additional outlier such as beards or glasses and also for any additional pose differences that has not been taken into account. This method is highlighted by figure underneath. | ||
| + | |||
| + | [[File:NoseTipDetectionEurecom.JPG]] | ||
| + | |||
| + | |||
| + | |||
| + | |||
| + | ==== 3D Face Cropping ==== | ||
| + | The point cloud is put through a face cropping algorithm which only includes the important features such as the eyes, nose and the mouth while also removing the hair and ears from the point cloud system. The algorithm is initialized by assuming that the nose tip is at the center of the face. This is also necessary for the canonical preprocessing techniques especially the symmetric filling section. This is done by putting the nose-tip point acquired on the previous step and normalizing the X and Y values of the point cloud to place the nose tip on the origin point, while leaving the depth data untouched. The radius of the cropping is set up so that it will remove the ears, the neck and any excess hair collected from the top of the head leaving only a section of the forehead, eyes nose, mouth and a section of the chin. | ||
| + | |||
| + | The Eurecom database had all of the subjects at a same distance from the camera for all of the photos and for each session. This meant that the radius for the face cropping was consistent enough and the same throughout the whole database. The radius was selected through a trial and error basis, and the optimal radius was found to be along 80 geometric points from the nose-tip detected. The Kinect camera on the other hand did not have this luxury. Instead the Viola Jones algorithm is adjusted to find additional features, not only the nose. When possible, the eyes and the mouth were also located. Using the vertical facial symmetry of an average face and the cropped point clouds specific to the mouth, nose and the eyes, the radius of the face is found even with varying distances from the Kinect camera. The point cloud is also arranged in the order to which the width of the face is along the X axes, and the height of the face on the Y. The results are seen underneath. | ||
| + | |||
| + | [[File:KinectResultCropped.PNG]] | ||
| + | [[File:EURECOMDATA.jpg]] | ||
| + | |||
| + | |||
| + | |||
| + | |||
| + | ==== Pose Correction ==== | ||
| + | Pose correction is done using non-rigid ICP algorithm. Using the ICP algorithm will cor- rect the pose of the original facial model to a frontal pose. The ICP algorithm is an accurate way of aligning two relatively similar point clouds. As ICP will need a large amount of iterations, registering the cropped point cloud to every feasible frontal face will be compu- tationally expensive and time consuming. Instead Mian’s et al. reference face model is used for the point registration and alignment. This reference face was created by scanning and realigning every face in the FRGC and the UWA database. These databases were created using a higher depth resolution camera as the low accuracy Kinect data will provide too many outliers and errors for the reference face. In order to use the reference face in conjunction with the query point cloud, a minimum correspondence is needed for both point clouds. This is done by first placing the nose-tip of the reference face to the centre like the query face(placing the nose-tip point at the origin) and then normalizing the data to span the same minimum and maximum values for all three coordinates of the query facial model. The now normalized reference face and query data point cloud is fed through to the ICP algorithm and will continue to iterate until the user set threshold has been met. The reasoning behind this is that poses that are not full frontal will have certain data points on the face which is rather far from the reference face. To counteract this, the ICP is done in spheres of 15 mm radius starting from the nose tip. A sphere of 15 points radius starting from the nose-tip is necessary because in using the reference face regardless of the portrait view or the frontal view, the nose tip and its surrounding area, the distance between the views however relatively small is important so similarity is still present. The ICP is done six consecutive times while doubling the radius of the sphere where the ICP algorithm occurs and by the fifth time the whole frontal reference face is aligned with the query point cloud. The sixth and final iteration of the ICP algorithm is done to provide completeness of the alignment between the frontal and reference face | ||
| + | Another method of pose correction is to correct the left and right tilting of the head causing misalignment issues. This was only done on the Kinect camera database due to the Eurecom database not having any left or right face tilted subjects. This was pose corrected using the Viola - Jones algorithm to find the angle to rotate the point cloud and through a rotation matrix aligning the query face to a frontal pose. As mentioned above the Viola - Jones algorithm can only detect faces which are frontal and upright. The image with the tilted face is ran through the algorithm and rotated until a face is detected. To improve robustness the algorithm is ran through the detected face with the idea of detecting the eyes, nose, and mouth features. The image is rotated until the face and all of the features are detected. The angle of rotation is then passed along a rotation matrix to transform and rotate the query point cloud. The reference face and pose corrected images are available below. | ||
| + | |||
| + | [[File:Referenceface.jpg]] | ||
| + | [[File:PoseCorrectedEurecom.JPG]] | ||
| + | [[File:PoseCorrectedKinect.JPG]] | ||
| + | |||
| + | ==== Symmetric Filling ==== | ||
| + | Symmetric filling will be done in order to fill any holes or missing data from non-frontal views, specifically the profile posed subjects. The symmetric filling is done by first creating a mirrored point cloud of all the points in the original point cloud but instead with an inverted X values (-X), to then insert into the original point cloud. It is noted that symmetric filling is only done in order to fill up missing data and not to add any further outliers to the data. This was prevented by allowing only a mirrored point to be included into the original point cloud if it is within a certain amount of threshold distance. It was found that if there were any points within 2 geometric points away from each other, the mirrored point is not added into the point cloud. This is the perfect fit as it corresponds to within a 2 mm radius distance on the face. This is because having too large of a threshold may cause the point cloud to be too noisy while too less will not fill up the missing data. Symmetric filling is only necessary for the profile point clouds collected in the Eurecom database. The symmetric filling section is seen below | ||
| + | |||
| + | [[File:SymmetricFilling.JPG]] | ||
| + | |||
| + | |||
| + | |||
| + | === Mesh Fitting and Resampling | ||
| + | The final step in the preprocessing algorithm is to re-sample and fit a mesh on the point cloud data. Re-sampling is done in order to convert the point cloud into a Z axes depth map while also stabilizing the noise in the point cloud data. Another reason is to down-sample the point cloud data into a much smaller output to save time for the facial recognition software as well as to make it less computationally expensive. The resampling was done using a publicly available code gridfit which fits the point cloud data with a smooth mesh using an approximation approach. This algorithm was used due to its ability to set a constraint on how much smoothing is done, as too much smoothing will bend the results of the previous stages while too less smoothing will have noticeable presence of noise and outliers. It also had the ability to change the interpolation method which can reduce additional noise without removing any of important features of the face/ Resampling was also done within the available minimum and maximum X and Y values. This was done in order to align the face to a 2D grid with the X values set as the width and the Y values set as the height of the face. Additionally a background of points was added to the point cloud in order to fully distinguish the edges of the facial model in the depth map. The overall results of this section is summarised on the images underneath. | ||
| + | |||
| + | |||
| + | [[File:FrontKinect.JPG]] | ||
| + | [[File:TiltKinect.JPG]] | ||
| + | [[File:FrontWhole.JPG]] | ||
| + | [[File:LeftWhole.JPG]] | ||
| + | [[File:RightWhole.JPG]] | ||
| + | |||
| + | == Facial recognition from 3D models == | ||
| + | |||
| + | The proposed method for face recognition utilises sparse representation and is designed to be robust under occlusion and different facial expressions. | ||
| + | |||
| + | === Method === | ||
| + | |||
| + | |||
| + | ==== Building Dictionary ==== | ||
| + | A dictionary is built for each subject which is made up of that subject's training samples. These dictionaries can be utilised to identify a test sample by exploiting the assumption, that for each subject, these dictionaries will lie on a linear subspace in order to perform classification. To form the dictionary of a subject, n training samples are collated from the ith subject (or class) and placed in a single matrix A_i. | ||
| + | |||
| + | By using the entire training set to solve for x in the system of linear equations y=Ax, we can obtain a more discriminative classifier than if using `one class at a time' methods. Methods such as PCA project the test samples into another feature space from which they compare the distance between the test sample and each of the training samples. In this method, the entire training set is harnessed to perform classification, rather than just comparing two samples. Not only is this shown to be more discriminative in the results but it enables us to reject any test samples that do not belong to any of the classes within the dictionary. | ||
| + | |||
| + | It has been shown that by solving y=Ax the identity of the test sample can be found, however a method to solve it. The linear system of equations y=Ax is typically found to be undetermined, which means there is no unique solution. The typical method to determine a solution to such a set of equations is by minimising l2-norm solution. | ||
| + | |||
| + | ==== l1-minimisation ==== | ||
| + | |||
| + | Minimising the l2-norm is certainly feasible, however the solution is not sparse and therefore does not identify which of the training samples belong to the class of the test sample. As demonstrated, x0 should be sparse if there are sufficient training subjects, as the only non-zero coefficients in x0 should be those that correspond to the class of the test sample. Therefore by seeking the sparsest possible solution to the linear set of equations, it should be possible to easily determine the class that the test sample belongs to. The sparsest possible solution can be found by minimising the l0-norm. | ||
| + | |||
| + | Although we are unable to solve for l0-norm, minimising the l1-norm should obtain the sparsest possible solution to y=Ax. | ||
| + | [[File:L1 differences2.PNG|thumbnail|upright=4]] | ||
| + | |||
| + | There are a number of different forms of l1-minimisation which can be used to account for occlusion and small dense noise. | ||
| + | === Results === | ||
| + | |||
| + | [[File:Estimated sparse error.PNG|thumbnail|upright=4]] | ||
| + | [[File:Overall block diagram 3dfacerecognition.PNG|thumbnail|upright=4]] | ||
= Project Team = | = Project Team = | ||
| Line 26: | Line 226: | ||
Dr David Booth (DST Group) | Dr David Booth (DST Group) | ||
| + | |||
| + | Sau-Yee Yiu (DST Group) | ||
| + | |||
| + | Philip Stephenson (DST Group) | ||
Latest revision as of 11:57, 30 October 2017
Contents
Introduction
This project seeks to develop a system that is capable of recognising faces captured using commercial off-the-shelf devices. It will be able to capture depth imagery of faces and align them to a common facial pose, before using them to perform recognition. The project will involve elements of literature survey (both sensor hardware and algorithmic techniques), software development (in Matlab), data collection, and performance comparison with existing approaches.
Objectives
Develop a system that is capable of recognizing faces captured using commercial off-the-shelf devices such as the Xbox Kinect.
- Recovery of 3D data from polarimetric imagery
- Recovery of 3D data from Xbox Kinect and alignment to common pose
- Facial recognition from 3D models
3D data from Polarimetry
Method
The method used shall reflect the process that Gurton et al. used in their papers. Surface normals are calculated by applying Fresnel equations to the Kirchoff radiation law and then equating to degree of linear polarisation (DoLP). The surface normal are then integrated using the Frankot-Chellappa method to reconstruct the three-dimensional surface.
Firstly, known absorptivity and reflectivity as well as experimental directional spectral emissivity is input into the Kirchoff radiation law relationship pictured in Equation 1.
Next, DoLP is calculated by applying Fresnel reflection coefficients to the DoLP formula in Equation 2 to get Equation 3.
Where
This is then equated to the experimentally-found values for the DoLP calculated from the Stokes images using Equation 6. The equated function can then be numerically solved by a range of equivalent methods but for computational speed and ease of use, Matlab’s fzero function is implemented. Also important is to take the modulo of theta with pi to ensure correct phase.
The formula for the normal of a surface is given by Equation 7.
From basic trigonometry it is then implied that for this application the partial derivatives are as shown in Equations 7.1 and 7.2.
These partial derivatives show that the magnitude of the normal is given by the tangent of theta, or how close theta is to parallel to the camera’s line of sight and the direction is provided by the real and imaginary components of the azimuthal angle.
Phi is calculated as according to the conditions used in Equation 8. These conditions exist to correct the phase, which is falsely aligned, so that slopes are found in both directions. Again, like the calculations for theta, the modulo of phi with π must be taken to ensure correct values. The limitation of this calculation, is that phi values are only calculated in the range 0 to π whereas, phi, being any direction with a circle, should be of the range 0 to 2 π, meaning that some of the angles are π lower than they should be. There is no equation to calculate with certainty whether or not an angle phi should have π added to it, instead previous papers[13] have used the generally convex nature of the face to apply known values at the edges and then, assuming a relatively smooth surface, iterate inwards adjusting the nearby values if they are outside a threshold when compared to the corrected edge values.
The final step is to integrate the normals using the Frankot-Chellapa method used by Gurton et al. for the reasons of ease and smoothing[13]. For this paper the open source Frankot-Chellappa Matlab code provided by Peter Kovesi[14] as shown in appendix a was used.
Initial Using US A.R.L. Database
The results portrayed in this section are downsampled for purposes of illustration from original 250x200 images in the database to 50x40 arrays. All images are of Subject A in the ARL database and oriented such that the forehead is at the top of the image and chin at the bottom.
As expected, the theta values appear to be highest where the facets of the face are most oblique to the camera whereas flat portions have values close to zero.
Phi values appear rather differently with parts of the face that are changing predominantly in the x axis being blue and those changing predominantly in the y axis being yellow.
The x components of the derivative appear mostly as expected. Note the lack of variation in the y axis as the image is cropped such that the top and bottom of the head, where there most slope is in that axis, are not present. Also note that the values are inverted and there are outliers in the visibly low parts of Fig 7 but mathematically high parts.
The y components of the derivative appear mostly as expected. Note, again, the lack of variation in the y axis as the image is cropped such that the top and bottom of the head, where there most slope is in that axis, are not present. The values are also inverted and there are outliers in the visibly low but mathematically high parts however they are notably less significant than in the x component.
The figure below shows the integral calculated. The face is not visible, instead there are rows and columns of spikes, a peculiar effect of the smoothing effect of the Frankot-Chellappa method. This may be fixed by a combination of changes such as cropping the faces before integrating and doing pre-smoothing of dx and dy to get more consistent magnitudes to prevent smoothing of spikes in dx and dy propagating incorrectly and serving only to raise the magnitude of the column and row they are in.
Frankot-Chellappa Verification
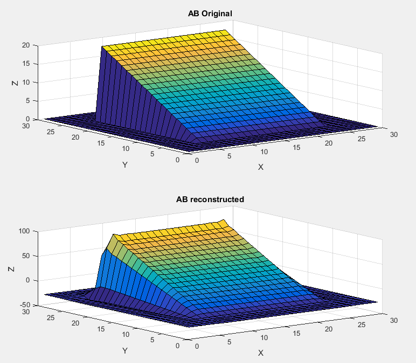
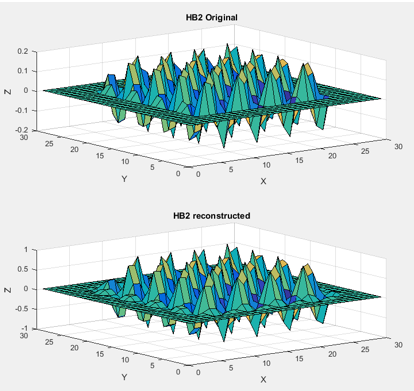
As previous Frankot-Chellappa integral results had provided unexpected outputs and investigation was done to test and verify that Peter Kovesi’s code functioned correctly. This involved the construction of a range of three dimensional surfaces, calculation of their partial derivatives and putting them through the Frankot-Chellappa function. These worked almost immediately, confirming the accuracy of the function though some experimentation was required to sort out some minor issues.
Shown above is the first shape tested with the Frankot-Chellappa function. This shows one major limitation of the Frankot-Chellappa method, that it does not work well for surfaces with large linear components due to the lack of differences in Fourier representation.
As can be seen in the figure above, padding the boundary with zeros fixed the problem of linear surfaces not being constructed. This works because adding the second plane now forces a single Fourier representation of the shape.
Another issue identified with Frankot-Chellappa reconstructions was that large amplitudes towards the corners had a tendency to be mirrored in other corners, albeit with slightly lower amplitude. Again, padding with zeros solved this.
In fact, all surfaces were reconstructed in near-perfection once the zero padding was added, with only minor errors noticeable at the discontinuities between shapes and the zero padding plane. The algorithm was even able to reconstruct relatively complex surfaces such as the two variable sinusoidal peak pattern shown below.
Re-application to US A.R.L. Database
As tests with synthetic surfaces had proven successful with the Frankot-Chellappa code, it was re-integrated back into the program for reconstructing the US A.R.L. images. At this point integrals started being calculated correctly, suggesting that there had been a simple error made somewhere in the code implementing Peter Kovesi’s function. Despite the integrals now looking as though they were plausible, reconstructions of the provided information, the surfaces were not accurately depicting the subjects’ faces. This demonstrated errors in the calculation of earlier components, namely the angles theta and phi.
Code review identified a number of potential sources of the errors visible in the reconstruction. One such error was that the DoLP values being used in the calculation of theta which were not being correctly normalised for a 16 bit integer and were also too high a magnitude, having been normalised by the camera, and as such had to be multiplied by another coefficient, nominally 0.04, to bring the values into a reasonable range. This value was provided by a trained LWIR camera operator and was based off their experience. There was also an issue with the numerical solving function, fsolve, not finding solutions for theta at all points. This was rectified by detecting the error flag output and if a solution was not found, simply using the previous pixel’s theta value as an approximation.
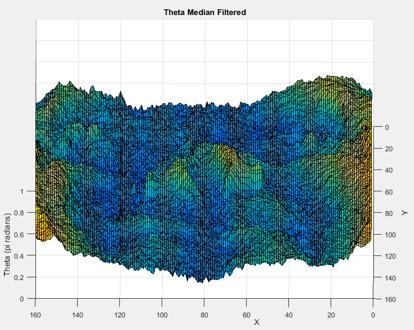
The theta values shown look like those calculated previously but have considerable noise, which should not be present for a relatively smooth human face so median filtering the values was tested, the result of which is illustrated below.
With reasonable values of theta calculated, phi could be found from them. Phi values also looked acceptable, other than a significant outlier in the middle of Subject A’s face which was solved by median filtering as used to control noise in theta values. The filtered values of phi are provided below.
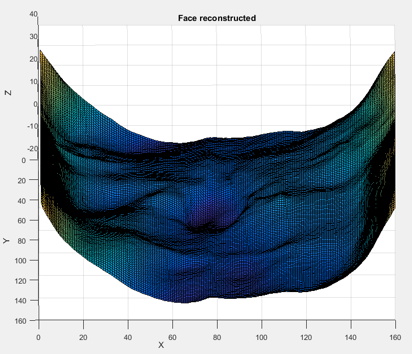
From theta and phi, the partial derivatives were calculated and the integral done again, the results of which are shown below.
As is visible in above, a face shape was becoming visible, a major improvement from the spiky grid shown at the start that had resulted previously. The partial reconstruction with a portion ‘missing’ or smoothed out immediately suggests a frequency or phase having been calculated incorrectly. The spikes in the previous reconstruction are thought to have been due to theta and phi being of inverted forms what they should have been and the modulo bounding the magnitudes causing significant spike components.
Working backwards in the analysis of where the code had gone wrong it was noticed that the partial derivatives were symmetric as they should not have been for a convex shape. The partial derivative of a cylinder, a rough analogy for a face, in x and y in respect to one variable should be positive on one side and negative on the other. Another concern was that downsampling may have been adding discontinuities affecting the frequency representation of the surface and so, to minimise this, images were used at their native resolution though cropped tighter to the facial area for both computational speed and ease of analysis. Without this the drop to a flat background surrounding the faces in the databases’ images exhibited some bending and undulation that should not have been present.
The angle phi determines what direction the derivative goes in and as such it was determined that the error must have come from there. After going back to existing papers on the topic it was realised that the calculation for phi has an ambiguity of exactly pi. The range of phi is from 0 to 2π however the calculation to get phi only provides answers from 0 to π. It is therefore necessary to correct some values by applying known boundary conditions, e.g. that the right side of the face should have vectors pointing towards the right and thus be close to 0 to 2 π. Similarly, the top should have vectors pointing upwards towards π/2, the left towards π and the bottom towards 3π/2. The method used by Yuffa et al. was to apply these known conditions to the boundaries of the data and then correct nearby values to whichever of the phi or phi + π was closest to the known value next to it. This is continued from the edges inwards towards the centre until all values have been corrected.
An attempt to implement a similar algorithm to correct phi was attempted but, due to time constraints, not completed. Estimates of the correct partial derivatives were calculated by simply reversing the sign of half of each derivative, in the y axis for dx values and in the x axis for dy values, and then shifting them so they meet the original values. This resulted in the far more accurate and detailed face reconstruction shown in above.
This face is another large improvement on the previous reconstruction though still not ideal. In particular, the noticeable effects of a discontinuity can be seen from the top to the bottom down the middle of the face. It was hoped that this discontinuity would be improved by smoothing the partial derivatives however the integration is not significantly improved. This is likely due to the filter window being too small to cover the indentation at the discontinuity. While a larger windowed filter may be able to remove this valley, excessive use of post-processing would only serve to remove discriminative features present in the faces required for facial recognition applications.
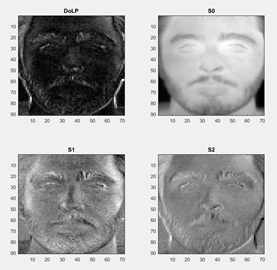
We also gained access to a high quality IR camera that enabled us to take our own polarimetric images shown above. Unfortunately, these were not suitable for use with the existing algorithm due to relatively high noise preventing the numerical solver from calculating values.
3D data from Xbox Kinect and Pre-processing
This section involves the creation of the software responsible for interfacing the newest Kinect camera (Kinect V2) hardware with MATLAB software on a computer. It included the canonical preprocessing techniques done from the 3D depth point cloud data resulting to a 3D facial image aligned to a frontal view pose for face recognition.
Method & Results
Kinect and Eurecom Database Interface
The acquisition of the image using the Kinect V2 was done first through connecting the Kinect camera with the MATLAB software. The subject was set up to have a distance no further than 1 metre away from the camera. The reasoning behind this is to allow the depth resolution to work around the 1.5mm depth resolution accuracy of a Kinect Camera. The image acquisition toolbox present in Matlab allows the user to acquire three sets of possible data, a 2D RGB image, a grayscale depth map or a RGB-D point cloud. This thesis worked with the RGB-D point cloud to be consistent with the data acquired from the available database. An added bonus is that Matlab has already aligned the coloured image with its subsequent grayscale point cloud and thus preventing any misalignment issues presented by the difference in camera locations. The figure below displays the result of the image acquisition step for the Kinect camera

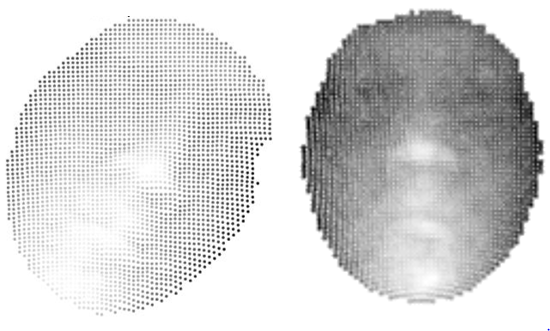
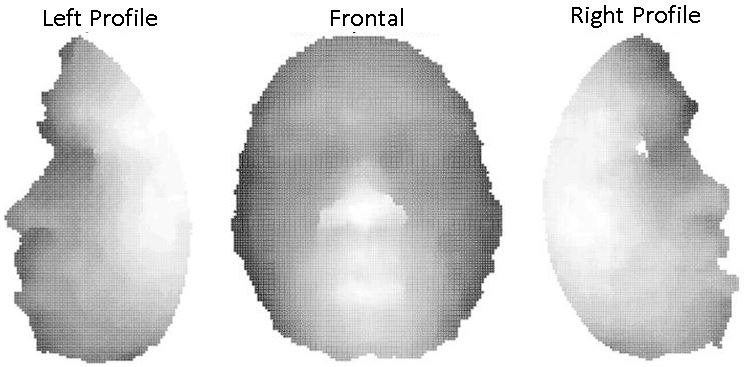
The Eurecom database was used as it already provides the array for the creation of point clouds with each subject and is the current database used for the facial recognition software. Another reason is due to the point cloud already been processed in a way that the background and any possible outliers from the front of the subject have been separated from the needed point cloud which in this case is the person being captured. The image below shows the three different poses the subjects mad which shows the initial processing done on the database already. The yellow and blue areas from the image of the point cloud represents the outliers, both the background and the frontal outliers. The main area of work is the green shaded area of the point cloud. The interface is currently working with images with no major occlusions, however eyeglasses are an exception. The reasoning behind this is to allow the nose-tip detection and face cropping stages described ahead with relative ease.

Nose Tip Detection
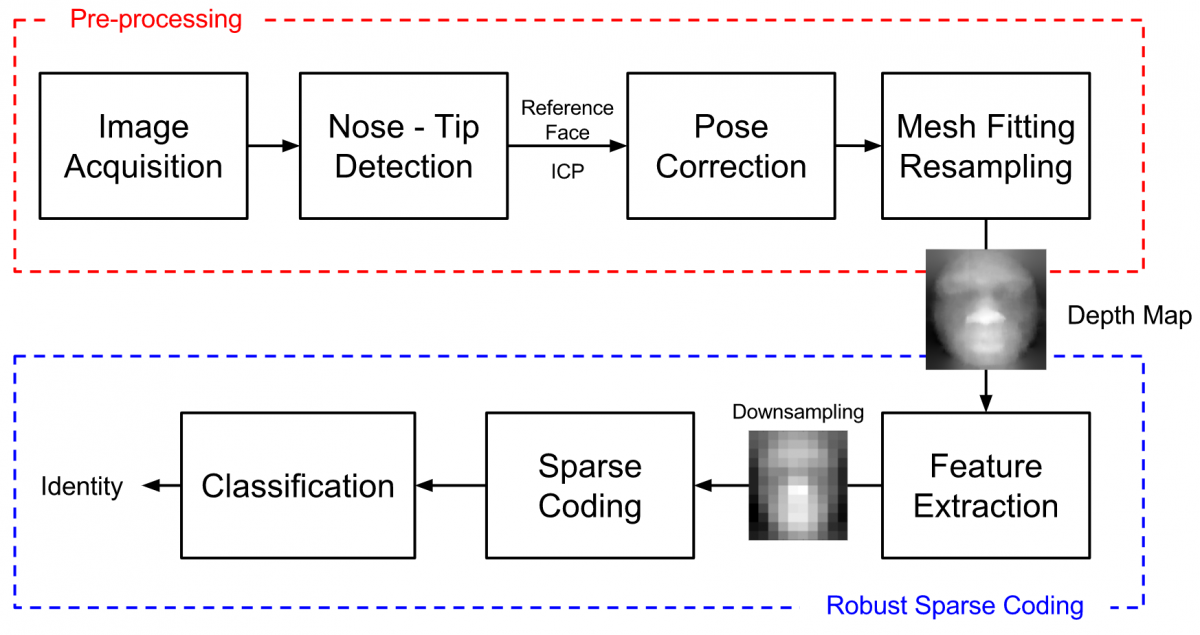
Nose-tip detection for the point cloud acquired from the Kinect data is fully automatic. It is done through the use of the Viola - Jones algorithm. The algorithm uses the already aligned coloured image to detect the face initially. The image is cropped on the detected face and is put through Viola - Jones again to acquire the nose of the face. This reduces the incidence of false detection and improves the accuracy of the nose-tip detection. The point cloud is then cropped depending on the detected nose, and the closest point to the camera is selected as the nose-tip. Although, this way of nose-tip detection may provide only a rough location of the nose-tip, the nose-tip point is only needed for the purpose of a finding a rough centre point of the face for face cropping. The subsequent face cropping algorithm is robust enough that it will work as long as the nose-tip detected is within a few points from the actual nose - tip.Due to the Viola - Jones algorithm not working for tilted heads, the detection for tilted head is done by first rotating the image point cloud until a face is detected. To improve robustness the algorithm also checks if the other necessary features which is needed for the face cropping is detected. As the location of the head has barely changed with the rotation of the image it is assumed that the rotated image detected face is at the same place as the tilted head and that the nose tip is within the same area as the nose point cloud. The figures below summarizes the steps in determining the nose tip point for the Kinect camera both with frontal and tilted heads.
With outliers and the background already removed from the point cloud acquired from the database an automatic nose-tip method can be done albeit a little different with the Kinect camera captured data. One of the major issues is the misalignment of the coloured images present in the database compared to the point cloud data and thus the same method is not viable. Nose-tip detection is done by utilizing the vertical facial symmetry of the average human face, by first finding the closest points to the camera for frontal poses or by finding the smallest or largest point values in X depending on left or right pose and creating a histogram with Y values. This is followed by disregarding points not around the middle section of the head and allowing only points that are within two thirds distance from the centre. The correct nose tip is determined by choosing the closest point to the camera for frontal poses or the leftmost or rightmost point of the face for profile photos within the now enclosed area. The two thirds distance leeway is to account for any additional outlier such as beards or glasses and also for any additional pose differences that has not been taken into account. This method is highlighted by figure underneath.
3D Face Cropping
The point cloud is put through a face cropping algorithm which only includes the important features such as the eyes, nose and the mouth while also removing the hair and ears from the point cloud system. The algorithm is initialized by assuming that the nose tip is at the center of the face. This is also necessary for the canonical preprocessing techniques especially the symmetric filling section. This is done by putting the nose-tip point acquired on the previous step and normalizing the X and Y values of the point cloud to place the nose tip on the origin point, while leaving the depth data untouched. The radius of the cropping is set up so that it will remove the ears, the neck and any excess hair collected from the top of the head leaving only a section of the forehead, eyes nose, mouth and a section of the chin.
The Eurecom database had all of the subjects at a same distance from the camera for all of the photos and for each session. This meant that the radius for the face cropping was consistent enough and the same throughout the whole database. The radius was selected through a trial and error basis, and the optimal radius was found to be along 80 geometric points from the nose-tip detected. The Kinect camera on the other hand did not have this luxury. Instead the Viola Jones algorithm is adjusted to find additional features, not only the nose. When possible, the eyes and the mouth were also located. Using the vertical facial symmetry of an average face and the cropped point clouds specific to the mouth, nose and the eyes, the radius of the face is found even with varying distances from the Kinect camera. The point cloud is also arranged in the order to which the width of the face is along the X axes, and the height of the face on the Y. The results are seen underneath.
Pose Correction
Pose correction is done using non-rigid ICP algorithm. Using the ICP algorithm will cor- rect the pose of the original facial model to a frontal pose. The ICP algorithm is an accurate way of aligning two relatively similar point clouds. As ICP will need a large amount of iterations, registering the cropped point cloud to every feasible frontal face will be compu- tationally expensive and time consuming. Instead Mian’s et al. reference face model is used for the point registration and alignment. This reference face was created by scanning and realigning every face in the FRGC and the UWA database. These databases were created using a higher depth resolution camera as the low accuracy Kinect data will provide too many outliers and errors for the reference face. In order to use the reference face in conjunction with the query point cloud, a minimum correspondence is needed for both point clouds. This is done by first placing the nose-tip of the reference face to the centre like the query face(placing the nose-tip point at the origin) and then normalizing the data to span the same minimum and maximum values for all three coordinates of the query facial model. The now normalized reference face and query data point cloud is fed through to the ICP algorithm and will continue to iterate until the user set threshold has been met. The reasoning behind this is that poses that are not full frontal will have certain data points on the face which is rather far from the reference face. To counteract this, the ICP is done in spheres of 15 mm radius starting from the nose tip. A sphere of 15 points radius starting from the nose-tip is necessary because in using the reference face regardless of the portrait view or the frontal view, the nose tip and its surrounding area, the distance between the views however relatively small is important so similarity is still present. The ICP is done six consecutive times while doubling the radius of the sphere where the ICP algorithm occurs and by the fifth time the whole frontal reference face is aligned with the query point cloud. The sixth and final iteration of the ICP algorithm is done to provide completeness of the alignment between the frontal and reference face Another method of pose correction is to correct the left and right tilting of the head causing misalignment issues. This was only done on the Kinect camera database due to the Eurecom database not having any left or right face tilted subjects. This was pose corrected using the Viola - Jones algorithm to find the angle to rotate the point cloud and through a rotation matrix aligning the query face to a frontal pose. As mentioned above the Viola - Jones algorithm can only detect faces which are frontal and upright. The image with the tilted face is ran through the algorithm and rotated until a face is detected. To improve robustness the algorithm is ran through the detected face with the idea of detecting the eyes, nose, and mouth features. The image is rotated until the face and all of the features are detected. The angle of rotation is then passed along a rotation matrix to transform and rotate the query point cloud. The reference face and pose corrected images are available below.
Symmetric Filling
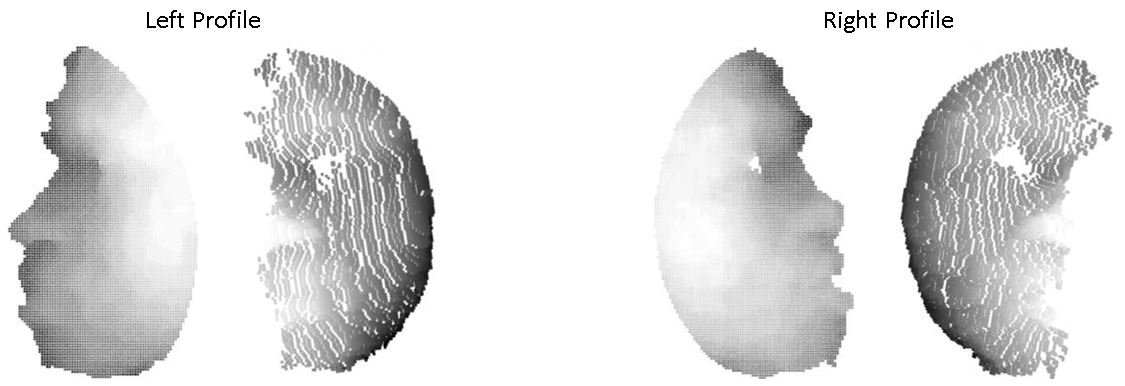
Symmetric filling will be done in order to fill any holes or missing data from non-frontal views, specifically the profile posed subjects. The symmetric filling is done by first creating a mirrored point cloud of all the points in the original point cloud but instead with an inverted X values (-X), to then insert into the original point cloud. It is noted that symmetric filling is only done in order to fill up missing data and not to add any further outliers to the data. This was prevented by allowing only a mirrored point to be included into the original point cloud if it is within a certain amount of threshold distance. It was found that if there were any points within 2 geometric points away from each other, the mirrored point is not added into the point cloud. This is the perfect fit as it corresponds to within a 2 mm radius distance on the face. This is because having too large of a threshold may cause the point cloud to be too noisy while too less will not fill up the missing data. Symmetric filling is only necessary for the profile point clouds collected in the Eurecom database. The symmetric filling section is seen below
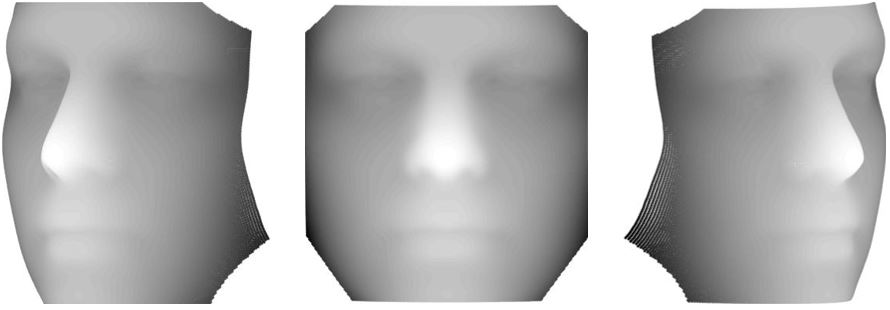
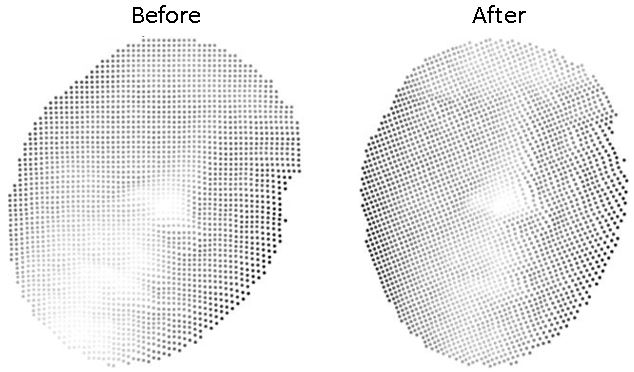
=== Mesh Fitting and Resampling The final step in the preprocessing algorithm is to re-sample and fit a mesh on the point cloud data. Re-sampling is done in order to convert the point cloud into a Z axes depth map while also stabilizing the noise in the point cloud data. Another reason is to down-sample the point cloud data into a much smaller output to save time for the facial recognition software as well as to make it less computationally expensive. The resampling was done using a publicly available code gridfit which fits the point cloud data with a smooth mesh using an approximation approach. This algorithm was used due to its ability to set a constraint on how much smoothing is done, as too much smoothing will bend the results of the previous stages while too less smoothing will have noticeable presence of noise and outliers. It also had the ability to change the interpolation method which can reduce additional noise without removing any of important features of the face/ Resampling was also done within the available minimum and maximum X and Y values. This was done in order to align the face to a 2D grid with the X values set as the width and the Y values set as the height of the face. Additionally a background of points was added to the point cloud in order to fully distinguish the edges of the facial model in the depth map. The overall results of this section is summarised on the images underneath.
Facial recognition from 3D models
The proposed method for face recognition utilises sparse representation and is designed to be robust under occlusion and different facial expressions.
Method
Building Dictionary
A dictionary is built for each subject which is made up of that subject's training samples. These dictionaries can be utilised to identify a test sample by exploiting the assumption, that for each subject, these dictionaries will lie on a linear subspace in order to perform classification. To form the dictionary of a subject, n training samples are collated from the ith subject (or class) and placed in a single matrix A_i.
By using the entire training set to solve for x in the system of linear equations y=Ax, we can obtain a more discriminative classifier than if using `one class at a time' methods. Methods such as PCA project the test samples into another feature space from which they compare the distance between the test sample and each of the training samples. In this method, the entire training set is harnessed to perform classification, rather than just comparing two samples. Not only is this shown to be more discriminative in the results but it enables us to reject any test samples that do not belong to any of the classes within the dictionary.
It has been shown that by solving y=Ax the identity of the test sample can be found, however a method to solve it. The linear system of equations y=Ax is typically found to be undetermined, which means there is no unique solution. The typical method to determine a solution to such a set of equations is by minimising l2-norm solution.
l1-minimisation
Minimising the l2-norm is certainly feasible, however the solution is not sparse and therefore does not identify which of the training samples belong to the class of the test sample. As demonstrated, x0 should be sparse if there are sufficient training subjects, as the only non-zero coefficients in x0 should be those that correspond to the class of the test sample. Therefore by seeking the sparsest possible solution to the linear set of equations, it should be possible to easily determine the class that the test sample belongs to. The sparsest possible solution can be found by minimising the l0-norm.
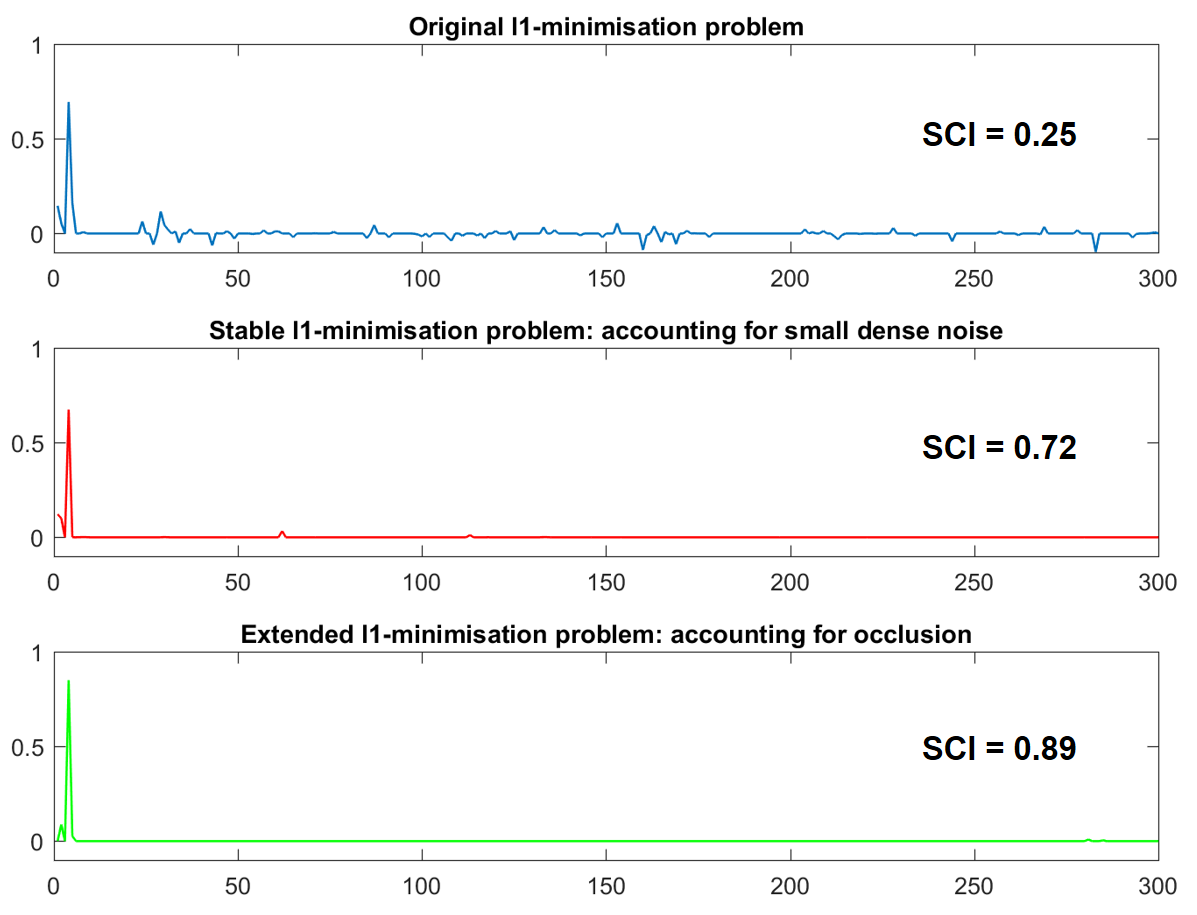
Although we are unable to solve for l0-norm, minimising the l1-norm should obtain the sparsest possible solution to y=Ax.
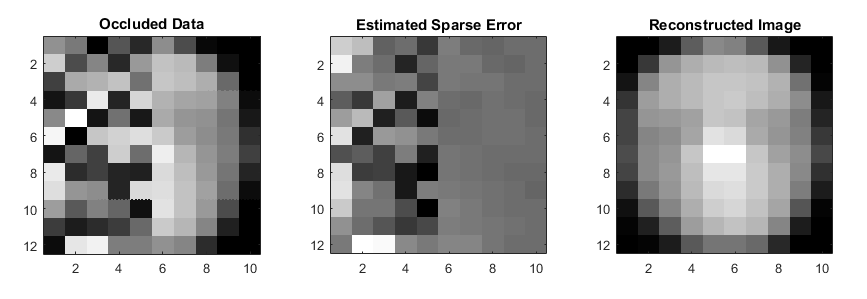
There are a number of different forms of l1-minimisation which can be used to account for occlusion and small dense noise.
Results
Project Team
Jesse Willsmore
Orbille Piol
Michael Sadler
Supervisors
Dr Brian Ng
Dr David Booth (DST Group)
Sau-Yee Yiu (DST Group)
Philip Stephenson (DST Group)

