Difference between revisions of "Projects:2018s1-116 Data Analytics"
| Line 46: | Line 46: | ||
computer system | computer system | ||
| − | [[File:System_v3 |frame|center| Complete system diagram]] | + | [[File:System_v3.png |frame|center| Complete system diagram]] |
= Model Development = | = Model Development = | ||
| Line 78: | Line 78: | ||
The Dense (Distance) format follows the same principle as the Dense (Time) format, however rather than encoding latitude and longitude, it encodes the distance and angle from the airport in the z axis. | The Dense (Distance) format follows the same principle as the Dense (Time) format, however rather than encoding latitude and longitude, it encodes the distance and angle from the airport in the z axis. | ||
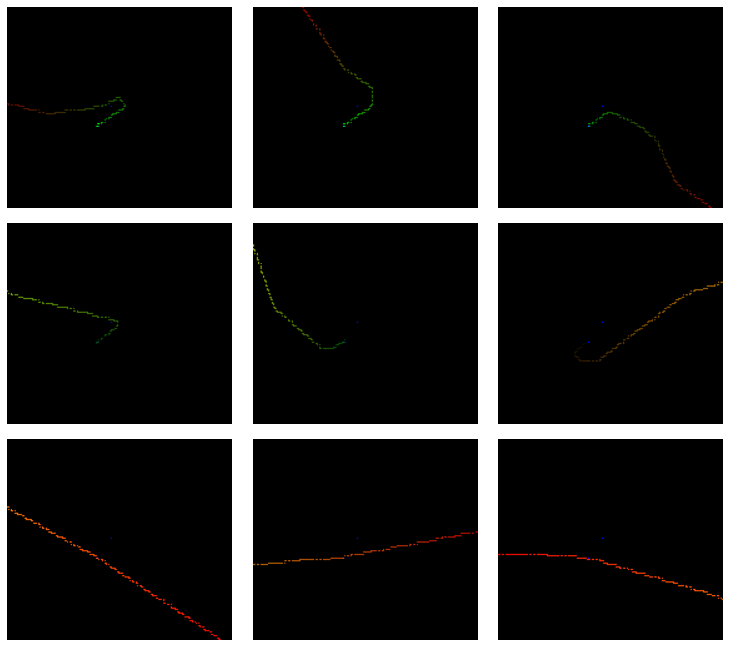
| − | [[File:data-graphic |frame|center| Graphic data representation. 1st row: arrivals, 2nd row: departures, 3rd row: passing through. The red channel encodes altitude, the green channel encodes time, latitude and longitude are encoded in x and y coordinates.]] | + | [[File:data-graphic.png |frame|center| Graphic data representation. 1st row: arrivals, 2nd row: departures, 3rd row: passing through. The red channel encodes altitude, the green channel encodes time, latitude and longitude are encoded in x and y coordinates.]] |
== CNN Training == | == CNN Training == | ||
Revision as of 02:48, 22 October 2018
Contents
Project Team
- Liam Flaherty
Project Supervisors
- Dr. Hong Gunn Chew
- Prof. Lang White
- Ms. Natalie Harris (Boeing Defence Australia)
Introduction
ADS-B (Automatic Dependent Surveillance Broadcast) is an increasingly used system for tracking aircraft and can be used for the purpose of air traffic management. It is a system by which aircraft transmit information regarding their identification and aircraft state, including positional and speed information. This information can be used to make informed decisions related to aircraft control to increase efficiency and safety of air travel. If an aircraft is exhibiting unexpected or dangerous behaviour, operators can intervene. Examples of this behaviour include malicious intent, aircraft malfunction, and pilot error, all of which can result in an aircraft deviating from usual operation and posing a potential risk.
In addition, the transmission of ADS-B data is voluntary and unencrypted. This makes it especially vulnerable to spoofing attacks and tampering. In this instance, a spoofing attack consists of injecting false data into the system in order to degrade the system's performance. An example of such an attack is fabricating a bogus aircraft to interfere with the flights of other aircraft, despite its lack of existence. This is possible due to the nature of ADS-B being voluntary, unencrypted, and lacking in authentication. This example could engage collision avoidance algorithms in order to save the real aircraft, but would just lead to flight performance degradation. Once this data is injected into the system, it is difficult to identify bogus data.
These two issues are the focus of this project. This project aims to develop a machine learning system which can automatically determine anomalies in air tracks, where an anomaly falls under one of the above definitions. The approach for the project is to take a number of different models which learn different pieces of information about legitimate aircraft in order to extract possible anomalous features from the current airspace. These conclusions can be used to assist operators in monitoring the airspace by highlighting potential anomalies or verifying legitimate aircraft and removing them from consideration.
Proposed System
The proposed system takes the overall objective of classifying anomalies, and breaks the issue into smaller classifiers. These classifiers can take various forms, and will be discussed further in the Model Development section.
The complete system diagram is shown below, with the tree main categories begin:
- Data loading and pre-processing
- Prediction models
- User Interface
Data loading and pre-processing is a requirement of any system which incorporates data models. While this is a relatively simple module, it is critical to operation. The UI module is useful to operate the system once developed, and would be critical for an operator’s use, but is of less importance to this project. The main focus of this project is the learning models which explore how the system produces its anomaly conclusions.
The “learning models”, which is the primary focus of this project, is split into two categories: the data model, and the anomaly analysis. The data model serves as a block that learns the patterns exhibited by regular and non-anomalous flight patterns. This model will take flight data and match to some label or cluster learnt on usual data. The anomaly analysis block analyses how effectively the data model block has fit the flight data to the label or cluster. A poor “fit” would be flagged as a potential anomaly, which could be investigated further (and as such, is sent to the Display module within the UI for a human to investigate further). It is acceptable to keep a human (via the UI) within his loop as the project aims to improve the efficiency by automating the anomaly detection task, but not to have a closed computer system
Model Development
The purpose of this intent classification model is to take the any particular flight track within the target region and the track data for its time flying through the observed area (i.e. the current position and the tail of all previous positions), and produce an estimate of the flight’s “intent”. The intent of the flight is the end outcome for aircraft’s flight track within that airspace and is defined as one of the three labels: arrival, departure, and passing through.
Label Generation
While the dataset includes a large range of data, the classes that this particular classifier is estimating are not included, so these labels will need to be generated. To do this, a set of rules is established using the entire track data (note that part of the classification task uses partial tracks).
Firstly, the operator listed for the ADS-B data must be within a dictionary of known commercial operators as this project restricts the scope to commercial aircraft. The first and last n samples of the track are examined. If the first n is above an altitude threshold and the last n are below, it is classed as an arrival. Having the first n samples below, and the last n samples above the threshold is classed as a departure and having both the first and last n samples above this threshold gets labelled as a passing through flight. The automatically generated labels are manually inspected for correctness with manual adjustments made where necessary.
CNN Input Formatting
The format in which data is passed to the learning models requires consideration. The raw data for a single training example feature consists of a list of entries of vectors containing latitude, longitude, altitude, and time. This format is not suitable for the CNN (or the initial SVM test). The data must be transformed into a form which is compatible with the CNN, and harnesses its strength of graphic recognition. CNNs excel in graphic recognition problems, a property which is exploited here by converting the flight data into a graphic format.
There are several formats used within the project,
- Graphic
- Dense (Time)
- Dense (Distance)
For the graphic dataset, the first input format considered takes the flight track and converts this to a visual example of the flight. That is, the x and y coordinates directly correspond to the latitude and longitude of the aircraft, and the samples over time are all added to the picture for their given locations. The altitude and time are encoded into the z axis of the matrices/images.
The graphic format does not scale well to larger areas and has low memory efficiency, so the dense formats are developed. The dense format is still a matrix which is passed to the CNN as an image, however it acts more as a buffer for each flight track sample, which each pixel storing a sample. The samples are inserted into the matrix from the top left entry, working right for each new sample received, and wrapping to the next row at the far end of the matrix. I.e. the x axis of the image is the buffer index (which corresponds to the sample time in a non-uniform way), wrapped into the y axis to create a square matrix. The z axis encodes the latitude, longitude, altitude, and time data.
The Dense (Distance) format follows the same principle as the Dense (Time) format, however rather than encoding latitude and longitude, it encodes the distance and angle from the airport in the z axis.
CNN Training
A VGG16 Convolutional Neural Network is trained on the training set of the data to pick from one of the labels: arrival, departure, or passing through. The data used is the Dense (Distance) format generated on the flight data taken from an area over Adelaide with a diagonal distance of 900km. This is trained for 200 epochs.
Output analysis
The output scores of the CNN can be analysed to determine whether the classification is confident, or whether the classification scores indicate that none of the three labels were observed in the flight data – leading to an anomaly.
The confidence measure is calculated by finding mean and standard deviation values for each of the CNN score values for each different prediction case. When a new flight is passed through the CNN, a new set of scores is obtained. These scores are then compared to the mean, and the distance (in terms of a number of standard deviations) is used to establish confidence.
A further extension of this is to create a region around 0. If the scores for all three labels sits within this region, then it can be assumed (if the size of the region is set correctly) that the input did not correlate strongly with any of the target labels which indicates that the flight track is an anomaly.
Results
Intent Classification
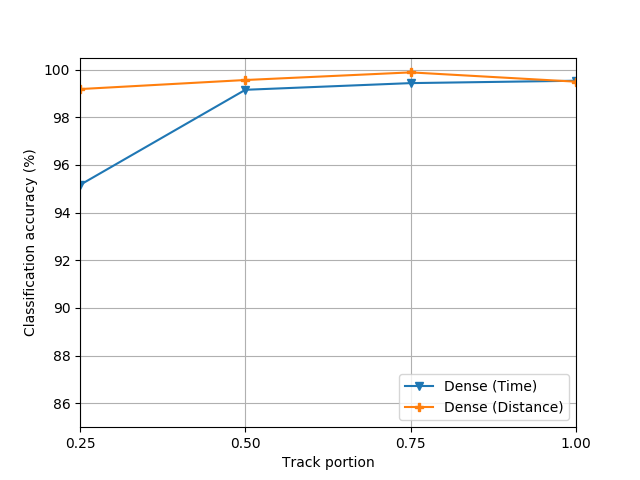
The CNN was trained on partial tracks to allow the model to predict the intent of flights whose full tracks are not available. I.e. in a live application where the monitoring tool is observing a flight in progress. The graph below shows the accuracy of the CNN for both the Dense (Time) and Dense (Distance) input formats. The distance based representation maintains a 99.2% to 99.9% accuracy through the various track portions, whereas the time based representation drops to 95% accuracy for small track portions.
Anomaly Detection
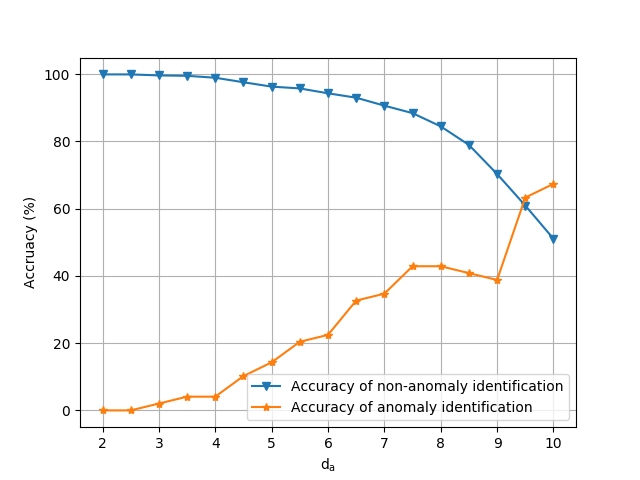
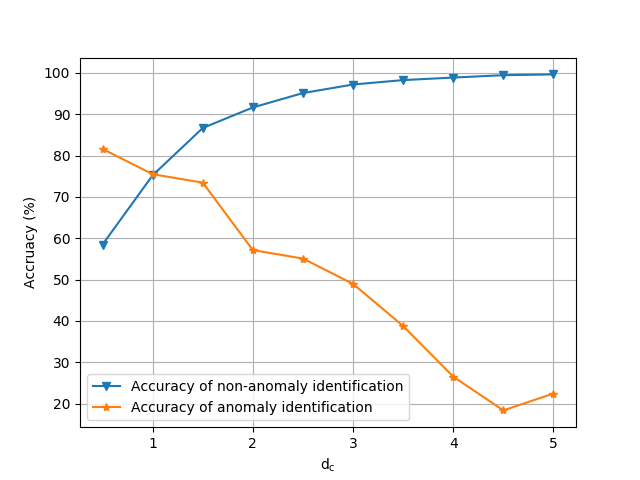
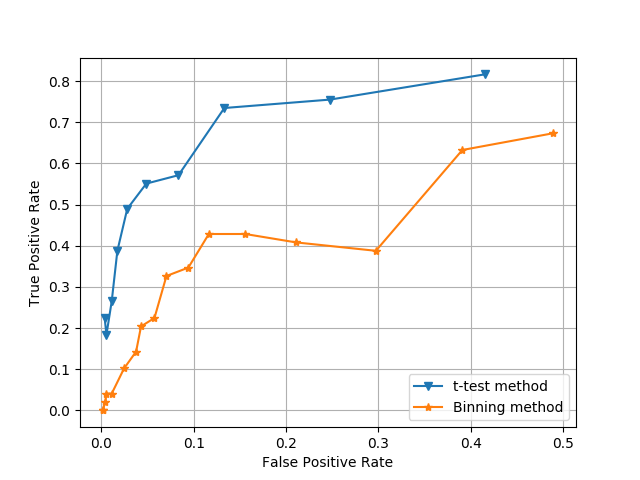
The two methods used to classify anomalies is the binning method (as discussed above), and making the assumption that a low confidence estimation is an anomaly (this is referred to the “t-test method” here). Shown below are the graphs showing their true positive and false positive curves as their tuning parameter is adjusted. Also shown is a ROC graph to directly compare the two methods.
The better method (the t-test method) yields a 75.5% performance at the “optimal” tuning parameter value.

