Difference between revisions of "File:AvgHIperSeason02.png"
(A1706601 uploaded a new version of File:AvgHIperSeason02.png) |
(A1706601 uploaded a new version of File:AvgHIperSeason02.png) |
(No difference)
| |
Revision as of 10:58, 20 October 2020
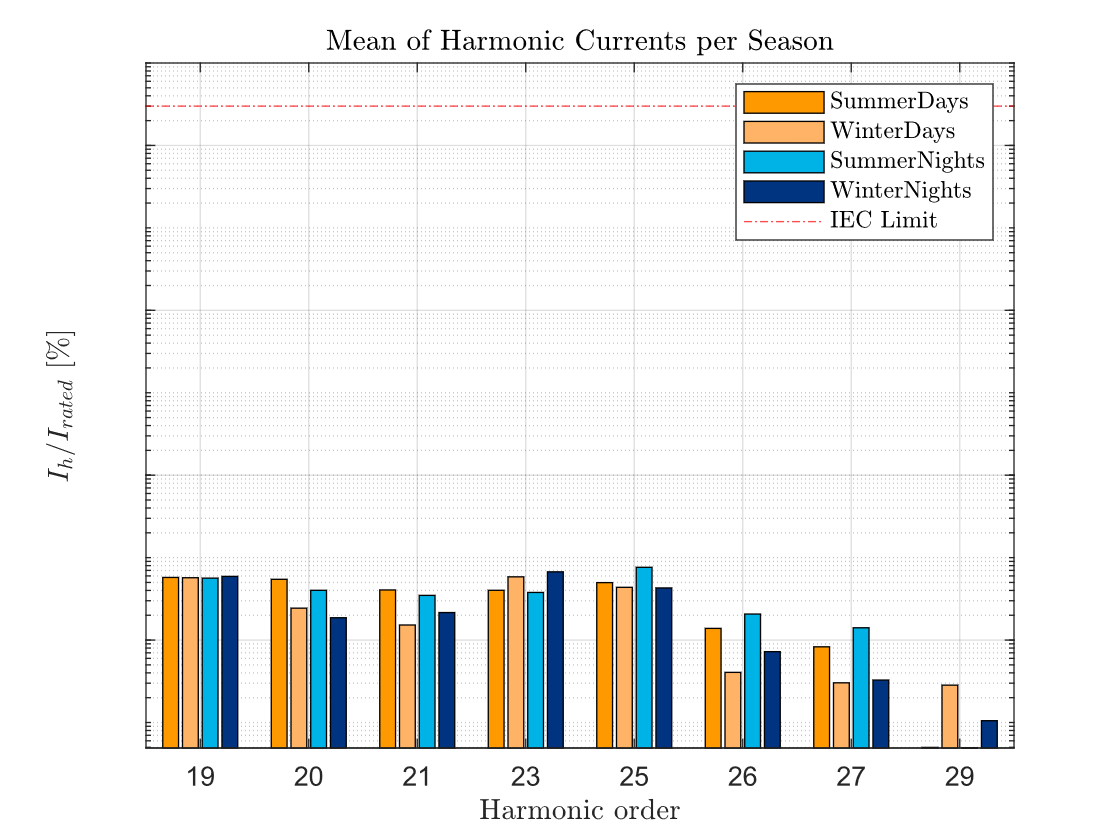
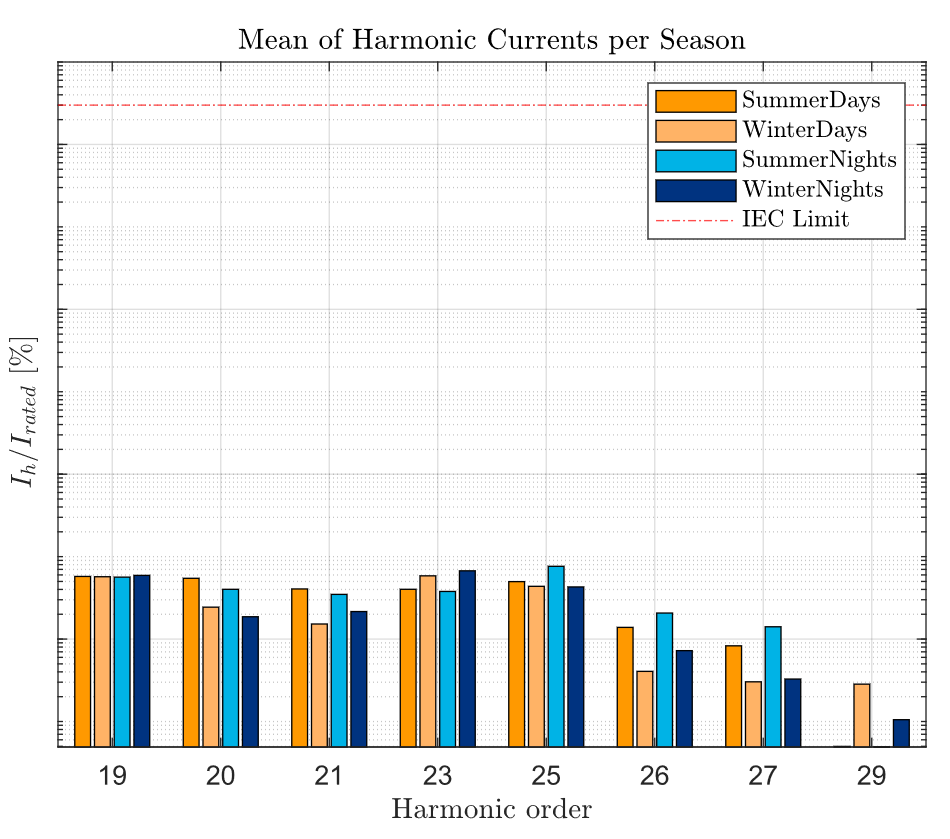
Plot of average harmonic TDD seen at the transmission transformer per month for winter, summer, day and night.
File history
Click on a date/time to view the file as it appeared at that time.
| Date/Time | Thumbnail | Dimensions | User | Comment | |
|---|---|---|---|---|---|
| current | 10:59, 20 October 2020 | Error creating thumbnail: Unable to save thumbnail to destination | 950 × 839 (54 KB) | A1706601 (talk | contribs) | Reverted to version as of 11:58, 20 October 2020 (ACDT) |
| 10:59, 20 October 2020 | Error creating thumbnail: Unable to save thumbnail to destination | 1,120 × 840 (57 KB) | A1706601 (talk | contribs) | Reverted to version as of 11:53, 20 October 2020 (ACDT) | |
| 10:58, 20 October 2020 | Error creating thumbnail: Unable to save thumbnail to destination | 950 × 839 (54 KB) | A1706601 (talk | contribs) | ||
| 10:53, 20 October 2020 | Error creating thumbnail: Unable to save thumbnail to destination | 1,120 × 840 (57 KB) | A1706601 (talk | contribs) | ||
| 12:17, 12 October 2020 | Error creating thumbnail: Unable to save thumbnail to destination | 1,120 × 840 (60 KB) | A1706601 (talk | contribs) |
- You cannot overwrite this file.
File usage
The following page links to this file: