Difference between revisions of "Projects:2015s1-58 Design And Development Of A New Respiratory Monitor For Detection Of Sleep Apnoea"
(→Conclusion) |
|||
| Line 113: | Line 113: | ||
• Design plan of a monitor prototype: a preliminary design plan is put forward for the further integration of the algorithm with the data acquisition hardware. | • Design plan of a monitor prototype: a preliminary design plan is put forward for the further integration of the algorithm with the data acquisition hardware. | ||
| + | |||
| + | == Future Work == | ||
| + | The ultimate target of the project is to produce a physical monitor prototype with practical diagnosis value for implementation of sleep apnea detection in medical institutions. | ||
| + | |||
| + | Due to the limitations of time and manpower, the group is not able to complete the work on both software programming and hardware construction. | ||
| + | |||
| + | There is potential that could be implemented by future project groups. These include: | ||
| + | |||
| + | • Algorithm improvement: | ||
| + | |||
| + | As mentioned in the introduction, sleep apnea is classified into three types according to different cause mechanism, but at this stage, the classification work has not been considered. It might be advantageous to assess the features of some other signal channels (i.e. ECG, SaO2 etc.) in apnea period to extract the indication used to classify sleep apnea events. | ||
| + | |||
| + | • Decline of the false positive rate: | ||
| + | |||
| + | The drawback of the presented detection algorithm is the presence of false positive detections, which has a adverse effect on the accuracy. There is a need to consider an approach to lower the false positive rate. This issue could be achieved by employing a new indicator to have a more strict restriction in detection. | ||
| + | |||
| + | • Software and hardware integration: | ||
| + | |||
| + | The next stage in the process would be to turn this detection algorithm into actual hardware and a physical monitor is expected to be constructed by future groups. Some issues worth mentioning include the sensor selection (i.e. specifications of the sensor, resolution, I/O voltage, sampling frequency etc.), interface where the program and hardware interact and budget control. | ||
== References == | == References == | ||
Revision as of 10:34, 22 October 2015
Contents
Introduction
The ultimate aim of this project is to develop a respiratory monitor prototype for detection of sleep apnea. It is hoped that the prototype will eventually achieve the real-time monitoring of the patient’s sleep state and record the information of sleep apnea events.
In this academic year, the work on detection algorithm has been accomplished and a design plan to construct a physical monitor has been established for the future groups.
Supervisor
Dr. Said Al-Sarawi
Co-supervisors
Prof. Jagan Mazumdar
Dr. Cleto Mernone
Students
Jian Shi
Sandeep Singh
Background Information
Sleep apnea is a kind of sleep disorder that is characterized with suspension in breathing during sleep. Each interruption, called as an apnea interval, can last from ten seconds to several minutes.
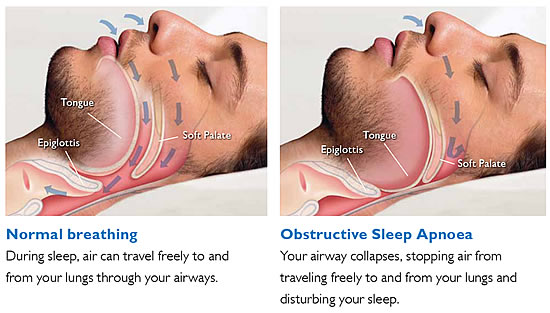
Apneic events can be classified according to the nature of the underlying physiological cause. Central Sleep Apnea (CSA) is usually caused by the absence of correct signals from brain areas in charge of breathing to the relevant muscles and a normal breathing action cannot be implemented. Obstructive Sleep Apnea (OSA) is much likely to happen when the patient’s pharyngeal narrows or the upper airway collapses during sleep. The complex or mixed type of sleep apnea is a mix of CSA and OSA.
The latest research result illustrates that central sleep apnea is the most common type with a percentage 80%.
The below figure is an illustration of the cause mechanism of OSA.
Motivation
Regardless of type, an individual with sleep apnea suffers from difficulty of breathing during sleep, which leads to detrimental effects on sleep-quality and health. Some typical consequences of sleep apnea to the patient are as follows [7].
• High blood pressure
• Stroke
• Heart failure, heart attack or irregular heart beats
• Depression and lack of concentration in daytime
It is quite difficult to exactly specify how many Australians suffer from sleep apnea. It is generally thought that approximately 9% of women and 25% of men in Australia have clinically significant sleep apnea and 4% of men and women have symptomatic sleep apnea [5].
Due to the serious effects of sleep apnea and the enormous quantity of patients, the medical and health professions have been seeking for reliable sleep apnea detection and therapy approach in recent decades.
Fundamentally, the development of a sleep apnea monitor is extremely helpful to fill some gaps in the research of sleep apnea and make a contribution to the medical applications.
Data Acquisition
The data for use in detection tests are provided by A/Prof Baumert under the assistance of the project supervisor, Dr. Said Al-Sarawi. The project could not be a success without their helpful participation.
Those data files are stored in EDF and XML formats.
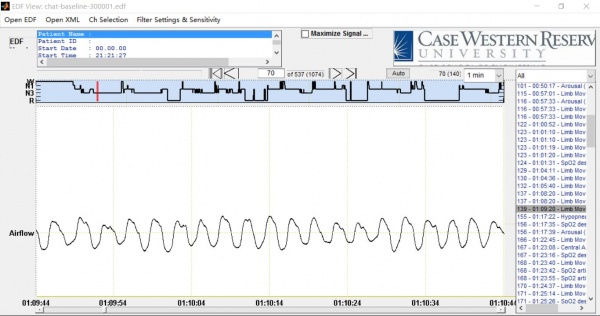
• EDF file – contains an multi-channel overnight recording of sleep signals and labels of each acquisition channel with some available information , such as sampling frequency. • XML file – contains the corresponding annotations of all the sleep events happening in the recording period and those annotations are used as reference while verifying if the detection statement is correct or not. The initial step to do analysis work is to observe the features of those provided signals.
A free EDF viewer (see Figure 3) from National Sleep Research Source is employed in this stage to combine the EDF files and XML files. The viewer enables the user to combine an EDF file with a corresponding sleep annotation file. The user has a myriad of ways to view the signals including scrolling, clicking on a specific annotation and determining the display channels of signal.
In this project, the channel of airflow signal is selected to implement the signal processing work.
Detection based on Wavelet
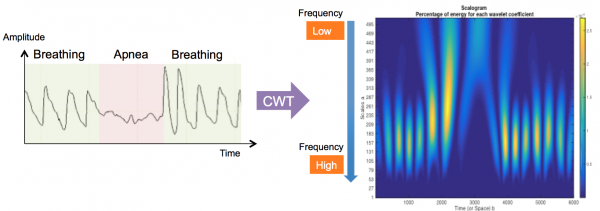
Figure 7 shows the frequency distribution variation from normal breathing session to apnea session.
Obviously, there is a significant power variation where the bright color denotes a higher power level and the darker color denotes a lower power level. A tendency of signal power from high frequency range to low frequency range has been discovered.
Based on the CWT analysis, the phenomenon of power variation in higher frequency band is considered to be utilized as the indicator to detect the occurrence of sleep apnea.
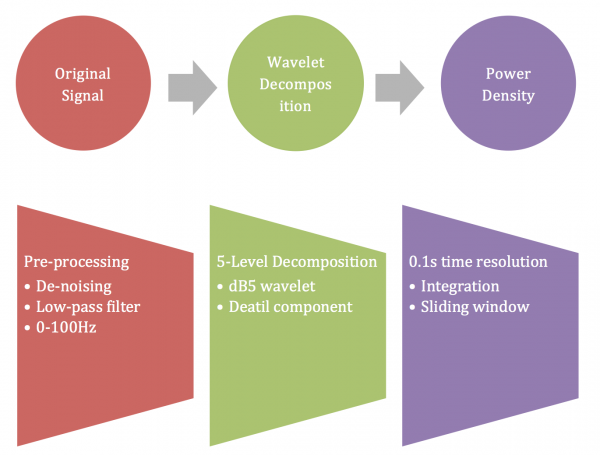
The next step is to extract the desired frequency components and calculate their power level so as to find out the power variation ratio.
The procedure of obtaining the power density of the airflow signal can be illustrated by the following chart.
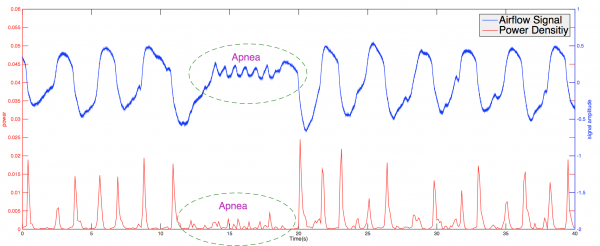
The below figure demonstrates the power reduction in apnea intervals.
Result Analysis
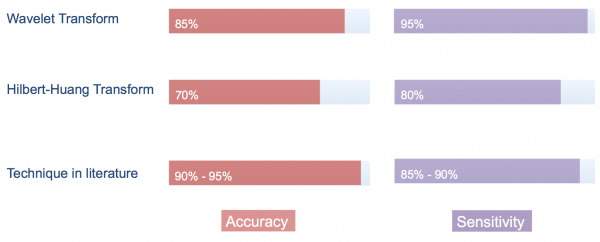
After implementing massive tests on 100 different cases, the average detection accuracy of the method based on wavelet transform comes to around 85% and the sensitivity reaches up to 95%.
From the above results demonstration, the score of sensitivity is the highlight which has exceeded that of the approaches in literatures.
However, the accuracy is a drawback of the method, where there is still a potential to be improved in the future.
Design Plan
Conclusion
All things considered, the aims of the project have been accomplished successfully and a conclusion is required to be summarized at this stage.
The project focused on creating an effective algorithm for detection of sleep apnea and putting forward a draft design plan for use to construct a physical sleep monitor in the future.
The three objectives listed in sub-chapter 2.4 have been achieved and the present achievements are listed below.
• Sleep apnea occurrence detection: the algorithm is able to utilize the power indication to capture the power variation in high frequency band from normal respiration to apnea interval so as to detect the occurrence of sleep apnea event.
• Duration measurement for sleep apnea: a reduction function is employed to monitor the amplitude reduction of airflow signal through the comparison with a prior baseline established and the duration of apnea event can be measured by quantifying the positive interval length of the reduction function.
• Confidence factor evaluation: a statistical confidence level is established to evaluate each detection statement via calculating the derivation of the power ratio from the mean value of the normal distribution which is used to represent the power ratio reference for apnea events.
• Design plan of a monitor prototype: a preliminary design plan is put forward for the further integration of the algorithm with the data acquisition hardware.
Future Work
The ultimate target of the project is to produce a physical monitor prototype with practical diagnosis value for implementation of sleep apnea detection in medical institutions.
Due to the limitations of time and manpower, the group is not able to complete the work on both software programming and hardware construction.
There is potential that could be implemented by future project groups. These include:
• Algorithm improvement:
As mentioned in the introduction, sleep apnea is classified into three types according to different cause mechanism, but at this stage, the classification work has not been considered. It might be advantageous to assess the features of some other signal channels (i.e. ECG, SaO2 etc.) in apnea period to extract the indication used to classify sleep apnea events.
• Decline of the false positive rate:
The drawback of the presented detection algorithm is the presence of false positive detections, which has a adverse effect on the accuracy. There is a need to consider an approach to lower the false positive rate. This issue could be achieved by employing a new indicator to have a more strict restriction in detection.
• Software and hardware integration:
The next stage in the process would be to turn this detection algorithm into actual hardware and a physical monitor is expected to be constructed by future groups. Some issues worth mentioning include the sensor selection (i.e. specifications of the sensor, resolution, I/O voltage, sampling frequency etc.), interface where the program and hardware interact and budget control.
