Difference between revisions of "Projects:2016s1-120 Attacking Cancer with Signal Processing"
(→Noise Floor) |
(→Kolmogorov–Smirnov Test) |
||
| Line 41: | Line 41: | ||
===Kolmogorov–Smirnov Test=== | ===Kolmogorov–Smirnov Test=== | ||
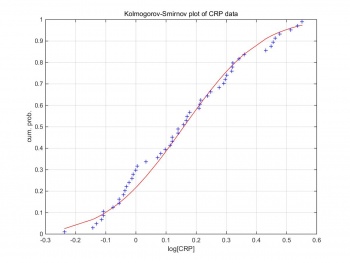
Kolmogorov–Smirnov test can compare a sample with a reference probability distribution [6]. Figure 6 shows the Kolmogorov–Smirnov test of the raw CRP data. The CRP data are formed in log scale,and follow the Gaussian distribution. Therefore, we can generate Gaussian random pseudo-data by creating Gaussian random variables based on the log scale CRP data. | Kolmogorov–Smirnov test can compare a sample with a reference probability distribution [6]. Figure 6 shows the Kolmogorov–Smirnov test of the raw CRP data. The CRP data are formed in log scale,and follow the Gaussian distribution. Therefore, we can generate Gaussian random pseudo-data by creating Gaussian random variables based on the log scale CRP data. | ||
| − | + | pseudo_data=(random×σ)+μ | |
| − | [[File:KS_plot_CRP.jpg| | + | [[File:KS_plot_CRP.jpg|350px|thumb|centre|Figure 2. Kolmogorov–Smirnov Test of CRP Data]] |
---- | ---- | ||
Revision as of 12:48, 26 October 2016
Contents
Project Information
Topic: Attacking Cancer with Signal Processing
Supervisors:Dr. Andrew Allison
Adviser: Prof. Derek Abbott
Project members:Jin Hu Mohammed Said Al-Wahaibi
Introduction
Cancer is one of the most devastating unsolved medical problems. Only 7% of cancer patients on average have a hope of recovery. New approach to solve the problem is to fight the cancer by strengthening the human body's own immune system, by improving the timing of treatment, using signal processing. CRP is produced by the liver and adipocytes in response to inflammation. People who infected by cancer have a different CRP level comparing to healthy ones. Study showed that the best time to apply the immune therapy is when the CRP level is low.
Motivation and Objectives
The main focus of the project is to improve the existing treatment, by improving the timing. The project uses signal processing to estimate the optimal treatment time. The ultimate goal is that this project will help extending human lives.
Previous Studies
In 2009,Dr. Brendon Coventry and his colleagues used Low-Reactive Protein (L-CRP) test to obtain high sensitivity data of CRP. And they found the CRP levels are periodic with the cycle of 7 days.
In 2014, Dr. Mutsa Madondo and his colleagues did their research ,they used Enzyme-Linked ImmunoSorbent Assay(ELISA) to obtain blood samples from patients at seven different times in 12 days' period.Then they claimed that CRP levels and Treg and Teff frequencies did not appear to be oscillatory.
Background
The CRP level of a cancer patients is differing from a healthy human. As the CRP response to inflammations, the change in it level might be periodic and accrue in cycles. The CRP data we have a noisy and irregularly sampled. To separate the noise from the signal we use Fast Fourier Transform techniques and Lomb Periodogram. Both methods are valid way to separate the noise from the signal. We use both method to make sure of getting a valid signal and reducing the possibility of false positives.
Noise Floor
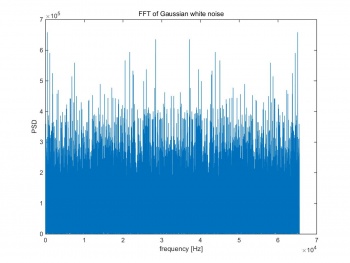
The noise floor is the Fourier transform of noise and unwanted signal. Figure 1 shows the FFT result of Gaussian white noise, which is very noisy and no pure peak can be found. If performing FFT on a noiseless signal , a pure peak will appear on the power spectral density (PSD). For noisy signal, even the peak can be obtained on PSD, the FFT of noise still shows in the background.
Kolmogorov–Smirnov Test
Kolmogorov–Smirnov test can compare a sample with a reference probability distribution [6]. Figure 6 shows the Kolmogorov–Smirnov test of the raw CRP data. The CRP data are formed in log scale,and follow the Gaussian distribution. Therefore, we can generate Gaussian random pseudo-data by creating Gaussian random variables based on the log scale CRP data. pseudo_data=(random×σ)+μ

