Projects:2018s1-175 Split-ring resonators for measuring spatially-distributed complex permittivity at microwave frequencies
Contents
Introduction
Split Ring Resonator (SRR) is an electromagnetic metamaterial which can be used as a sensing device. This project are developed to produce a 2D permittivity mapping for different types of material under test (MUT). A device which using SRR as a sensing device were produced with a varactor to load the DC voltage replacing VNA and 3 dimension testing of scanning system.
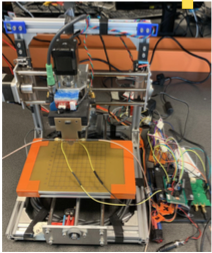
The figure shows how the system that had been build from last year project. This year this project changing the system so that it will be more effective. The varactor had been put into the SRR to replace the VNA and new system which can provide 3D scanning also been added replacing the 2D system made by last year project.
Project Group Members
1. Izatul Natasha Zulkefli
2. Liang Cheng
3. Ziyuan Wang
Project Supervisors
1. Dr. Withawat Withayachumnankul
2. Professor Christophe Fumeaux
Project Aims and Approached
The aims of this project is to make the SRR sensing device produced by the last year group to be give high sensitivity in scanning the MUT.
There is three approached that been explore to increase the sensitivity of the sensing device using SRR.
1. Designing different design of SRR
Designing the SRR is the main part of the project for increasing the sensitivity. This designing process had considered many types of factor so that the SRR can works well when tested with different types of MUT. The shape of SRR had been maintained from the previous shape which is in triangle shape as this shape can give better resolution . As for the design, the microstrip had been change to match with the 50 ohm characteristic impedance for impedance matching with the port. The SRR also were designed with almost no thickness so that it can give better resolution besides can made the varactor being soldiered easily on the SRR. Two inductance line were made to supply dc voltage and stopping the RF signal.
2. Load Varactor on the SRR
Varactor is a diode that can vary its capacitance by loading the dc voltage. This special characteristic made varactor suitable to replaced the VNA . VNA were used by the previous group to produced the resonance shift change when MUT are placed under the SRR. This function were replaced by varactor which vary the dc voltage to get the reading of the frequency shift.
3. 3 Dimension Sensing
The permittivity mapping are done by 2 dimension mapping by last year project. As to increase the permittivity mapping function, a system which allow 3 dimension mapping (x,y and z axis) were produced.
Project Design
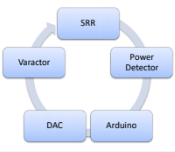
The cycle shows how the overview of the project structure. Starting with SRR as a sensing device to test with different MUT. Then, the system continue with the power detector getting the measurement of the power signal produced by the SRR. This power signal then analysed by the arduino board which had been coded to pass the reading of the power signal to the Digital Analog Converter. This reading were then received by the varactor to produce the result of frequency shift made by the SRR.
Design and Hardware
SRR
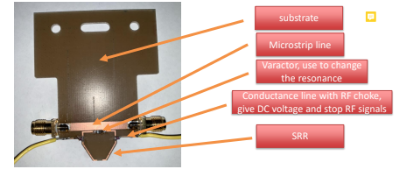
SRR were design as shown in figure below :
Substrate : Substrate that had been used is fr4 which has relative permittivity of 4.3.
Microstrip line : Microstrip line with width of 3.162mm with almost no thickness were used to get the impedance characteristic of 50 ohm for impedance matching.
Varactor : loaded on the SRR used for changing the resonance frequency.
Conductance line : Used for RF choke which supply DC voltage and stop the flowing of RF Signal.
Power Detector
This power detector are used to measure the voltage amplitude produced by SRR.
DAC And Arduino
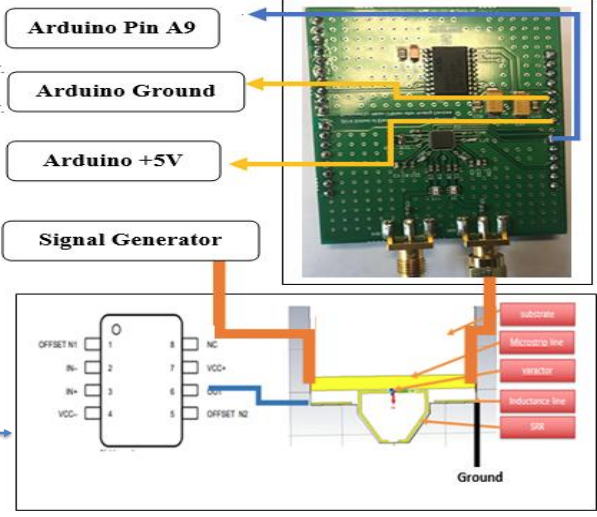
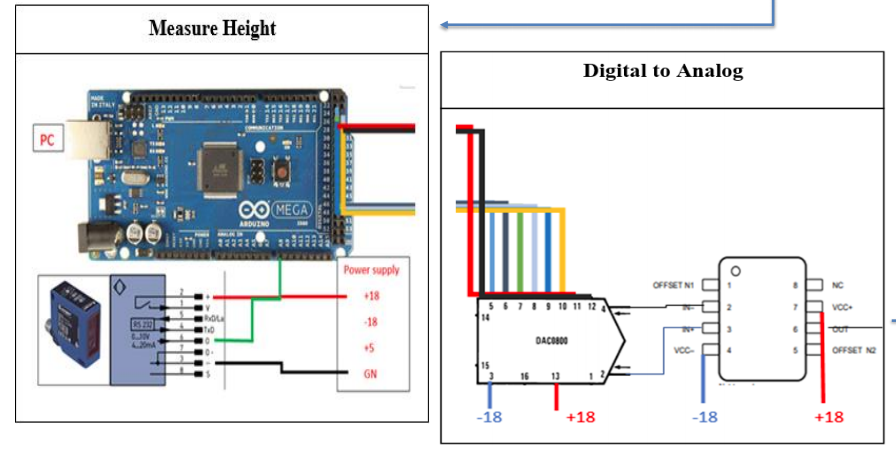
This diagram shows the structure of how the arduino control the sensor to measure the height and also pass the reading of voltage to DAC which then being transfer to varactor for resonance frequency variation. The sensor that had been used is laser displacement sensor (LDS CP08MHT80) which can give high resolution (8um), reasonable price and also give a good result of the measurement.
Project Results
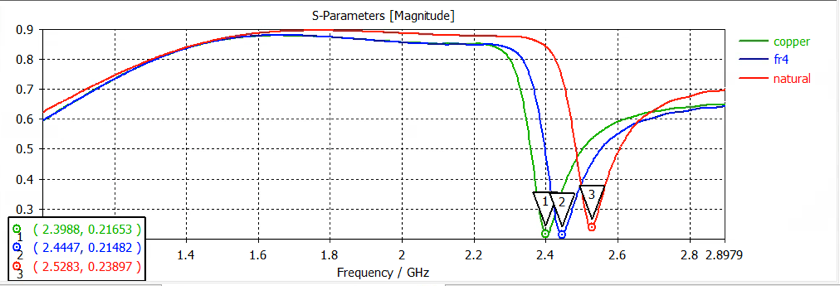
From the simulation made in CST software, the graph of S2:1 which shows the frequency shift shown a successful improvement by 32% of normalised frequency shift from last year. This shows that when the MUT are placed under the SRR, the shift are more significant than before. Two MUT (copper and fr4) are used to compare from the last year result.
