Projects:2020s1-2432 How much Energy Storage does Australia need?
Contents
Introduction
The aim of this project is to gain perspective on how much energy storage is needed to ensure demand supply balance due to the intermittency of renewable energy sources. A significant amount of renewable energy generation has been added since 2018. In 2019, 24% of Australia’s electricity generation is from renewable energy[1]. The increasing reliance on renewable energy led us to question how much energy storage does Australia need? Because energy storage is such an important aspect of renewable energy growth. Australian Energy Market Operator (AEMO) projects that by 2036 Australia's battery energy storage capacity will be 6.6 GWh[2].
Project Team
Project Students
- Nasser Khanezan
- Jun Wei Kuan
Project Supervisors
- Derek Abbott
- David Vowles
Project Aim
The aim of this project is to gain perspective on how much energy storage is needed to ensure demand supply balance due to the intermittency of renewable energy sources in Australia. To overcome the intermittent characteristics of renewable energy, a substantial amount of energy storage is required. However, the amount of storage required is needed to be justified by practicing optimisation, the battery storage is not necessary to be overly high, as it will spend extra cost for battery construction, and it cannot be lower than domestic energy demand, as this will lead to outages.
Background and Motivation
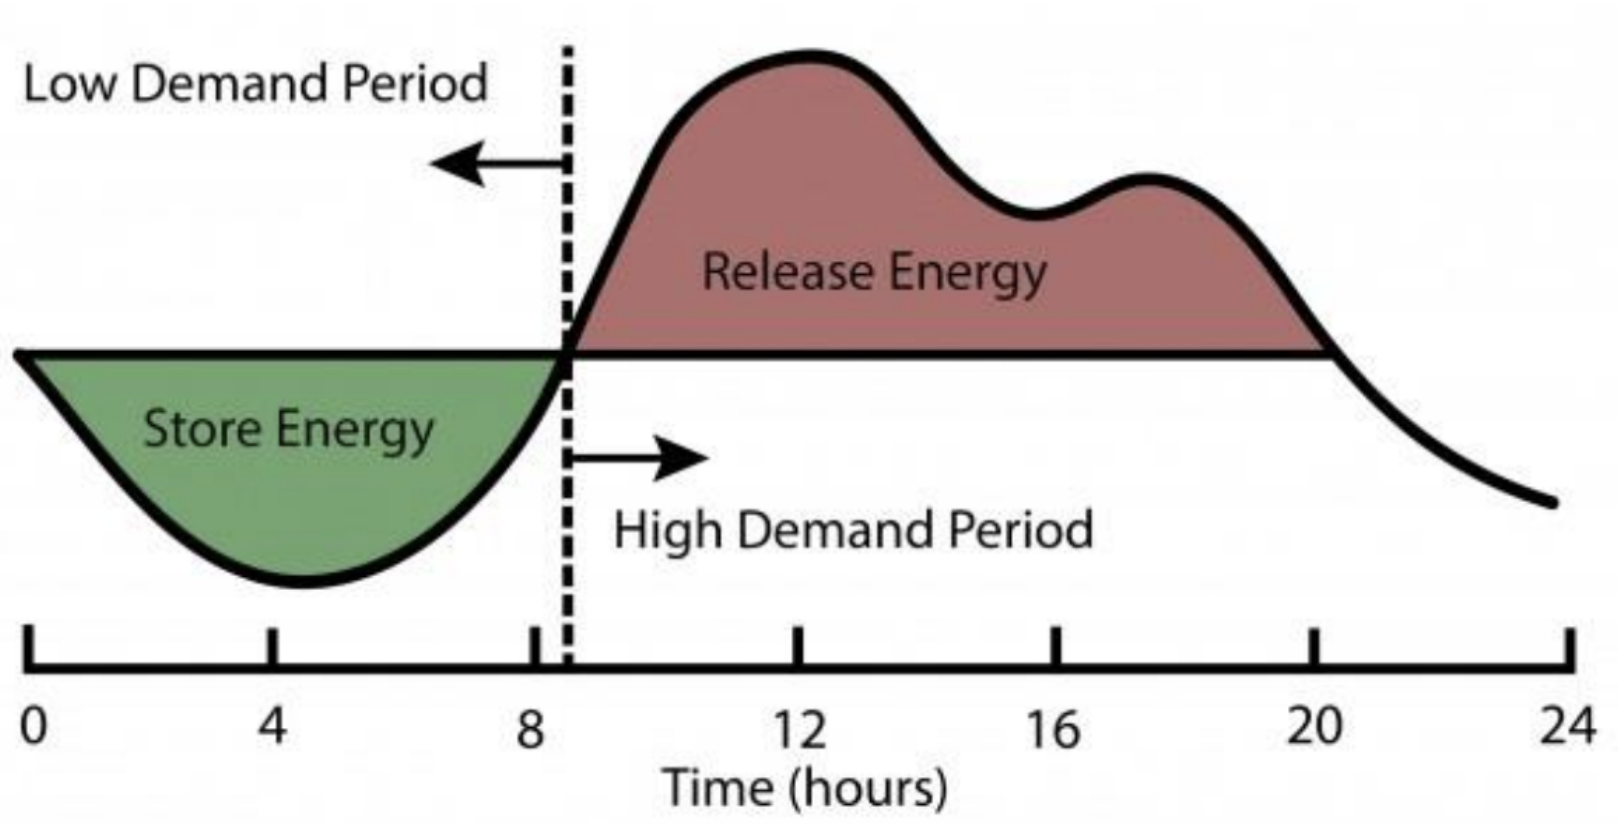
Australia has one of the best geographical location in the world for solar and wind energy generation. As shown in figure 1 [3], load levelling resultant from battery charging when the battery is empty and there is surplus energy from renewable energy source, and there is time when the domestic energy demand is higher than the renewable energy supply, battery will discharge to meet the domestic energy demand.
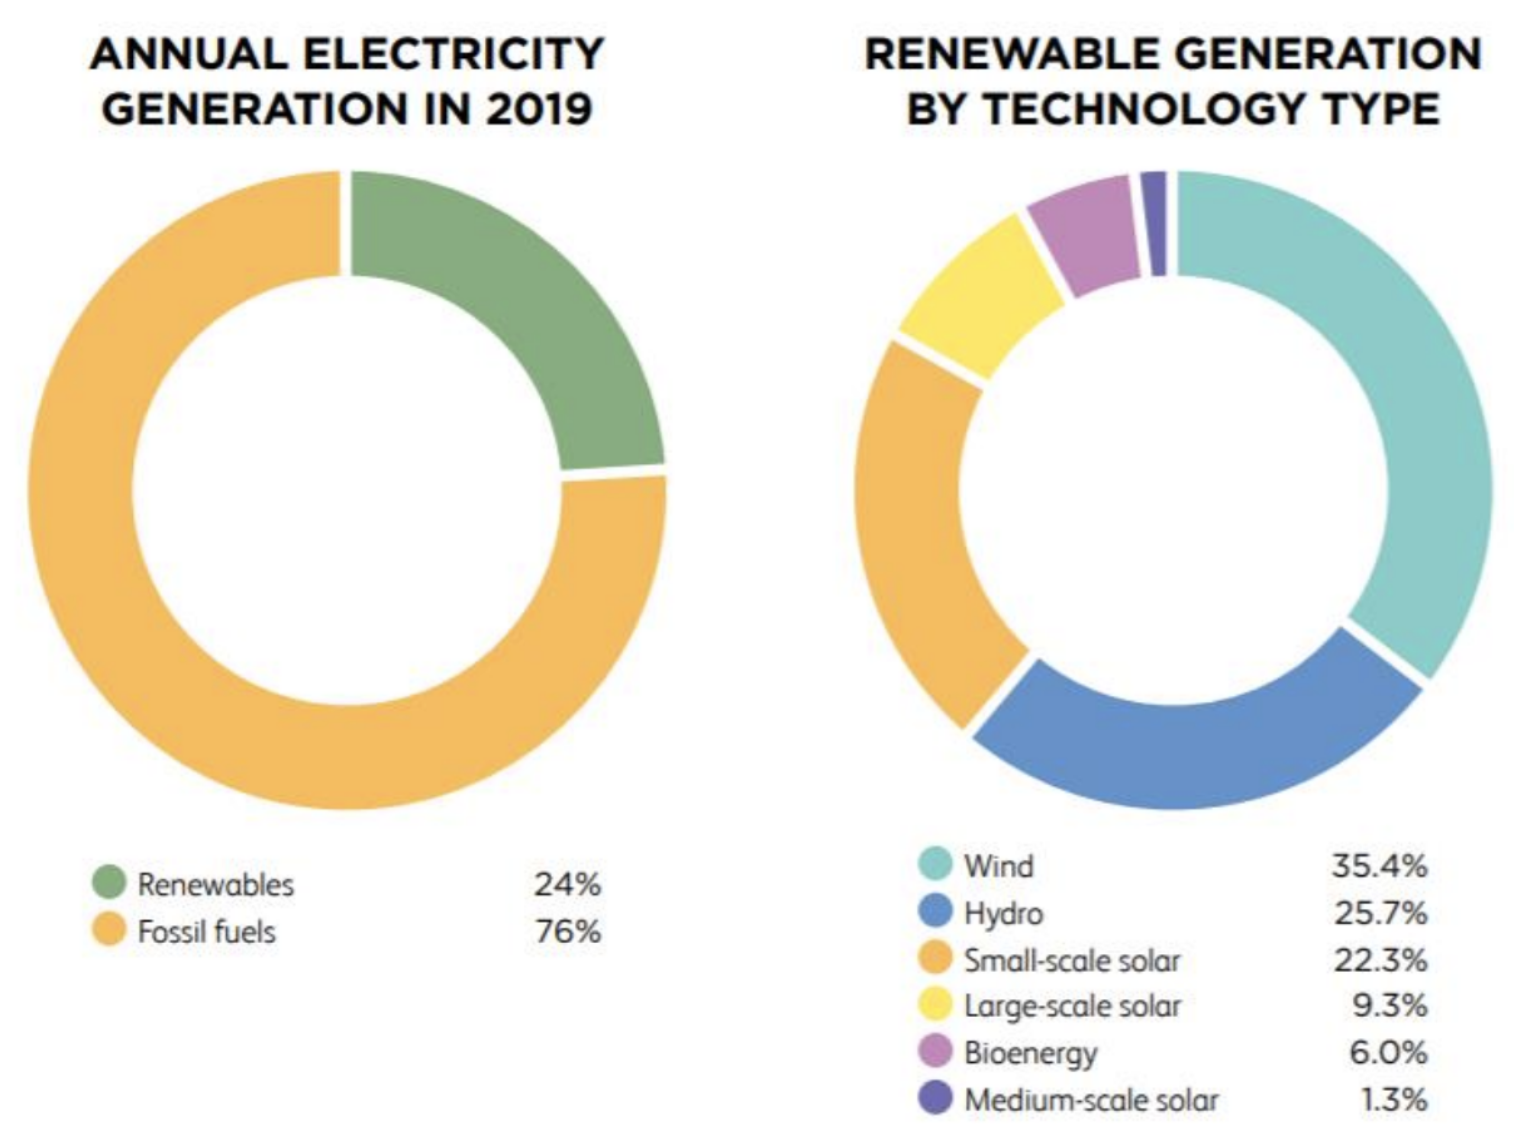
In 2013, Australia aimed to achieve 20% electricity source from renewable source by 2020. However, according to Clean Energy Australia Report 2020, as shown in Figure 2 [4] , renewable energy sources achieved 24% of the total Australia electricity generation. Therefore, as the renewable energy source picks up, battery storage is required to tackle the intermittent characteristic of renewable energy source so that, over time, fossil fuel energy generation can be reduced and be replaced by renewable energy.
Technical Background
Energy storage systems are the driving force for utilization of renewable energy sources. For that we must effectively utilize the energy storage system. Different strategies can be opted to operate the energy storage system. Two of the main strategies are basic strategy and smart strategy for energy storage systems. Basic strategy is to charge the battery whenever there is excessive power from the PV system and utilize this power when production of the PV system is less than the peak demand. This is mostly used over the globe for utilization of the energy storage system. Smart strategy is an approach in which the power consumption is spread over the longer period from the fossil fuels-based power plants. Afterwards it must reduce the capacity of the fossil fuels for a specific energy storage capacity. Energy storage system technologies are not very advanced. Different types of systems exist to overcome the problem of energy storage, but scientists and researchers are looking for cheap and high energy storage systems. Currently, there are different types of energy storage system but for large scale and renewable energy resources only three categories are considered. Batteries: which is dominated by lithium-ion due to light weight and high power storing capacity, Pumped storage hydro: it is storage technology with high storing capacity for longer periods of time and fuels: renewable energy resources are used to produce the hydrogen from water (fuel cell).
Result & Discussion
As the result, we have completed the analysis for three different cases. The first case is the baseline case, with the condition of existing renewable energy source. The second case is the case, where we multiplied the wind energy and solar energy generation with its optimized coefficient while keeping the rooftop PV and hydro energy generation fixed. Whereas, in the last case, we scaled up all the renewable energy source with a scaling factor, that we have calculated by taking the ratio of total energy demand to total renewable energy generation in a year. The most important constraint to develop a Energy storage for Australia renewable energy supply is that, the total renewable energy source must be greater or equal to the total energy demand for the whole year. In order to compare and visualize the battery storage, in term of its physical size and energy storage capacity, it is compared by Hornsdale battery, Snowy 2.0 pumped hydro storage, and the Gordon Dam in Tasmania. The Hornsdale battery is the second largest lithium-ion battery in the world, located in South Australia, and co-located with Hornsdale Wind Farm [5]. In November 2019, Neoen confirmed that its storage capacity will be increased up to 0.1935 GWh [6]. Snowy 2.0 pumped hydro storage is the largest renewable energy project in Australia [7] , as well as largest energy storage project in the southern hemisphere, with the storage capacity of 350 GWh [8]. The Gordon Dam in Tasmania is the largest dam in Australia, in term of water mass and its storage capacity. The Gordon Dam is found to have 4715 GWh of energy storage capacity [9]
a) Baseline case
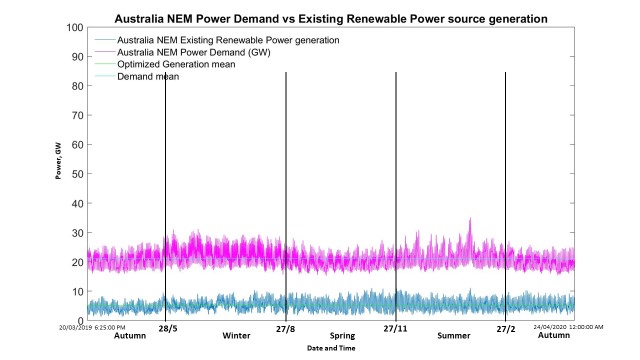
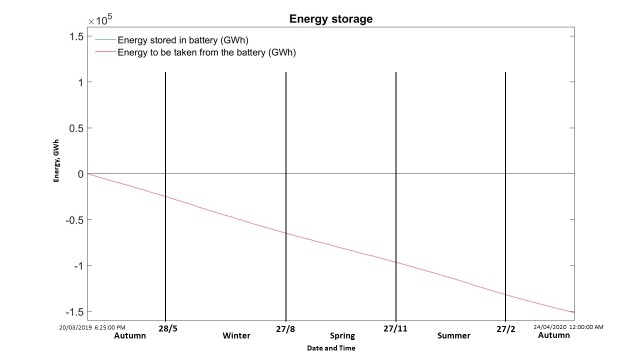
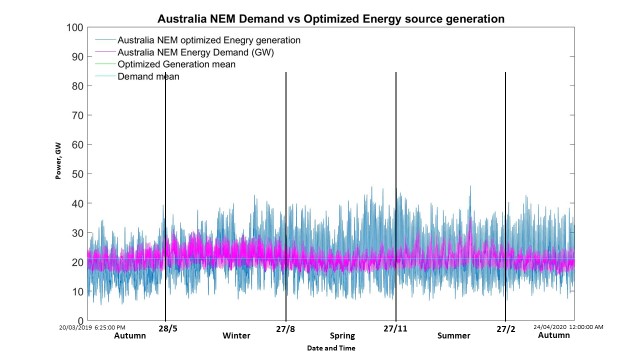
A graph of the existing renewable power generation(GW) versus power demand(GW) is plotted with no modification on the renewable energy source. As shown in the figure xx, the power demand is significantly higher than the renewable power generation throughout the year. In order to meet the power demand required, excess power supply is required to be retrieved from the batter power storage. Therefore, a constant extra power supply is needed throughout the year, and eventually a Energy storage graph with a constant negative slope is obtained, which indicated infinite battery storage. For the period from 20/03/2019 to 24/04/2020, the energy storage required to meet the power deficit of this period of time is found to be 151700 GWh, which is equivalent to 783979 of Hornsdale battery storage, 433 of Snowy 2.0 hydro pumped storage, and 32.2 of Gordon Dam storage capacity. However, this baseline is not a practical approach in real scenario, due to the reason that the total renewable energy generation is less than total energy demand, therefore the battery storage capacity will keep increasing each year and have no limit.
b)Renewable energy generation with: 7*wind + 7.7*solar + 1*rooftop PV + 1*hydro
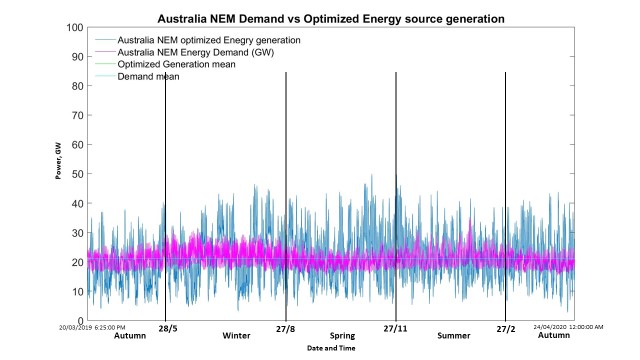
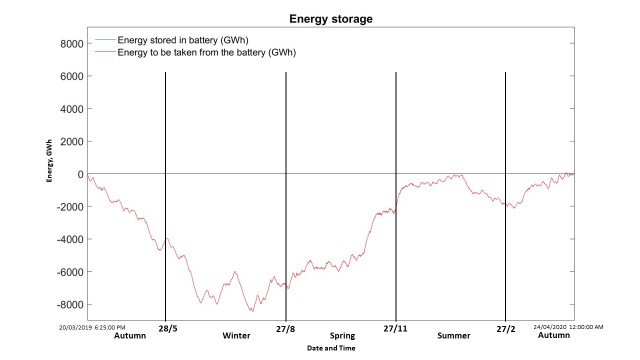
By multiplying wind energy source by 7 and solar energy source by 7.7 while keeping rooftop PV and hydro energy source constant, the total renewable energy generated throughout the year will be sufficient to meet the total energy demand for the whole year. During winter, the power deficit will come to its peak, which indicates that the battery storage capacity should be designed such that it is sufficient to store enough energy to supply the power shortage during these period of times. The graph of additional energy supply needed from the battery to overcome the power deficit is plotted. The highest negative value in the graph indicated the minimum amount of battery energy storage required to cope with the worst time of power shortage in the whole year. The highest negative value in the graph is found to be 8440.4 GWh, which is the minimum battery storage capacity required. This amount of storage capacity is equivalent to 43620 of Hornsdale battery storage, 24 of Snowy 2.0 hydro pumped storage and 1.8 of Gordon Dam storage capacity.
c) All the renewable energy sources are multiplied by a scaling factor of 4.1308
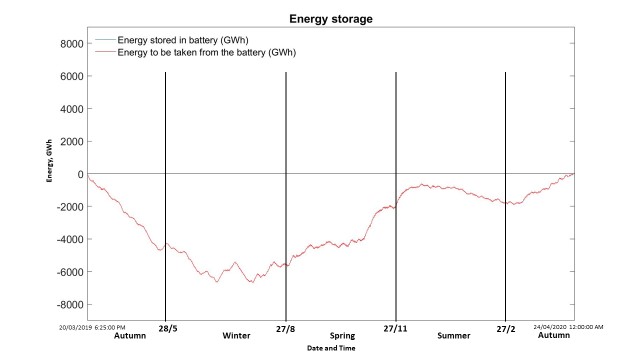
In this case, all the renewable energy sources are multiplied by 4.1308, in order to ensure that the total renewable energy generation is equal to the total energy demand throughout the year. Since all the renewable energy sources are multiplied by 4.1308, the power generation is evenly distributed throughout the year with little fluctuation. The power demand reaches its peak on winter period, which possibly due to high domestic heater usage. As the result, the battery storage required will be needed to overcome the power deficit during winter time. The highest negative value of the energy storage graph is found in winter period, which indicates the minimum battery energy capacity required to overcome to worst time of power shortage in the whole year. The highest negative value in the graph is found to be 6687.1 GWh, which is the minimum battery storage capacity required. This amount of storage capacity is equivalent to 34559 of Hornsdale battery storage, 19 of Snowy 2.0 hydro pumped storage and 1.4 of Gordon Dam storage capacity.
Conclusion
According to our finding, the transition of Australia’s electricity from fossil fuel to 100% renewable energy source requires at least 4 times of current renewable energy generation to meet the electricity usage demand. However, in order to overcome the intermittency of renewable energy source, 6687.1 GWh of battery capacity is needed if each energy source is multiplied by 4.1308. This storage capacity is equivalent to 19 times of Snowy hydro 2.0, 1.4 times of Gordon Dam storage capacity in Tasmania and also 8.07 x 10^12 KG of water mass in a 300 Meters height of pumped hydro storage. However, the rooftop PV and hydro energy sources may be not feasible to scale up its generation in the actual scenario due to its cost and government policy. Therefore, the second case which only the wind and solar energy sources are multiplied by its coefficient, may be worth to consider.
Future Work
The aim of this project is to estimate the energy storage required to overcome the intermittency characteristic of renewable energy source throughout the year. The outcome of our analysis is the value of the battery storage capacity in term of GWh for the 3 cases, which are the existing renewable energy scenario, the case which the wind and solar energy sources are multiplied by 7 and 7.7 respectively while rooftop PV and hydro energy sources are remained constant, and the case which all the renewable energy sources are multiplied by a scaling factor of 4.1308. The result of battery capacity estimation that we obtained in the second and third case is very close, and is expected to be carried forward to the future research in order to justify which one is the better approach, due to the factor of cost to construct renewable power plant. Besides, the value of battery storage required is also expected to further decrease with certain amount by optimizing the renewable energy generating such as placing the solar panel in the region with the maximum sunlight that will be received.
References
- ↑ https://www.cleanenergycouncil.org.au/resources/resources-hub/clean-energy-australia-report [Accessed 18 April 2020]
- ↑ http://www.aemo.com.au/Electricity/National-Electricity-Market-NEM/Planning-and-forecasting/-/media/080A47DA86C04BE0AF93812A548F722E.ashx (Viewed 31/3/20)
- ↑ https://energycentral.com/c/cp/enabling-renewable-resources-through-battery-energy-storage-systems (Viewed 6/4/20)
- ↑ https://assets.cleanenergycouncil.org.au/documents/resources/reports/clean-energy-australia/clean-energy-australia-report-2020.pdf (Viewed 3/4/20)
- ↑ <https://hornsdalepowerreserve.com.au/ (Viewed 5/10/20)
- ↑ https://reneweconomy.com.au/tesla-big-battery-adds-new-capacity-and-services-on-march-to-100pct-renewables-grid-55121/ (Viewed 6/10/20)
- ↑ https://www.snowyhydro.com.au/snowy-20/about/ (Viewed 6/10/20)
- ↑ https://www.energy.gov.au/government-priorities/energy-supply/pumped-hydro-and-snowy-20/ (Viewed 6/10/20)
- ↑ https://www.hydro.com.au/. (Viewed 6/10/20)
