Projects:2016s1-131 ECG Enhancement with Advanced Signal Processing
Contents
Topic
ECG Enhancement with Advanced Signal Processing
Supervisors
Dr. Brian Ng
Prof. Mathias Baumert
Team Members
Yang Lin
Yingtong Guo
Introduction
The electrocardiogram (ECG) recording plays an important role in medical applications. However, it is easily affected by sources [2]. In this project, we are intend to enhance ECG signals by using recent advances in digital signal processing which is based on the sparsity –based signal processing. Three ECG databases and one optional database are used to implement the approach. Generally, the desired ECG recordings are gained from websites and then according to different ECG signals, the sparsity-based method is used with different parameters. After that, the performance of the method is evaluated by comparing the accuracy of the RR interval measurements, obtained from the Pan Tompkins QRS detection algorithm.
Motivation
The ECG signals are measured from the body surface so it is easy to be contaminated by body and instruments. It is essential for doctors to diagnose the diseases accurately by analysis of ECG signals and actually, all the waves of ECG signals have a certain pattern which have a predictable time duration, a range of acceptable amplitudes and a typical morphology which means that any deviation from the normal pattern is potentially not healthy [1]. Therefore, the noise or artefacts in the ECG signals can influence the doctors’ diagnosis and that noise in the ECG ideally should be removed before doctors’ diagnosis. That is the reason why we need ECG signal processing. In this project, the noise in the ECG signals will be removed or reduced and ECG will be enhanced with digital signal processing techniques so the doctor can analyze the real signal which should make the diagnosis more accurate, stable and reliable.
Previous Studies
This project is not a follow-up project but it is based on the work of Ning and Selesnick [2]. In their paper, some detailed denosing problem and proposed algorithm has been discussed. The most important thing is that the sparsity-based method has been introduced which make it possible to implement in ECG signals [2]. In addition to that, the QRS detection algorithm is named Pan Tompkins [3] which is reliable to detect the QRS complexes. It has a good result for the standard 24h MIT/BIH arrhythmia database so it can be used to test our project’s result. In this project, three databases and one optional database are chosen from physionet website to verify the sparsity-based method in the work of Ning and Selesnick and use Pan Tompkins QRS detection algorithm to check the result.
Objectives
The aim of this project is to improve the ECG signals in three databases and one optional database. The objectives are:
• Reduce the influence of noise which mainly focus on motion artefacts on ECG signal in the chosen database to provide better result for doctors.
• Investigate sparsity-based separation methods for QRS detection and compare the result to previous research.
• For the optional database, separate desired clean ECG signal from mixed ECG recording.
Background
ECG Basics
ECG is an approach that measures and records the electrical activity of the heart. It can be sensed by monitoring electrodes which are placed on the body surface. The basic information can be measured from the ECG signals is the heart rate and heart rhythm. For example, a normal person’s heart rate is from 60 to 100 beats per minute [1]. Therefore, the clinicians can diagnose the patients through the heart rate and rhythm. Actually, each electrical activity of heart has a distinctive waveform. Figure shows that a normal ECG signal consists of P wave, QRS complex and T wave [1]. The first one is called P wave which represents the depolarization of atria from the SA node to the AV node. Depolarization is the change in the cell’s membrane potential to a positive value. It is this change that generates the electrical impulse that starts the heart’s contraction so the P wave can be related with the contraction of the atria [1]. The QRS wave which looks like a small dip followed by a large spike and another dip represents the depolarization of the ventricles which can be also think as the contraction of the ventricles [1]. One thing noticed is that the P wave is smaller than the QRS complex. That is because the ventricles are the muscle pumps of the heart compared to the atria. After the QRS complex, there is the T wave which represents the repolarization of the ventricles [16]. Repolarization is the opposite of the depolarization which returns the membrane back to a negative state [1].
Noise and Artifacts
In signal processing, noise is an unwanted component that a signal may suffer during transmission, processing and conversion. Basically, there are mainly 4 kinds of noises which possibly interfere the ECG signals:
• Power line interference is the most common noise. It comes from patients’ cables and can be easily found since the interfering voltage in the ECG signal will have frequency 60 Hz [18]. What is more, it can be regarded as sinusoids and combination of sinusoids [4]. Despite the fact that hardware system can remove part of the signal interference, the 60Hz of power line interference still exists [17].
• Muscle contractions (EMG) is caused by the contraction of other muscles besides the heart [2]. That contraction can also produce depolarization and repolarization which can influence the ECG signals. Moreover, it can be reasonably modelled as Gaussian distribution function. However, the variance is dependent on the environmental variables [4].
• Electrode contact noise is caused by the loss contact between the electrode and skin which can be permanent [4].
• Motion artefacts which due to vibrations or movement of the subject, resulting in a change to the skin voltage [4].
Sparsity-based method for removing noise
To remove the noise in ECG, actually there are many methods such as wavelet transform and adaptive filtering [7]. The wavelet transform is a time-scale transformation to optimize signal composition structure [6] and it will be described in detail in the next section. For Adaptive filtering method, a widely used one is the least mean squares (LMS) adaptive algorithm. The basic idea of LMS filter is to keep a gradient based iterative solution [19]. The idea of noise reduction is to use the adaptive filter to estimate the effect of the secondary input on the primary signal (the filter output Yk) and subtract this from the primary signal [19]. For example, the problem of fetal heart beat measurement. The heartbeats of the fetal are often corrupted by the effect of mother’s heart [23]. In that case, the effect of the mother’s heart on the fetal will be estimated and subtract this from the primary signal, leaving an enhanced signal Ek which consists primarily of the fetal heartbeat signal.
BP and BPD
However, all those ways are not flexible enough and some important information may miss due to the noise is non-stationary and the overlap of signal and noise bandwidths.
In Ning and Selesnick’s work, many algorithms based on sparsity-method for noise reduction have been introduced. If it is known that the signal which will be estimated has sparse Fourier coefficient, then sparsity-method can be used for denoising [5].
The basic idea about sparsity-method is to consider a system with the equation Y=Ax where A is an M x N matrix, y and x are length-M and length-N vectors respectively, where N>M. As the unknowns in the system are more than equations, the equation Y=Ax has infinitely many solutions.
An l1-norm is used which is defined by:
[[File:E1.jpg] (1)
An approach to solve Y=Ax is to minimize the sum of absolute value of x:
 (2)
(2)
Where ||x||1 is the defined l1-norm. This problem is known as the basis pursuit (BP) problem which cannot be expressed in explicit form. One way to tackle the problem is to use an iterative numerical algorithm [5].
What is more, in real world y is usually noisy, the solution to the Y=Ax can be changed to minimize the cost function:
[[File:E3.jpg]|130px] (3)
This is the basis pursuit denoising (BPD) problem and similar to BP, the BPD problem can be solved by using an iterative numerical algorithm. In addition, note that ||x||1 is not differentiable since it is defined as the sum of absolute values [5]. The absolution value function is not differentiable at zero. That make the calculation difficult for large-scale problems. However, the BP and BPD problems are convex optimization so that some practical algorithms from optimization theory can be used such as iterative shrinkage (ISTA), fast ISTA (FISTA) and split variable augmented lagrangian shrinkage algorithm (SALSA) [5].
Signal component separation using BP
It is useful to split up the signal into its components when a signal contains components with distinct properties. What is more, when the signal components have overlap in frequency, the sparse representation can be used to signal separation problems. The use of sparsity to separate components of a signal is known as ‘morphological component analysis’ which means the components should have different shape.
Consider a known signal y, which can be regarded as the sum of two components,
![]() (4)
(4)
Where y1 and y2 should be distinct form each other. In addtion, it assumes that each of those two components is described by transforms A1 and A2 and the aim is to find the respective coefficients c1 and c2.
![]() (5)
(5)
Thus, instead of finding y1 and y2, find c1 and c2 are the appropriate way.
The equation is similar to the equation in the BP. The only difference is there are two sets of coefficients to be found so that problem is equivalent to basis pursuit.
 (6)
(6)
Likewise, the solution for the above equation is the same as the BP solution so that problem is also known as dual BP.
Therefore, the signal can be divided into two components according to their different characteristics. For ECG signals, they are sparse in frequency while the noise or other interference is not. In addition, the shape and period of R waves are regular which can be used to distinguish from the undesired component.
Discrete Wavelet Transform
The wavelet transform is based on small wavelets with limited duration which provides the time-frequency representation. Basically, the main idea of the discrete wavelet transform is that the signal is passed through various high pass and low pass filters [15]. Those filters can remove either high frequency or low frequency portions of the signal. This procedure is repeated so every time some portion of the signal corresponding to some frequencies being removed from the signal.
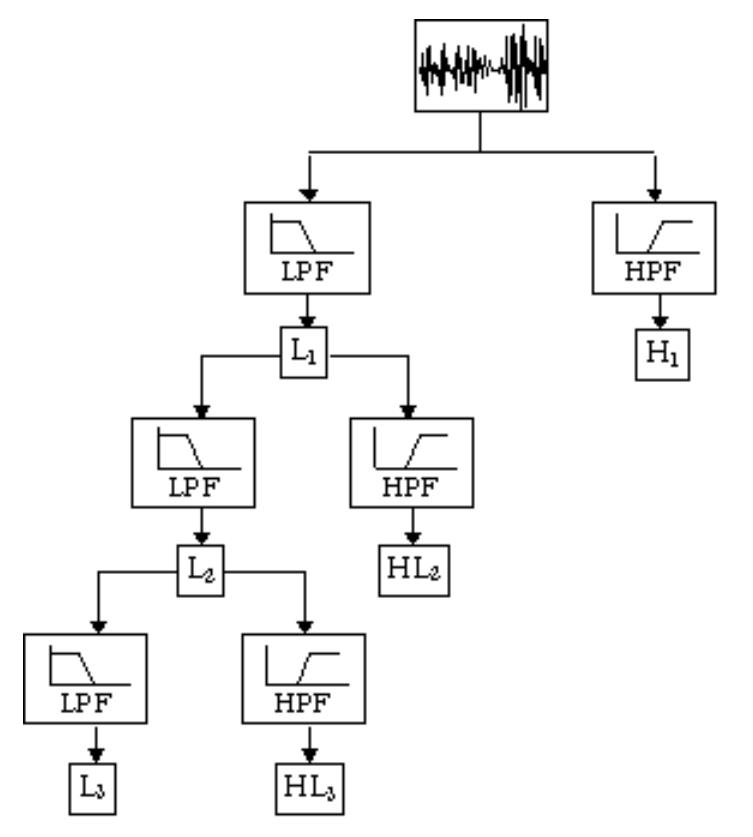
The DWT analyzes the signal at different bands by decomposing the signal into an approximation and detail information. The decomposition of the signal into different frequency bands is simply obtained by successive high pass and low pass filtering of the signal. As shown in figure 1, the original signal is first passed through a half-band high pass filter and a low pass filter. After that, half the frequencies of the signal have now been removed and half the samples can be discarded according to Nyquist’s rule [15]. The filter outputs are then subsampled by 2. downsampling a signal corresponds to reduce the sample rate or remove some of the samples of the signal. For instance, downsampling by two refers to drop every other sample of the signal. downsampling by a factor n reduces the number of samples in the signal n times.
The DWT is mostly used in image compression and images analysis [25]. One application is in JPEG 2000. People break the image into the DWT components, then construct trees of the coefficients generated by the DWT to determine which components can be omitted before saving the image to eliminate extraneous information. For this project, we want to use DWT to make ECG signal into sub-bands and analysis them to find which part is what we need so that the unwanted sub-bands can be reduced.
QRS Detection
In order to verify the approach in this project is feasible, a QRS detection is used to check the results. In this project, Pan Tompkins algorithm is chosen which is an old-fashion but widely used so it can make the result more convincing.
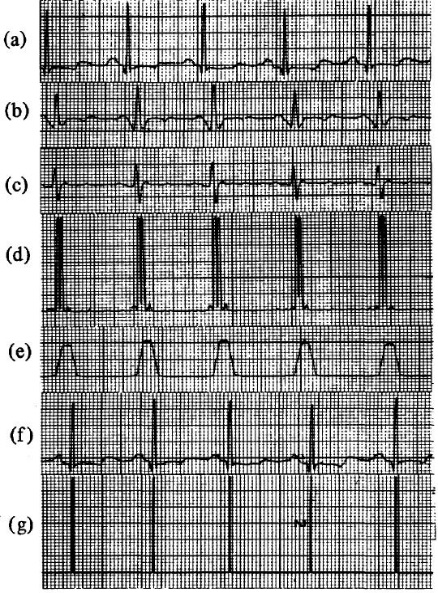
The algorithm has several steps [3]. Figure 2 (a) in Appendix is the original signal. To reduce noise and false detection, a band-pass filter is used and (b) shows the output of the filter. After that, the filtered signal is differential followed by squaring which (c) and (d) shows the results respectively. The square process increases the slope of the frequency response curve and will make false positives under control. Next, as shown in (e) moving window integration which generate a signal that contains information about both the slope and the width of the QRS waves. (f) is the signal that produced by delaying the original one by the total processing time of the algorithm and (g) shows the final output after using the adaptive thresholds. In this algorithm, two thresholds are used [3]. One is to threshold the filtered ECG and another is to threshold the signal produced by moving window integration. In that way, detection sensitivity can be increased and missed beats can be found.
R Wave Detection
As mentioned, the R wave, which represents early ventricular depolarization, is the first upward deflection after the P wave even sometimes the Q wave is missing. It is the easiest waveform to recognize on the ECG as it is the tallest among other waves. The abnormalities of the R wave may represent some diseases in heart. In ECG, R waves are always detected because the P wave and T wave’s amplitude is low. The RR interval is the same as the distance between two beats which should be from 0.6s to 1.2s [20]. From the RR interval, we can tell the beats are evenly spaced or not so the instantaneous heart rate can be calculated and the rhythm can be judged as well. Moreover, RR interval is applied to analyse heart rate variability which is a physiology phenomenon of variation in the time interval between heartbeats [21]. In addition, the measurements of RR intervals are essential because not only doctors are able to tell heart rate and rhythm from them but also they are often used to compare performances of various algorithms about ECG. Actually, the measurements for the long-time RR intervals suffer from non-stationary noise, such as baseline drift and the presence of ectopic beats which cause the statistical information inaccuracy [22]. Thus, some pre-processing methods are often used, such as nonlinear filter and wavelet technique [21]. In this project, the R waves will be detected and the RR interval will be calculated. Compare the RR intervals from the signal after processing to the reference ECG signal to evaluate the performance of the sparsity-based method. Since the RR intervals may vary from beat to beat, the mean, maximum, minimum and variance of RR intervals will be calculated to make the evaluation reasonably.
ECG Databases
ECG-ID database
This database provides 310 ECG recordings which come from 90 persons (44 men and 46 women aged from 13 to 75 years) [10] so that the sample is large enough to test the sparsity-method. Although the signal has high and low noise components, it is not very damaged so it can be a good database to get start the project. In addition, each record contains both raw and filtered signals [10] so that the signal produced by the sparsity-based method can be compared to the given filtered signal which make the method more reliable.
MIT-BIH Nosie Stress Test Database
In this database, the ECG recordings were generated by using calibrated amounts of noise which is typical in ambulatory ECG recordings to add two clean recordings (118 and 119) [11] so that both noise and clean signals are known. Therefore, the result from this project can be checked with the clean signals. Moreover, the ECG signals have different signal-to-noise ratios (SNRs) so it is good to test what extent the sparsity-based method can deal with.
Motion Artefact Contaminated ECG Database
The ECG recordings in this database is collected from a healthy male while he is standing, walking and do a single jump [12] so the main interference is motion artefacts. The reason for selecting this database is that the previous database’s noise is motion artefact as well so for further research, whether the sparsity-method can be used in different physical activity or not should be considered.
Abdominal and Direct Fetal ECG Database
This database is optional in this project. It provides direct fetal ECG and abdominal signals which are acquired simultaneously [13]. In this database, some recordings are dramatically corrupted by noise and the amplitude of the abdominal ECG recordings are very low which make the noise reduction hard. In this project, the ECG signal will be enhanced by sparsity-method and try to split up the mother’s ECG and baby’s ECG.
Experiments and Results
ECG -ID Database
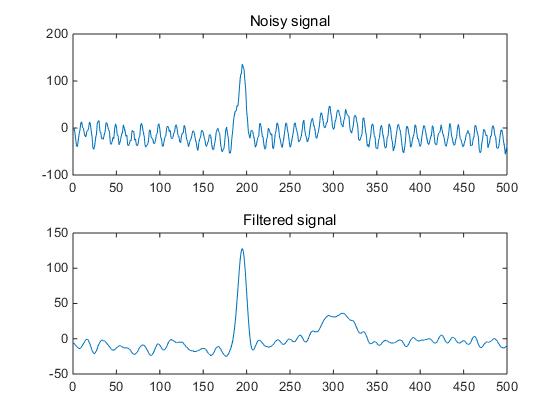
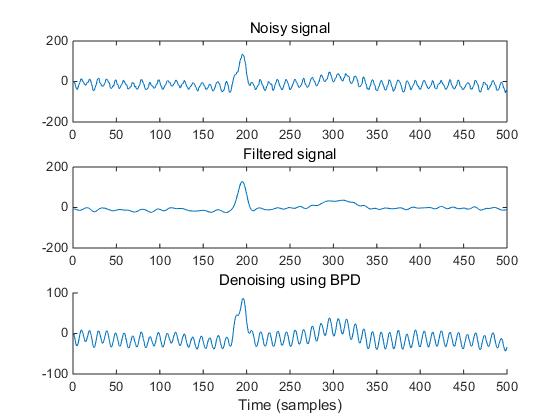
the technology based on sparse signal processing was used for ECG-ID database. As mentioned, in this database, both noisy and filtered signal are offered straightly. As shown in the figure 3, the noise is mainly from power line.
Result and Evaluation
From the result, the noise is not removed because from the frequency domain, it can be noticed that the noise is sparse that the BPD method cannot deal with. That is because the idea of the BPD is known that the signal’s Fourier coefficients are sparse and we can use that characteristic to get rid of the noise which is not sparse in frequency domain. The key of sparsed based signal processing is to find an alternative transform that sparsifies the QRS complex, but spreads out monotonic interference. However, in this case the noise is sparse in frequency domain as well so it is hard to denoise just by using BPD method.
As the noise is on 60 Hz, it can be easily removed by a low pass filter. Moreover, the power line artifact is not a big problem in the real world because we can distinguish the QRS complex despite of the power line interference. Therefore, BPD may not be the sensible option in this case.
MIT-BIH Noise Stress Test
Basis pursuit (BP) is used to separate ECG signal from noisy signal.Baseline wander and muscle artifact can be reduced by using filter-like method, because they occupy different bandwidth with ECG signal. In this project, a 7-level Wavelet transform is applied to the noisy ECG signal by using command wavedec. Then the coefficients in cA7 and cD1 are set to 0. This procedure can be regarded as applying a bandpass filter to the signal to reduce the baseline wander and muscle artifact. The reason to choose 7-level Wavelet transform is that the sampling rate of the signals is 360Hz, thus cA7 can cover the bandwidth of two kinds of noises. The coefficients in cD1(90 to 180Hz) are cancelled because no useful information exists in this bandwidth.
The BPD method will not be effective for signals in this database, because the electrode motion artifact overlap with ECG in frequency domain, which means ECG is not sparse (or distinct) in this domain. However, by observing the waveforms of ECG and electrode motion artifact it can be noticed that they are morphologically different. Thus, the BP method can be used in this case to separate the ECG signal from noisy signal.
Motion Artifact Contaminated ECG Database
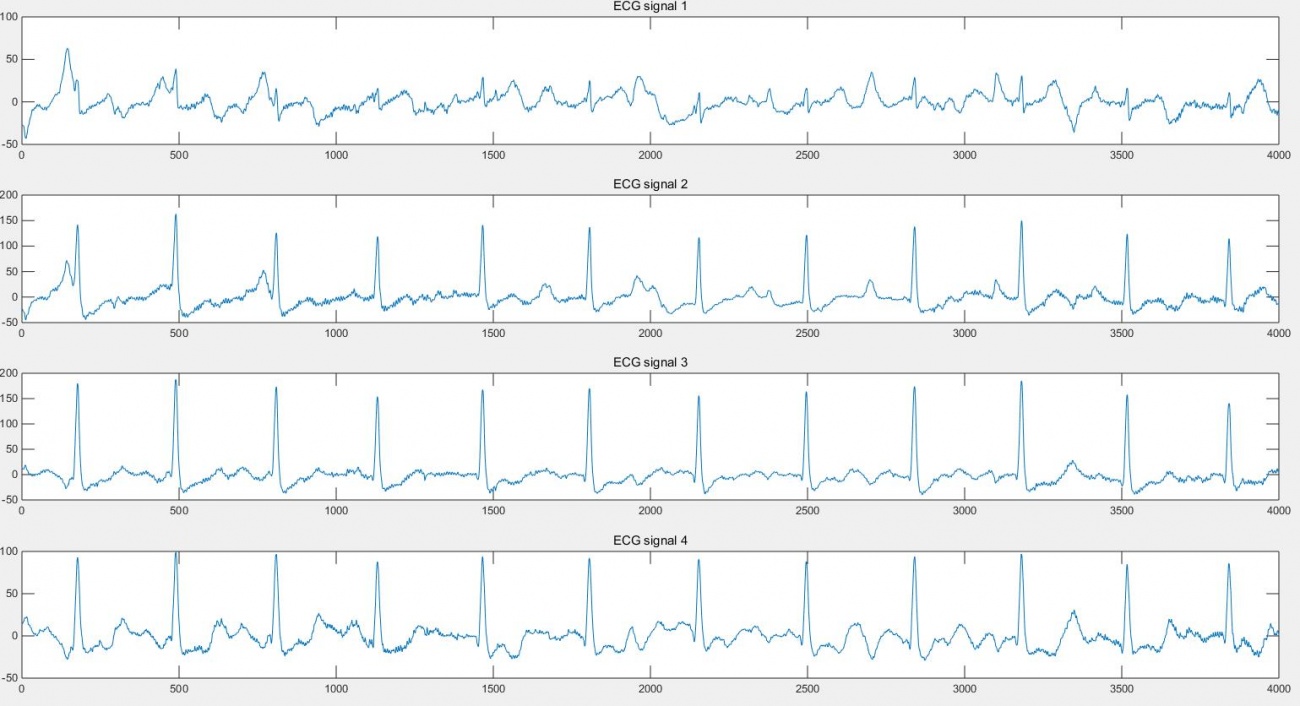
This database contains ECG signals which are corrupted by motions, such as standing, walking and doing a jump. Each measurement has 4 ECG signals which are collected from 4 pairs of electrodes on the single patch. In addition, each ECG signal in one measurement is aligned. One thing is that the whole length of signal in this database is only 0.8s that is equal to 4000 samples. Thus, it is hard to summary the characteristics of the motion artefact and the efficiency of the sparse based method. However, the good thing is the signals in this database are classified into three cases, which is helpful to verify the sparsity-based method can work efficiently for most motion artefact.
Walking Case
As we known, the above figure 5 shows the 4 ECG signals which are measured from a man who was walking. The ECG signal 1 is the noisiest signal in the test which will be dealt with and the ECG signal 3 is regarded as the reference signal as all the R waves can be observed clearly.
While using the DWT we can achieve better result, but there has some limitations and the computational effort is heavy as we do not know which level is suitable. In addition, using DWT is equivalent to filter so it does not adequately reflect the characteristics and advantages of wavelet analysis.
If we observe the noisy signal, we can actually tell which spikes are the true R waves. In addition, beside the true R waves, there is often a wider spike, which is caused by walking. The R waves can be recognized that they are narrower and occupy fewer bands. Instead of using BPD or DWT, signal component separation using BP with STFT is suggested to apply. Basically, that method is used to separate the signal into 2 components according to their frequency features. In order to split the noise and real ECG signal, two transformations are made which are based on STFT with windows of different length.
Basically, 3 kinds of parameters are supposed to be taken into account. The first one is the length for short and long windows. As the entire data has 4000 samples with 500 Hz sample rate, we do not need a very long window to reach a very high frequency resolution. In general, shorter windows have less information but can be more localized in time so it is thought the shorter window can catch the R waves. there are many options for the short and long windows. We consider the short window can be 8, 16 and 32 samples and long window can be 128, 256 and 512 samples.
Another important parameter is the overlap for window. In order to minimize the effect of leakage during fft for each window, people usually do 50% of overlap when processing. In this case, testing for 50%, 75% and 87.5% will be discussed.
μ1 and μ2 are determined the threshold in the BP which makes them important. The default values for μ1 and μ2 are 20 and 50 respectively. Thus, we do not need to change them significantly. The options for μ1 are and for μ2 are 0.5, 10, 20, 50 and 100.
What is more, in order to make the comparison clear, use the number of true beat detection (TP), the number of false detection (FP) and the number of true beats that are failed to be detected (FN) to evaluate the ECG signals after QRS detection. In addition to that, the mean, maximum and minimum value, and variance of RR intervals are measured according to different values of parameters will be calculated. Ideally, we want those values close to the reference one and the variance is as small as possible.
Windows’ Length
From the table 4, it can be found that for 512 samples long window, there is less information kept in component 1. A few R waves are detected and most of true beats are failed to be detected. The reason for that problem is that if we increase the length of long window, the locality of the signal will be ignored. Although we need a long window to capture the big bumps , it cannot be too long. Obviously, 16 samples short window and 256 samples long window has the best performance as 7 true R waves are detected which is the biggest among the 6 cases.
Overlap
[[File:table222.jpg]|thumb|center|Table 2: Result]]
Table above shows the evaluation result of using different overlap. It is clear that the 87.5% of overlap is the best option in this case.
The μ1, μ2 Parameters
From signal 16-25 in table 6, it can be seen that the value of μ1 cannot be too big as it will cause the more false R wave and less true R wave to be detected. That is because the μ1 is to control the threshold of component 1. If it is too large, the unwanted component will be kept in component 1. For μ2, it is opposite as it should be large enough to keep the unwanted component in component 2. Therefore, from the table, when μ1=10 and μ2=100, the mean values is close to the reference one and have a small variance. The reason for the minimum value is so small is because of false R wave detection which maybe locate between two true R waves detection and that will make RR interval small. Therefore, 16 samples short window and 256 long window with 87.5% overlap, μ1=10 and μ2=100 can make a good performance in the walking case.
Jumping case
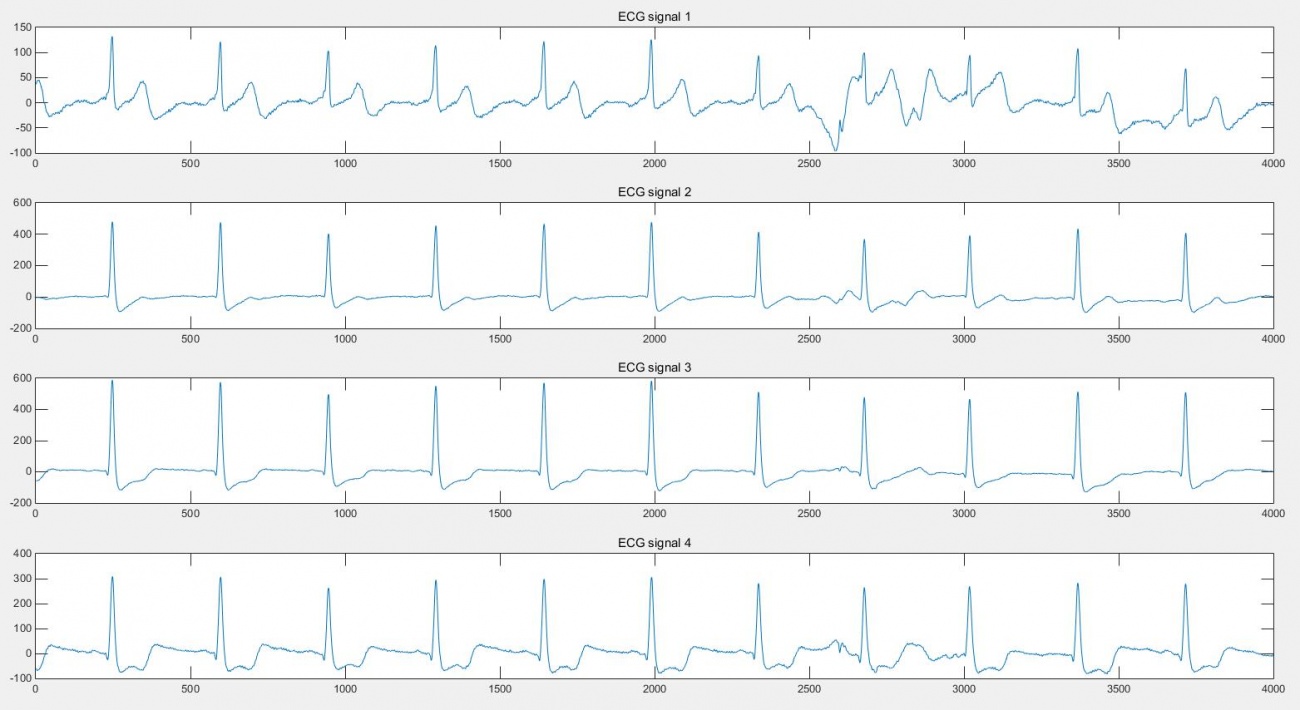
Keep the setting of parameters the same as walking case. The below figure shows the 4 ECG signals which are measured from a man doing a jump.
From the ECG signal 1, the signal between 2500 and 2700 samples is corrupted because of jump. Take ECG signal 1 as noisy signal and ECG signal 3 as reference signal.
It is clear that the false detection is solved.
Abdominal and Direct Fetal ECG Database
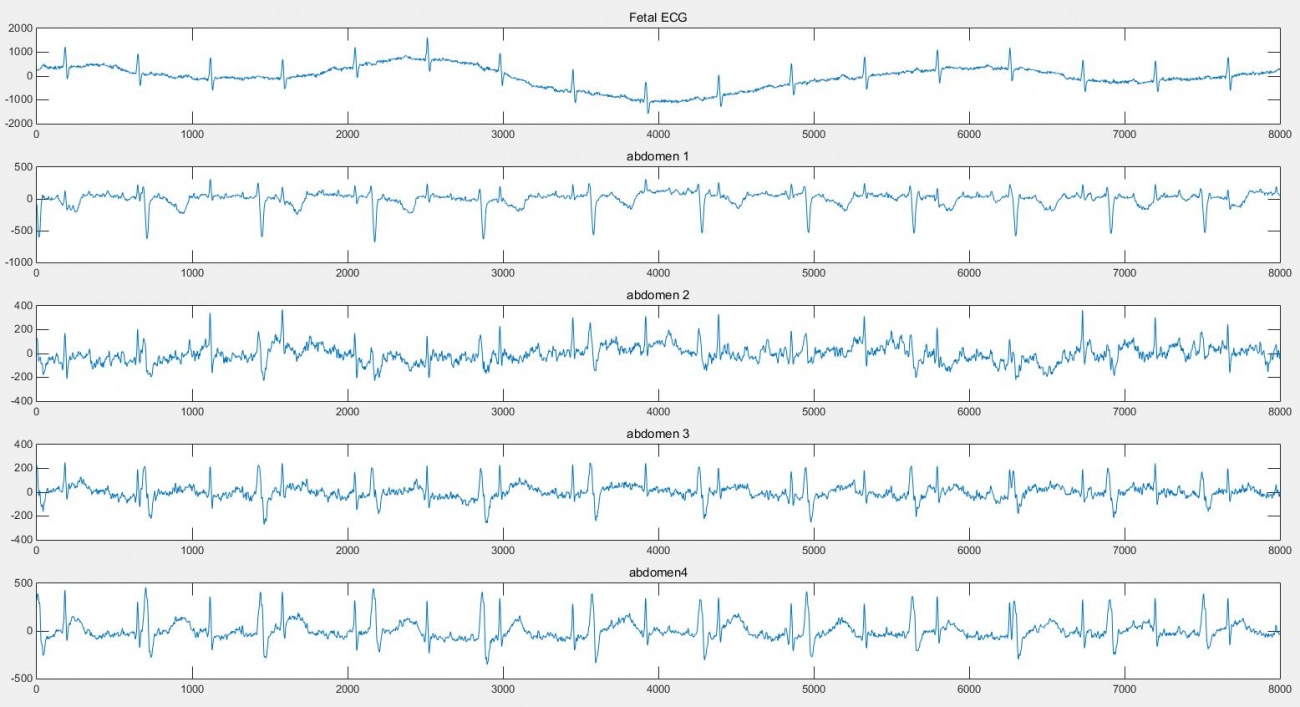
From the above figure 30, the top signal is the reference direct fetal ECG from the fetal head which also contains artefact and the following 4 signals are acquired from maternal abdomen. It can be seen that in the signals acquired from maternal abdomen, the maternal ECG is dominant. In addition, the heart rate of baby is bigger than the mother’s. The fourth signal acquired from maternal abdomen is chosen to be tested as the fetal ECG is the most clearest than others.
The dual BP does not perform well because it is based on the morphology but the shape of fetal ECG and maternal ECG are quite similar so the dual BP is not suitable.
Conclusion
In this thesis, ECG enhancement methods which are called BP and BPD are mainly proposed which are capable of dealing with the overlap of signal and noise bandwidths, and non-stationary artefacts. In order to solve the BP and BPD problems, a convex optimization problem, namely SALSA, is introduced. The key of BP or BPD is to find transform where the desired signal is sparse but the unwanted components are not. Use the BPD with FFT, the noise such as Gaussian noise can be reduced. What is more, the signal can be separated based on BP and STFT which is named dual BP.
The performance of the methods is applied to 4 databases and the result is evaluated by the RR intervals measurements from QRS detection. First, the BPD is tested with ECG-ID database which is not satisfied even though the DWT is attempted because the noise is sparse after those transformations as well. Therefore, instead of the sparsity-based method, simple notch filter is adequate. The second database is implemented by my partner Yang Lin and the third database which is motion contamination database is achieved by using the dual BP with suitable parameter setting. Although the noise cannot be fully extracted, the result is acceptable. Therefore, the sparsity-based method in this case can deal with motion artefact and enhance the ECG. The abdominal and direct fetal ECG database is more difficult. The dual BP is applied but as the maternal ECG is the issue which has the similar characteristic as the fetal ECG, that method is not satisfied.
For the future work, the noisy ECG signal can be pre-processed before the sparsity-method. For instance, ECG in the motion artefact contaminated database can be filtered by a band-pass filter to eliminate baseline wander and high frequency noise before applying the dual BP. We can also find a method to suppress the maternal ECG in the mixed one.
References
[1] Mike Cadogan, Chris Nickson, ECG Basics [online]. Available: http://lifeinthefastlane.com/ecg-library/basics/.
[2] Xiaoran Ning∗, Ivan W. Selesnick, ”ECG Enhancement and QRS Detection Based on Sparse Derivatives”, Biomedical Signal Processing and Control 8 (2013) 713–723.
[3] Jiapu Pan, Willis J. Tompkins, “A Real-Time QRS Detection Algorithm”, IEEE TRANSACTIONS ON BIOMEDICAL ENGINEERING, VOL. BME-32, NO. 3, MARCH (1985) 230-236.
[4] Gary M. Friesen, Thomas C. Jannett, Manal Afify Jadallah, Stanford L. Yates, Stephen R. Quint, H. Tory Nagle, “A Comparison of the Noise Sensitivity of Nine QRS Detection Algorithms”, IEEE transactions on biomedical engineering, VOL. 37. NO. 1, January (1990) 85-98.
[5] Ivan W. Selesnick, OpenStax-CNX, “Introduction to Sparsity in Signal Processing”, 2012 [online]. Available: http://cnx.org/contents/ebrPDbgd@3/Introduction-to-Sparsity-in-Si.
[6] CHEN G., TANG M-h, CHENG H., and GE M., “An ECG Denoising Algorithm Based on Morphology and Wavelet Transform”, Computer technology and development, vol.22, no. 2,(2012), pp.100-102.
[7] V. Almenar and A. Albiol, “A new adaptive scheme for ECG enhancement”, Signal Process. vol. 75 no. 3, (1999), pp. 253-26.
[8] A.K. Barros, A. Mansour and N. Ohnishi, “Removing artifacts from electrographic signal using independent components analysis”, Neurocomputing, vol. 22, (1998), pp. 173-186.
[9] Goldberger AL, Amaral LAN, Glass L, Hausdorff JM, Ivanov PCh, Mark RG, Mietus JE, Moody GB, Peng C-K, Stanley HE. PhysioBank, PhysioToolkit, and PhysioNet: Components of a New Research Resource for Complex Physiologic Signals. Circulation 101(23):e215-e220 [Circulation Electronic Pages; http://circ.ahajournals.org/cgi/content/full/101/23/e215]; 2000 (June 13).
[10] Lugovaya T.S. Biometric human identification based on electrocardiogram. [Master's thesis] Faculty of Computing Technologies and Informatics, Electrotechnical University "LETI", Saint-Petersburg, Russian Federation; June 2005.
[11] Moody GB, Muldrow WE, Mark RG. A noise stress test for arrhythmia detectors. Computers in Cardiology 1984; 11:381-384.
[12] Vahid Behravan, Neil E. Glover, Rutger Farry, Mohammed Shoaib, Patrick Y. Chiang. Rate-Adaptive Compressed-Sensing and Sparsity Variance of Biomedical Signals. Body Sensor Networks (BSN) 2015 IEEE International Conference in June 2015.
[13] Kotas M, Jezewski J, Matonia A, Kupka T. Towards noise immune detection of fetal QRS complexes. Computer Methods and Programs in Biomedicine. 2010 Mar; 97(3):241-256.
[14] Manya Afonso, Mário Figueiredo, José Bioucas-Dias, SALSA and C-SALSA,2012.
[15] Chun-Lin Liu, A Tutorial of the Wavelet Transform, February 2010.
[16] Dr. Dallas Price,”How to read an Electrocardiogram (ECG).Part One: Basic principles of the ECG. The normal ECG”,South Sudan Medical Journal,2010 [online]. Available: http://www.southsudanmedicaljournal.com/archive/may-2010/how-to-read-an-electrocardiogram-ecg.-part-one-basic-principles-of-the-ecg.-the-normal-ecg.html.
[17] Leif Sornmo, Pablo Laguna, “ELECTROCARDIOGRAM (ECG) SIGNAL PROCESSING”, Wiley Encyclopaedia of Biomedical Engineering, 2006.
[18] Ajay Bharadwaj, Umanath Kamath, “Techniques for accurate ECG signal processing”, Cypress Semiconductor Corp., 2011.
[19] Simon Haykin, Adaptive Filter Theory, Ed. 4, Prentice-Hall, 2002.
[20] Guodong Chen, Xuzhi Wang, Wanggen Wan, “An ECG R-wave Detection Algorithm Based on Adaptive Threshold”, School of Communication and Information Engineering, Shanghai University, China, 2004.
[21] Thuraisingham R. A., Preprocessing RR interval time series for heart rate variability analysis and estimates of standard deviation of RR intervals, Comput. Methods Programs Biomed. 83, 78–82, 2006.
[22] Troy B.,Larry B.,Junken K., Dwain E., “Important influence of respiration on human R-R interval power spectra is largely ignored”, Departments of Medicine and Physiology, 75(5):2310-2317.1993.
[23] Jezewski J, Matonia A, Kupka T, Roj D, Czabanski R. Determination of the fetal heart rate from abdominal signals: evaluation of beat-to-beat accuracy in relation to the direct fetal electrocardiogram. Biomedical Engineering/Biomedizinische Technik 2012 Jul; 57(5):383-394. doi:10.1515/bmt-2011-0130.
[24] Kotas M, Jezewski J, Matonia A, Kupka T. Towards noise immune detection of fetal QRS complexes. Computer Methods and Programs in Biomedicine. 2010 Mar; 97(3):241-256.
[25]Selesnick, I.W.; Baraniuk, R.G.; Kingsbury, N.C., The dual-tree complex wavelet transform, 2005.
