Projects:2016s1-142 Code Cracking: Who Murdered The Somerton Man?
Contents
- 1 Topic
- 2 Supervisors
- 3 Team members
- 4 Abstract
- 5 Acknowledgements
- 6 Task 1 Code Analysis by Yifan
- 7 Task 2 Mass Spectrometer isotope Data Analysis by Yami
Topic
Code cracking and data analyzing.
Supervisors
Prof. Derek Abbott
Dr. Matthew Berryman
Team members
Yifan Ma
Yami Li
Abstract
On the morning of 1st December 1948 , the corpse of an unidentified man was found on the Somerton Beach. The project is aiming to break this unsolved case by analyzing the two key clues: the mysterious code and the Somerton Man's hair. Firstly, based on the previous project group's conclusion that the code was initialisms (first letter of each word), the code has been critically analyzed. It was expected to find out which language the code was expressing by calculating the similarities between the code and varies of texts in 9 different languages and analyzing the results statistically. The other aspect of this project was dealing with the mass spectrometer isotope concentration data. The hair data with respect to different elements' contents were obtained through burning and scanning hairs of the Somerton man and the control group. Data from the glass and the quartz plate test are analysed. Theoretically the purity of the quartz plate is higher, as a result the results of spectral analysis should be more accurate. However, in view of the fact that the hair sample of the quart plate test was not complete compared with the glass plate test. Thus, the test data from both experiments are utilized for a comparative analysis. The hair data comparison between the Somerton man and control samples are processed by Matlab.
Acknowledgements
The authors would like to thank Prof. Derek Abbott for his kind advice and helps. Also thank James Chapel for his assistance on data analyzing and visualization; thank Dr. Hong Gunn Chew for his coordination through the whole process of the project. In addition, the author would like to acknowledge the PCs and software provided by the University of Adelaide, and all the open-source software that were used in this project, they are Java (SE), R and Gedit from GNOME.
Task 1 Code Analysis by Yifan
1. Introduction
In this project, data comparison and statistical data analysis techniques were applied to crack a set of mysterious code extracted from an unsolved possible murder case. Data comparison is a branch of computer science, which calculates the differences and similarities among data objects, personified in this case: among a large amount of strings. Data analysis is to extract useful information from data to help generating conclusion and giving supports to it. The goal of this project is to find out in which language the code was written. Initially, the contributions accomplished by previous project groups were reviewed and an insight was found to be a perfect beginning point of this project: it was suggested and supported that the code was very likely to be initialism in English, meaning that the code consists of first letters of a set of English words [1]. It was an amazing guess but unfortunately two problems were found after the reviewing of their works. Despite that the method applied to calculate similarities was lacking of convincing, it had not been updated for a long time. Besides, the test numbers were insufficient to draw out any conclusions. Considering that similarity check algorithm is the most important component in this project, a large amount of time was spent on finding and testing a reliable algorithm. Several similarity check algorithms were researched and two of them were picked out to carry out the test. The carefully selected two algorithms should be good enough to discuss this case. To deal with the other problem the test was designed to repeat multiple many times in order to get unbiased result. Writing scripts in Java simplified the repeating tests significantly. At the meantime, the hint from Professor Derek Abbott suggests to reduce the number of languages being considered in tests, which makes it possible to concentrate on the testing of several highly suspected languages. The contributions in this project were listed as follow: Selected and realized the Levenshtein Distance and the Simhash Algorithms using Java, which give output similarity values of two input text strings. Classified and normalized the text materials for performing tests to suit the selected algorithms. Applied statistical analysis to tests results and gain sufficient support that the code was initialisms written in English. Paper Summary: The next section (Section 2) contains the detailed background of the project. Section 3 explains the principles and implementations of two algorithms. The design, implementation and analysis of tests are presented In Section 4. Conclusion is arranged to Section 5. Acknowledgements and future works are presented in Section 6. References are in Section 7.
2. Background
2.1 About the Case
The project is aiming to break an unsolved case of an unknown man found dead on Somerton beach, Glenelg. The victim, also known as the Somerton Man was found dead at 6.45 on 1st December, 1948.
After investigations the SA Police found a small wrinkled piece of paper in the man's pocket, with the Persian phrase “Tamám Shud” (translated to English: to the end)printed on it. The paper scratch was later confirmed to be part of an uncommon version of the Rubaiyat of Omar Khayyam book. Soon after the man's being found, the book was also found in the rear seat of an unlocked car parked 3 km away from the location of the corpse.


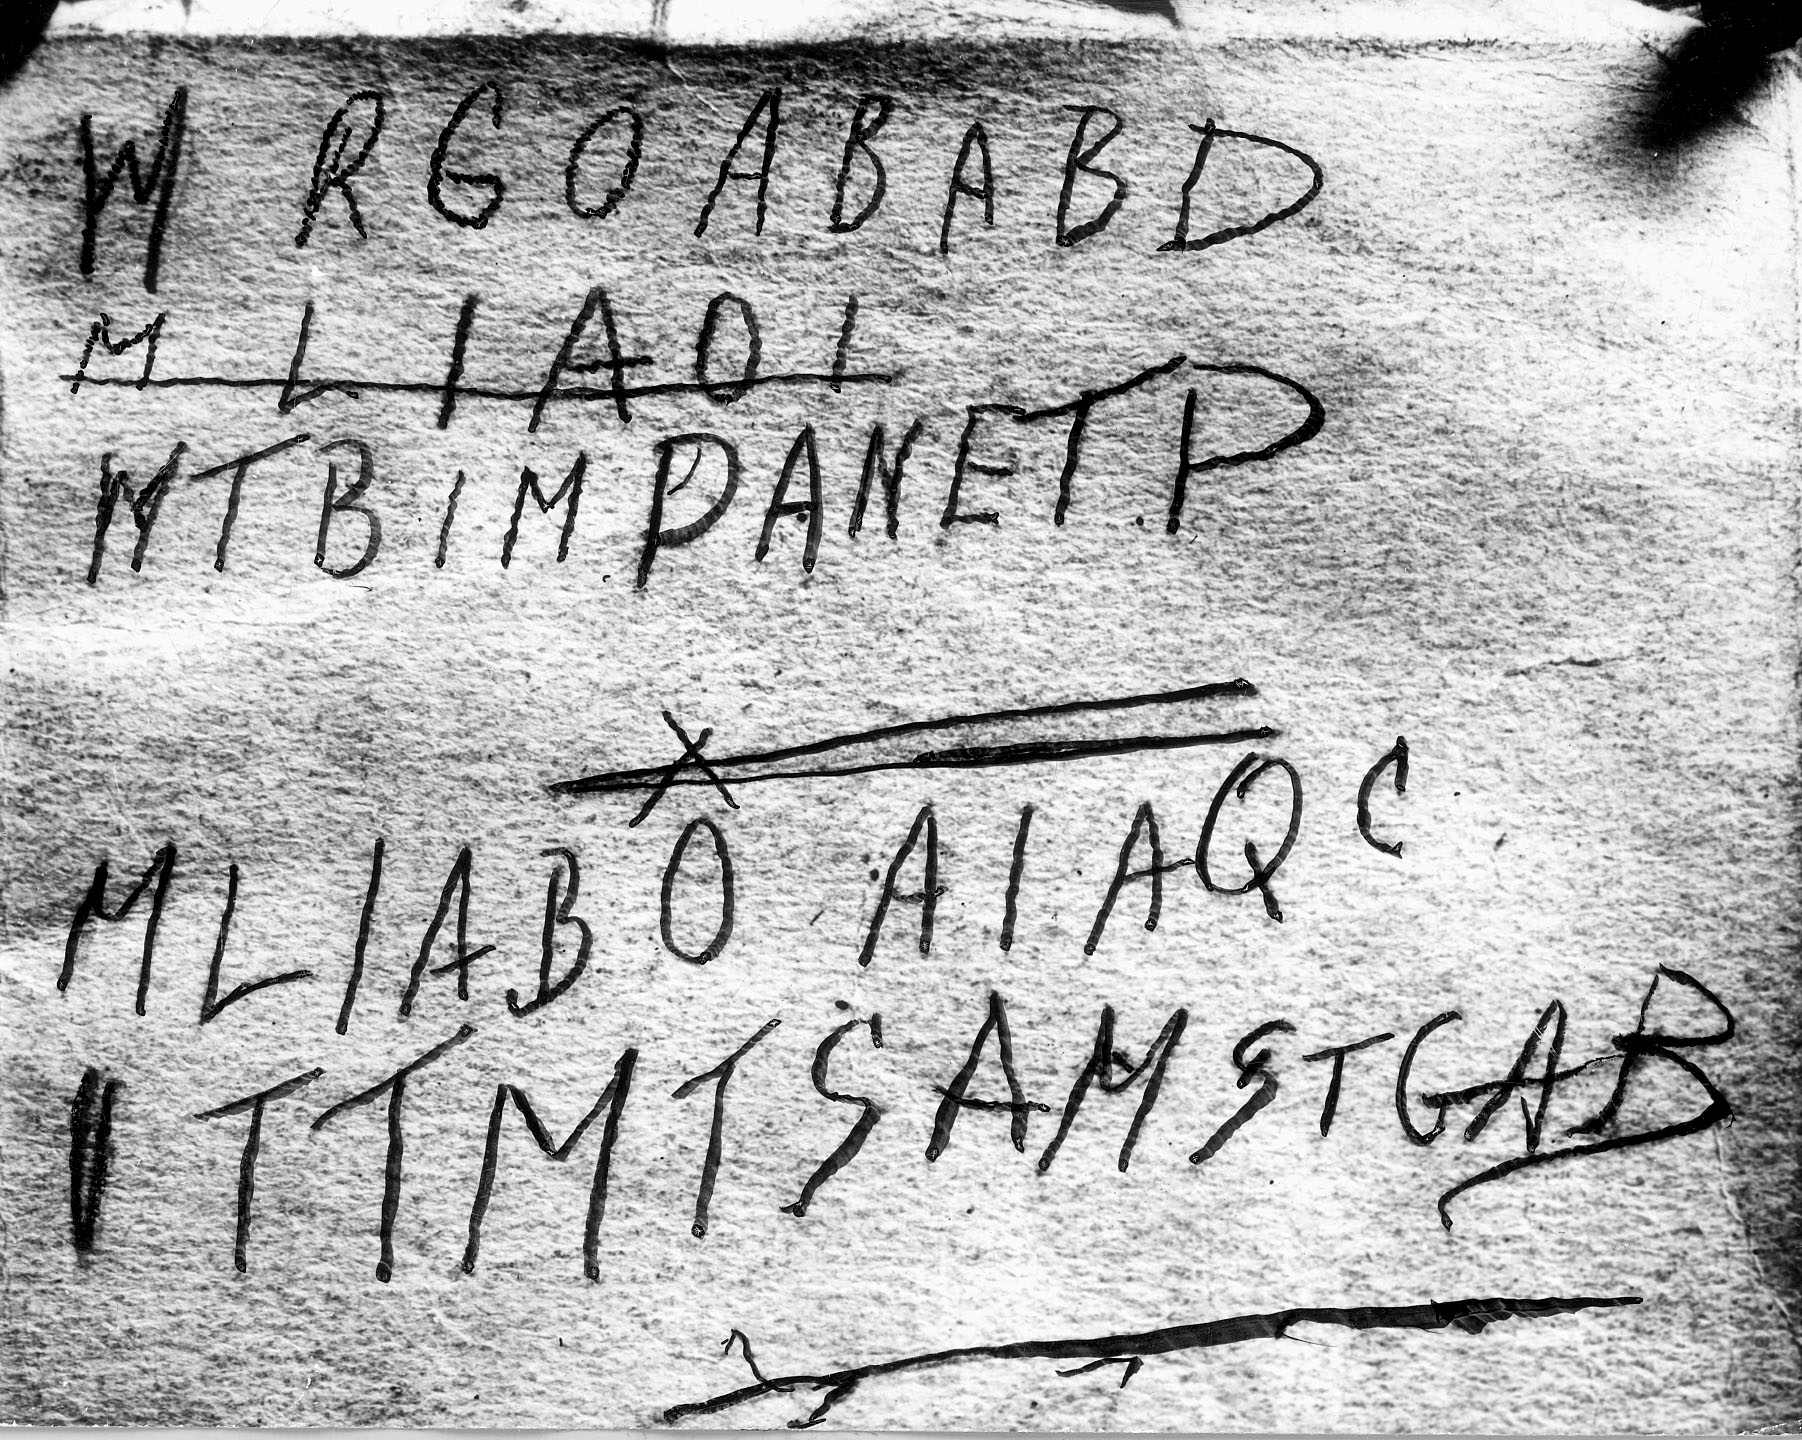
Despite the language, the book was not much different from ordinary books, but what really interesting was the handwriting of a set of mysterious code found on the back of the book. Considering that the main theme of the Rubaiyat of Omar Khayyam was about that people should not have any regrets when they die, combined with the meaning of the phrase on the paper scratch, it is widely believed that the book is strongly related to the dead man. Hence the case was widely known as the Tamam Shud case [4].

As the figure above displayed, the code consists of fifty capital letters. For the sake of getting as many samples as possible the six crossed out letters are also included. There has been a dispute about the ambiguous “M” or “W” letters appear in the code, as a result two different versions of the code was tested (one with “M” and the other with “W”).
2.2 Previous Works
2.2.1 Australian Department of Defence
In response to the request from journalist Stuart Littlemore the Australian Department of Defence had worked on cracking the code left in the Tamám Shud case. Unfortunately after a time of working the cryptographers defined the code as unable to crack. The code was said to either “have insufficient symbols” or it was just a meaningless product generated under a “disturbed mind” [6].
2.2.2 Previous Groups in the University of Adelaide
As Professor Derek Abbott has been following this case for a long time, there were several project groups that had been working on this unsolved case from 2009 to the present. The conclusions drawn out by previous groups are: the code is unlikely to be generated randomly, the code is unlikely to be initial letters from words, the book Rubaiyat of Omar Khayyam was unlikely to be used as a one-time pad for encryption, the original language of the code is likely to be English, the code is unlikely to be initialisms extracted from poems, the book Rubaiyat of Omar Khayyam was not used as a straight substitution one-time pad for encryption and the code was not created using the Rubaiyat of Omar Khayyam as a one-time pad.[7][8][9][10][11][12]
2.3 Motivation
As the previous chapter stated, this project is relating to an unsolved possible murder case which has been remaining in the public’s interest for almost 70 years. Just like Professor Derek Abbott, all the group members that have joined in this case must be extremely curious about the mysterious case. The desire of finding out the truth would be the most important motivation of undertaking this project. Another motivation comes from the ethical consideration. The victim has been resting in West Terrance Cemetery without a name for decades. It will be meaningful if the identity of the victim could be unveiled. This is also for the victim’s family whom lost their relative and probably had no idea about it.
3. Technique Details
Here introduces several key concepts and techniques that have been applied in this project. As the main purpose of this thesis should not be algorithm engineering, the algorithm part is made as simplified as possible.
3.1 Hamming Distance and Levenshtein Distance
The two concepts were introduced from Information Theory. Both of them describe the amount of differences between two strings. The Levenshtein Distance is applied to calculate the difference between two strings that consist of letters, while the Hamming Distance is used to compare two binary strings with same length. The Hamming distance measures the minimum time of calculations (substitutions, precisely) required to transform string A into string B. For example, the Hamming distance between “1010” and “0010” is 1 as it requires substituting the first bit '1' in the first string with '0'. In this case the calculations of Hamming distance are based on pure binary strings so the Hamming distance can be easily expressed as H(a, b) = a XOR b. The Levenshtein Distance, also known as edit distance, is an enhanced version of the Hamming Distance. It not only counts substitution, also it considers insertions and deletions. The Levenshtein distance between two words is the smallest calculation times of substitutions, insertions, and deletions of symbols that are used to transform one string into another. Here is an example demonstrating the calculation of the Levenshtein distance, substitution is marked as s and d stands for deletion, i for insertion. String1: INTENSION, string2: EXECUSION.
           INTE#NSION
           ||||||||||
           #EXECUSION
           ||||||||||
           dss-is----
       Table1. Levenshtein distance
According to Table1, the minimum cost to turn string1 into string2 is 5: 3 substitutions, 1 deletion and 1 insertion. As the Levenshtein Distance considers three kinds of calculations, the complexity is inherently higher than the Hamming Distance.
3.2 Simhash Algorithms
3.2.1 Brief Introduction of Simhash
The Simhash algorithm was originally invented by Moses Charikar. It was invented to estimate the similarities of a large volume of data [13]. Later the Simhash was applied by Google as their duplicate removal algorithm to deal with Google's massive data. Charikar's algorithm has been proved to be practically useful for identifying near-duplicates in web documents belonging to a multi-billion page repository [14] in Google's thesis. The idea of the Simhash algorithm are extremely condensed, it is even easier than the algorithm of finding all fingerprints with Hamming Distance less than k in Google's thesis mentioned above. As the algorithm performs well in similarity check, it is adapted here to calculate the similarities of 2-grams strings in tests.
3.2.2 Why Simhash?
Traditional similarity check algorithms use Vector Space Model to separate documents into individual terms, allocate these terms into their corresponding vectors in multidimensional space. Each dimension indicates an individual term. Values of these vectors are calculated by a specific algorithm based on the terms, mostly based on the occurrence frequencies of terms, high frequency terms will be assigned a relatively larger value. Algorithms may differ but the Vector Space Model is static. After the modeling text will be transformed into a set of vectors.

Figure 4 illustrates an example of the modeling of Vector Space Model, d1 and d2 represent two texts that have already been modeled. The two documents’ similarity can be found by calculating the Cosine Similarity of their corresponding vectors (dot product of the two vectors divided by the product of the two vectors’ Euclidean lengths): Similarity <d1, d2 > = cos(theta(d1,d2) ).
Notice that the usage of a 2-D dimension was just for illustration purpose. In practice the number of dimension can be a much higher value, but the principle will be all the same. It has been proved that the Vector Space Model brings accurate estimation of the similarities, but this comes at the expensive of the exceptional high complexity in both time domain and space domain. Modeling long texts into vectors will certainly take up a large volume of storage; on top of that, each similarity value is generated by calculating the cosine value of two vectors. Obviously it is not a wise choice when dealing with data that contains a large amount of terms. Using SimHash algorithm could reduce the complexity significantly while preserve the accurate estimation of similarities.
Before explaining the Simhash, it is necessary to introduce the Hash function. A Hash function mappings different data of arbitrary size into totally different hash values of a fixed size. After hash mapping each term will be allocated a unique hash value as its fingerprint. A well-defined Hash function should be collision-resistant, which means that it is impossible to find two data sets that will generate identically the same Hash values. Also, the Hash function should be sensitive to trivial changes. Even the string changes only one bit, the Hash value will be totally different.
Here explains the Simhash algorithm in details. The figure below demonstrates the general processes of calculating the Simhash fingerprint of a given document. 1. Firstly the original document (big blue box) will be separated into n individual terms (small blue bars). The rule of separating can be customized in different cases. Here, in the next tests the document will be separated into 2-grams letter groups. 2. Now the separation has been done. For each term, calculate its corresponding weight (w1, w2, … wn). Normally the weight is determined by the frequency of occurrence of each term. The weight can also be customized to meet specific requirements. 3. For each individual term and its corresponding weight: Apply hash mapping to each term (the length of hash mapping (n) could be adjusted by adjusting the segmentation method in step1, Google used 64-bits hash mapping in its webpage duplication remove program), then multiple the n-bits hash mapping result with the corresponding weight, '0' in hash mapping result will be treated as '-1' and '1' stays unchanged. 4. Finally, add all the results generated in the previous step together. Here the result is a string consists of n numbers. The final fingerprint is also an n-bit long binary string. For each number in the string, if it is positive then set its corresponding bit in the final result to '1', otherwise set the bit to '0'.
- 5. The similarities of two strings are then generated by calculating the Hamming Distance of two
Simhash strings.

This is how the Simhash algorithm mappings a given long text into an n-bit long fingerprint. After the previous illustration, the geometric meaning of this algorithm is quite explicit: Firstly it mappings the long text into an n-dimension space, each individual term is transformed to a vector in the space. By using hash mapping, all the terms could be guaranteed to be transformed into a set of vectors which can be seen as nearly uniformly distributed. By multiplying weights and summing up together, the result can be called as a “sum-vector”. The “sum-vector” is then compressed by mapping positive values to 1 and others to 0, this operation is actually preserving the quadrant information of the “sum-vector”. Assume that n = 64, a 64-bit long fingerprint can express as many as 264 quadrants, which seems to be enough to represent a specific document. Theoretically the algorithm is reasonable, but the reason why the n-bit fingerprint has the ability to manifest similarities between documents is still unknown. Nor did Charikar (The inventor of the Simhash algorithm) give out any justification. Nevertheless, tests that have been done illustrates that the Simhash algorithm actually does a good job in similarity estimations. Here presents a simple example of similarity estimation based on the Simhash algorithm and the Hamming Distance.
String A (initialism of the lyrics of “Bohemian Rhapsody” by Queen), String B (copied from String A with 3 letters modified) and String C (an arbitrary string) are strings being tested in the Simhash algorithm.
String A: ITTRLITJFCIALNEFROYELUTTSASIJAPBINNSBIECEGALHLLATWBDRMTMTM String B: ITTRQITJFCIALNEFRQYELUTTSASIJAPBINNSBIECEZALHLLATWBDRMTMTM String C: KAYCDRKBPQOGVTAACDUQKXJNZNZMXCBNUKPHVODWUUSQGJZFFYUKHBDMFY
After the 2-grams separation, the Simhash of each strings were presented below (red characters indicate the differnces): SimHash of A: 100111001000100001111000011010110111100011011110001001 SimHash of B: 100111001100100001111000011110110111100011011110001001
SimHash of A: 100111001000100001111000011010110111100011011110001001 SimHash of C: 100110101011010101101100011001001110000111111111001010
By observing, the Hamming Distance between two Simhash strings of A and B should be 3, which is low enough to indicate that the two strings are extremely similar. Actually they are extremely similar (only 3 letters out of 59 were different). While the Hamming Distance between A and C is 21, indicating that the two strings A and C are unlikely to have any similarities.
4. Tests
There are mainly two aspects of tests in this project, the Direct Comparison Test and the 2-grams Comparison Test. Nine different languages are selected and tested, they are English, Italian, French, German, Portuguese, Latin, Spanish, Turkish and Polish. As this section may be too long and disturbing, here presents a simple chart for the navigation usage in Figure 6.

4.1 Levenshtein Distance Test
The comparison method of this section is calculating the Levenshtein Distance between two initialism strings directly. Materials used for comparison, length of string and comparison time may vary based on the purposes of setting up each test.
4.1.1 Data Processing
All the materials for this test were transformed into Initialisms format, with all punctuations and spaces removed, for example: Original Text: “Snow is falling, all around me, children playing, having fun…” Initialisms Format: “SIFARMCPHF…” Initialisms were then divided into segmentations of a given length. Each segmentation is referred as ‘unit’ in the next sections.
4.1.2 Preparation Test
It is always necessary to check if the method for tests is effective before starting any tests. Hence the purpose of this section is to prove that the Levenshtein distance algorithm has the ability to revealing the differences between different languages. Units of a fixed length extracted from English version and eight different language versions of the War and Peace were compared. To make it comprehensive, there are six groups of tests with different length varies from 50 letters/unit to 800 letters/unit and in each length group there are 100 times of comparison (10 units of one language compared with 10 units of another language one by one using a double ‘for loop’ ). Each unit was uniquely selected from texts without any overlapping. Results of these tests are normalized with the unit of length = 50.
The result of the tests was presented in boxplots in the figure below (Language names were abbreviated, En stands for English, It-Italian, Fr-French, Ge-German, Pq-Portuguese, La-Latin, Sp-Spanish, Tr-Turkish and Po-Polish). Each box is a set of the output Levenshtein Distances between two texts. For example, the leftmost box represents the test results of 10 English units versus another 10 English units; same rule applies for the others.

By analyzing the five box plots above in the Figure Group 1, the following conclusions can be inferred: 1. In all the five figures, the leftmost boxes are significantly lower than the others, which mean that the Levenshtein distances between English strings are much lower than those between English strings and strings of other languages. Hence, the Levenshtein Distance is able to manifest the difference between different languages.
2. As the unit length grows the boxes become lower and more compact (median value and standard deviation shrink when unit length goes up). Some of them even converged into a specific value. In addition, the difference between the last two plots (unit length = 400 and unit length = 800) is trivial. It means that the Levenshtein distances tend to be stable as the length of the unit increases.
3. When increasing the unit size, the trends of the nine language groups are highly similar: median values of the Levenshtein Distances decrease as the unit size increases. This implies that the performance of the Levenshtein Distance algorithm is independent with different languages.
4.1.3 Main Test
The previous section has proved that the Levenshtein Distance actually can reveal the differences between languages. Based on this, the test in this section is to find out the difference between the mysterious code and texts of varies language. In the experimental group (line plots in figures), two versions the mysterious code were compared with 100 units of different languages extracted from the War and Peace. As the code is only of 50 letters long, there is no need to carry out the test in different unit length. In the comparison group (box plots in figures), units extracted from the UDHR were compared with the same materials in the experimental group. Like the preparation test, this test was also divided into 6 different length groups. 100 times of comparison was made, the 10 vs 10 double for loop structure was also preserved here. The reason why Latin language was not tested is because that the Latin version of the War and Peace was not found, and lacking of material for the control group test would affect the confidence. Results are presented in the following figures. The horizontal line indicates the mean (average value) of the experimental group’s result and the boxes indicate results of the comparison group. For example, in the first plot: the six boxes represent the test result of UDHR units in English versus War and Peace units in English in six different length groups. Two lines indicate the test result of two versions of code versus units of War and Peace in English. The “Codes vs English” test results (red and green lines) appear in every plot as a reference.

The following interesting phenomenon could be observed from the Figure group2 above:
1. Observing within each plot: both the median value and the standard deviation fall as the unit length increases. This trend fits reasonably well with the trend of the preparation test (the one mentioned in the 2nd conclusion of section 4.1.2). 2. Observing from the second plot to the last plot: there are distinct gaps between the Levenshtein Distances of codes versus English text (red and green lines), and the Levenshtein Distances of codes versus other languages (blue and purple lines). 3. Among all the languages tested except English and Turkish tests, results of the experimental group are consistently higher than results of the comparison group. In addition, experimental group’s result in Turkish was significant higher the one in English. 4. Observing inside of the English test plot and the Turkish test plot: both the two groups of lines located around the median value of test result in 50 letters length group. Conclusion:
According to the aforementioned phenomenon, the corresponding inferences can be drawn out: 1. The similarity of two trends reveals that the Levenshtein Distance algorithm does not sensitive to different testing materials. On the other hand, the relatively higher standard deviation in 50 letters group implies the higher randomness in small length tests. Notice that results of the experimental group are literally of 50-letters group. This reduces the credibility of the whole test. 2. Within the scope of the experimental group, the mysterious code has relatively smaller Levenshtein Distance with English text compared to those with other languages. 3. The differences between results of experimental and comparison groups in six languages (German, Italian, French, Portuguese, Spanish and Polish) imply that the code is unlikely to be one of these languages. 4. In English and Turkish test results, the overlapped results from experimental and comparison groups imply the consistencies of the Levenshtein Distances between ‘Code vs War and Peace’ and ‘UDHR vs War and Peace’.
4.1.4 Conclusion of the Levenshtein Distance Test
According to the previous analysis, the code has more possibility to be initialisms of English or Turkish text, rather than of texts in other languages. In addition, considering the higher Levenshtein Distance in “code vs Turkish” test, being initialisms of English is more possible than being initialisms of Turkish. On the other hand, the credibility of the test was challenged by the existence of randomness in small length group test. Hence the conclusion that the code is more likely to be English should be considered cautiously.
4.2 2-grams Simhash Test
Though the previous test has drawn out some useful conclusions, its lacking of credibility is still unacceptable. As a result, the 2-grams test with another algorithm (SimHash algorithm) has been designed and implemented. The test is expected to give supports to the conclusion drawn out in the previous Levenshtein Distance Test. In the meantime, it is expected to have a better credibility.
4.2.1 Data Processing
Another difference was that texts for this test were rearranged into the 2-grams format based on the initialisms format in the previous test. For example: Original String: “The visions dancing in my mind the early dawn the shades of time …” Initialisms format: “TVDIMMTEDTSOT ...” 2-grams format: “TV VD DI IM MM MT TE ED DT TS SO OT T…”
4.2.2 Preparation Test
Just like before, the preparation test was designed to check the performance of algorithm. Unlike the Levenshtein Algorithm, the grouping of test based on unit length is meaningless. This is because of the nature of the Simhash algorithm. For details please refer to section 3.2.2. The preparation test was based on the UDHR. In the first test: it compared 50 units extracted from the English version of UDHR with the whole text of UDHR (2-grams formatted as well) in both English and other languages, by firstly turning each unit to its corresponding Simhash string, then calculating the Hamming Distance between two Simhash strings. In the second test, the same method and layout are used again to compare 50 units with the whole text of UDHR in the same kind of language. To make it simple, test 1 is a cross-language test while test2 is a same-language test. Results were presented in the two box plots below (apologize for the being out of order of the x-axis; please make comparisons according to the column names under each box):

Comparing inside the cross-language group (Figure 20): the data set of “English versus English” (the more transparent box located at the bottom-right of the first figure) is considerably lower than other cross-language data sets (colored boxes in the first figure).
Comparing across the two figures (Figure 20 and 21): it is easy to find out that the cross-language group has generally higher results than the same-language group (Color schemes in two figures are not the same , please refer to the column names when doing comparison). Median values of boxes in same-language group are all significantly lower than those in the cross-language group. All third quartiles (Q3) in the same-language group are lower than first quartiles (Q3) of the corresponding language group in the cross-language group.
In addition, data sets in figures above are less biased compared to those in Levenshtein Test. Distributions of data in each boxplots are quite compact. The Simhash Algorithm is not sensitive to different languages. These facts give extra credibility to the Simhash algorithm. Based on the aforementioned observations, it is reasonable to draw out the conclusion that the Simhash Algorithm has an excellent ability of distinguishing different kinds of languages.
4.2.3 Main Test
Here, the two versions of the mysterious code are tested against the UDHR in different languages. For each version of code, it was compared to different language versions of the UDHR. Results are presented in the first bar chart. Pink represents the first version of the code and blue represents the other one. (Each bar actually consists of two sub-bars, length of sub-bar represents each result, and there is no overlapping between sub-bars). As there is little difference between pink and blue bars, the average value in each language group is taken. For comparison purpose, these average values are combined with the same-language test result, and presented in the second figure below (bars in the left figure are turned to horizontal lines in the right figure, which represent the mean value of the Hamming Distance set between code and a specific language):

Considering that the comparison between two versions of code and the UDHR texts may not be sufficient to draw out any convincing conclusion, the two versions of code are compared again with 12000 letters long War and Peace text in each language using the same Simhash method. As the two versions of code have extremely similar test results against a specific language, the two versions’ results are added together in each language group. Result of the test is shown below:

Figure 22 clearly showed that the Hamming Distance between English and the code is the minimum; figure 24 also presents the same characteristic. In Figure 23, there are two horizontal lines reside inside of their corresponding boxes: English and Portuguese. But compared with Portuguese, the red line that represents the result of code vs English is relatively closer to the median value of the English vs English test result set.
4.2.4 Conclusion of the Simhash Test
Based on these facts, the conclusion is that the mysterious code is more likely to be English, rather than other eight languages being tested.
4.3 Summary of Tests
In Section 4, there are generally two groups of tests presented: the Levenshtein Test and the 2-grams Simhash Test. The Levenshtein Test has given the opinion that the mysterious code is more likely to be English initialisms; but its credibility was challenged by the randomness appeared in the 50-length group test. On the other hand, the opinion inferred from the Levenshtein Test has gained vigorous support by the result in the 2-grams Simhash Test. For the secondary suspected languages which are Turkish and Portuguese respectfully in two tests. By comparing results of two tests together the suspicion can be removed. As the Turkish test result in the 2-grams Simhash test was not as conspicuously high as the one in the Levenshtein Test, nor did the Portuguese test in the Levenshtein test perform abnormally. Now, there are enough evidences to support the final conclusion that the code consists of Initialism of English.
5. Conclusions
In this project, two new algorithms have been researched and introduced to check the similarities between the mysterious code and texts of different languages. Algorithms have been implemented in Java. Text materials for each test have been gathered and arranged into ideal formats. Individual test for each algorithm has been designed and implemented. After analyzing test results the conclusion that the code consists of Initialism of English has been drawn out.
6. Acknowledgements and Future Works
This project was supported by the School of Electrical & Electronic Engineering of the University of Adelaide. The author would like to thank all the staffs who have been supporting the Final Year Project for a long time. The author would like to thank all the members in previous project groups; they had made great contributions to the project. At the very end, the author would like to gratefully acknowledge the technical support and guidance from Prof. Derek Abbott and Dr. Matthew Berryman, the project will be nothing without their generous advices and helps. Being restricted by time, a lot of meaningful works were not performed. The author will keep following up this interesting project. The next several tasks are expected to be finished: 1. Extend the two tests to other languages which have not been tested. 2. Perform more n-grams test using the Simhash Algorithm. 3. Increase the number of tests in the 50-letters group Levenshtein test to see if the randomness can be avoided.
7. References
[1]. L. Griffith and P. Varsos. (2013). Semester B Final Report 2013 – Cipher Cracking . Available: http://www.adelaidenow.com.au/news/south-australia/somerton-man-mystery-new-details-revealed-of-jo-thomson-nurse-in-the-case/news-story/4c6bccbd2318584ad0cc6daaf3d8abd4 [2]. Renato Castello, “New twist in Somerton Man mystery as fresh claims emerge,” Sunday Mail SA, November 23th, 2013. Access via Internet: http://www.adelaidenow.com.au/news/south-australia/new-twist-in-somerton-man-mystery-as-fresh-claims-emerge/story-fni6uo1m-1226766905157
[3]. Lynton Grace, “Somerton Man mystery: New details revealed of Jo Thomson, nurse in the case”, The Advertiser, 29th May 2015. Access via Internet:
http://www.adelaidenow.com.au/news/south-australia/somerton-man-mystery-new-details-revealed-of-jo-thomson-nurse-in-the-case/news-story/4c6bccbd2318584ad0cc6daaf3d8abd4 [4]. From Wikipedia, the Taman Shud Case. Access via Internet: https://en.wikipedia.org/wiki/Tamam_Shud_case [5]. From Internet: http://ciphermysteries.com/wp-content/uploads/sites/6/2014/01/SomertonManCode-wikipedia.jpg [6]. Inside Story, presented by Stuart Littlemore, ABC TV, screened at 8 pm, Thursday, August 24th, 1978. [7]. A. Turnbull and D. Bihari. (2009). Final Report 2009: Who killed the Somerton man? Available: https://www.eleceng.adelaide.edu.au/personal/dabbott/wiki/index.php/Final_report_2009:_Who_killed_the_Somerton_man%3F [8]. K. Ramirez and L-V. Michael. (2010). Final Report 2010 . Available: https://www.eleceng.adelaide.edu.au/personal/dabbott/wiki/index.php/Final_Report_2010 [9]. S. Maxwell and P. Johnson. (2011). Final Report 2011 . Available: https://www.eleceng.adelaide.edu.au/personal/dabbott/wiki/index.php/Final_Report_2011 [10]. A. Duffy and T. Stratfold. (2012). Final Report 2012 . Available: https://www.eleceng.adelaide.edu.au/personal/dabbott/wiki/index.php/Final_Report_2012 [11]. L. Griffith and P. Varsos. (2013). Semester B Final Report 2013 – Cipher Cracking . Available: https://www.eleceng.adelaide.edu.au/personal/dabbott/wiki/index.php/Semester_B_Final_Report_2013_-_Cipher_cracking [12]. N. Gencarelli and J-K. Yang. (2015). Semester B Final Report 2015 – Cipher Cracking . Available: https://www.eleceng.adelaide.edu.au/personal/dabbott/wiki/index.php/Final_Report/Thesis_2015 [13]. MS. Charikar. (2002). Similarity estimation techniques from rounding algorithms. Available: https://www.cs.princeton.edu/courses/archive/spr04/cos598B/bib/CharikarEstim.pdf [14]. G.S. Manku, A. Jain and A. Das Sarma. (2007). Detecting Near-Duplicates for Web Crawling. Conference on World Wide Web. http://citeseerx.ist.psu.edu/viewdoc/download?doi=10.1.1.78.7794&rep=rep1&type=pdf [15]. From Wikipedia, the Vector Space Model. Access via Internet: https://en.wikipedia.org/wiki/Vector_space_model#/media/File:Vector_space_model.jpg [16]. From Internet: http://static.oschina.net/uploads/img/201308/30125158_L1CI.jpg
Task 2 Mass Spectrometer isotope Data Analysis by Yami
Introduction
This project is to study on an unsolved murder case that happened on the 1st of December 1948. At 6:30 am of that day, a man was found dead on Somerton beach. This dead man carried with no identifications and his teeth were not matched with any known person, so he is called Somerton man. After postmortem, the coroner picked some information from this dead man, such as the heart was of normal size and the death time was around 2 am of the found day. Besides, the coroner figured out that approximate three to four hours before death the man ate a pasty as meal which pathologist Dr. Dwyer suggested some poisons causing the man’s death. But the pasty should not be the source of poison through further research. Finally, after a series of investigations, the coroner still could not tell any conclusion about this man’s identity or cause of death and the dead man’s body was buried in Adelaide's West Terrace Cemetery in 1949. It became one of the Australia's most fascinating cold cases. [2][4][10] In order to continue the study of this case, a plaster cast of Somerton man was made in 1949. The hairs which were extracted from Somerton man plaster cast and other six different students are used for spectral analysis. [9] Hair data is recorded by Inductively Coupled Plasma Mass Spectrometer (ICP-MS) and this instrument is effective for micro-sampling of solid material for trace elements and the analysis of predominantly cation. [1] For collecting data, the hairs were burned by laser. Then, the instrument measured the levels of different isotopes and the relatively values of elements. After testing, the comparison for experimental results between Somerton man and six other different students can be processed.
Motivation
The aim of this project is to find out the new clues about the Somerton man case by comparing the content of various elements in the dead man’s hair with the hair of the normal man. Even if the case has happened for decades, it is not been forgotten. The residents still would like to see the case solved. In addition, this project can expand the knowledge for data analysis, code cracking, engineering statistics and digital forensics. In fact, this dead man was suspected to be a foreign spy due to his unknown identity. So, it is meaningful for country security as well.
Objectives and Methods
1.Understanding the hair biology knowledge and some related chemical knowledge. 2.Hair mass spectral experiment: hairs were burned by laser. Then, the instrument measured the levels of different isotopes and the relatively values of elements. The scan speed of mass spectrometer was 5 micrometers per second. 3.Two tests: For glass test, the scan length of each control sample was 1000 micrometers. The method length was 230 seconds including 30 seconds background. The scan length of Somerton man’s hair was 6054.6 micrometers and the method length was 1240.9 seconds including 30 seconds background as well. For quartz test, two sections of seven control hairs have been tested and each hair is 500 micrometers, so there are fourteen control hair data and the total length is 0.7 centimeters. Somerthon man hair scanned 500 micrometers, each subsequent transect beginning where the previous finished for a total 96 sections (4.8 centimeter total) due to the limitations of the sample stage.
4.Experiment results analysis: For a healthy person, the hair growth rate is approximate 0.4 millimeters per day [7]. So based on glass test data we can get about 2.5 days information of control and 2 weeks information of Somerton man before his death. From the quartzes test data we can also know the element content differences between Somerthon man and control samples hair. All the experiment data is plotted by Matlab and the plotting figures are listed in Appendix A. Then, the comparison between Somerton man and control samples is processed. The comparisons are focus on the different elements content in hair which can provide some useful information related to Somerton man. 5.Put forward some reasonable assumptions and new clues: Based on experiment data analysis, some reasonable assumptions needs to be presented. These assumptions can be related to some activities and the living environment before his death. 6.Validation of assumptions and clues: Once these assumptions are confirmed, they can be served as new clues for the case to provide more direction.
Literature Review
1.Previous Studies In addition to police men’s investigation, there already have several academic studies. Prof. Derek Abbott has worked on this case for more than 2000 hours. [9] His team took the hairs from Somerton man’s plaster cast and recorded elements data by ICP-MS. Since 2009, it had become a final project for the University of Adelaide students and some students had participated this project. In 2013, the project group plot some Somerton man’s hair elements’ content figures and compared with control samples. [6] They have analysed the differences between Somerton man’s hair and control samples. However, those hairs’ data were all got from glass test. In this project, we redo the analysis based on the data that got from quartz test. In addition, we will compare those two different data figures. However, the new data should not be compared with old directly due to different drift values. The new data will multiply a constant which is got from the glass test remainder that is a bit rest of Somerton man’s unburned hair. Besides, the different year of plasters needed to be considered as well. 2.Software Hair data is recorded by Inductively Coupled Plasma Mass Spectrometer (ICP-MS) and presented in the form of Excel tables. Matlab is used to plot figures which are used to show the elements comparison results clearly. It has some graphing capabilities and can be applied for making engineering plots.[3] In this project, the massive hair element data are plotted by Matlab command ‘scatter’. Then, use command ‘hold on’ to put the Somerton man’s and control samples hair data on the same figure and make the comparison clear. 3.Hair elements Hair analysis can demonstrate the content level of the heavy mental and essential elements in human body. [3] The different value of some essential elements in hair may be correlated with nutritional status and diseases, such as calcium (Ca), chromium (Cr), zinc (Zn), copper (Cu), and selenium (Se). The high values of some elements such as lead (Pb), arsenic (As), mercury (Hg), and cadmium (Cd) in hair can indicate the intoxicating phenomenon. [3] Using this analysis method can discover the useful information about the Somerton man healthy condition and has possibility to find the cause of death. 4. The relation between living environment and hair elements The living environment can affect the content level of elements in human body. This effect not only caused by polluted water and food, but through the injury and radiation. Trace elements values in hair can reflect the source of behaviors including the diet hobbies, smoking and medication. Human absorbs pollution source by different ways such as oral, breath, injection and radiation. These contaminants stored in different body organs and tissues can affect human health. Hair is a good indicator of environment change. Normally, it shows the variation of trace element in human body as the hair growth.
Glass test data analysis
Data screening
The hair data was recorded by mass spectrometer and the data was got from glass test. There are 44 elements gained by laser ablation (shown in Table 1). Three of these elements are needed to be mentioned. The first one is sulphur (S7) which must exist in human’s hair. The value of Sulfer can be refered to the drift value of the environment. The second one is lead (Pb206), the high level of Lead is harmful for human health. The third one is strontium (Sr88). This element has high percentage in Adelaide’s soil compared with other areas. So, the analysis of the change tendency of Strontium’s value will provide useful information about Somerton man’s living environment before his death. Table 1 Elements table for glass test

Element classification
Some recorded hair data contains toxic and heavy mental elements which are harmful for human health in high values. However, most are essential elements for human body. Table 2 shows the toxic elements and essential elements in hair. The comparison of toxic elements content in hair is an important research subject. Table 2 the Different Type Elements of Hair

In previous study, the hair data analysis is based on glass test result. However, the impurity material has influence on element values, thus, the data analysis mainly relies on quartz test rather than glass test in this project. Compared with glass plate, the quartz plate is a purity material composition. Table 3 shows the main composition of glass and quartz. Table 3 The different Elements of Glass and Quartz

Element content comparison
In order to speculate the cause of death and living environment, the Somerton man hair data should be compared with control samples. In this experiment, six normal people’s hairs are selected as control samples. Then, the mass hair data is disposed by software for a visual comparison.
Excel
At first, the hair data of Somerton man was plotted by Excel (shown in Figure 1). The X axis demonstrates the scan time of mass spectrometer. The Y axis demonstrates the relative value of elements content. Figure 1 Somerton man’s hair data

However, only 28 elements were shown on the chart. Some data was missing due to the shortage of Excel. Besides, most elements are not clear except sodium (Na23). Some traces are out of range and not obvious, such as the elements located on the bottom of this chart. So, these troubles result in the difficulties of contrast. The control samples hair data plotted by Excel (shown on appendix A) as well. Unfortunately, they all have the shortages as the Somerton man’s data chart.
Matlab
In order to solve these problems, Matlab can be used to plot each element’s content distribution. 44 elements comparison figures have been plotted and shown on appendix A. Some comparison figures of element value display the results clearly. However, some figures have difficulties to find the tendency. The elements figures’ classification is shown on table 4. Table 4 Classify elements by comparison results

The quality of the results is considered below, four elements (Na23, Mg24, Si29 and Ca43) have the similar tendency. Meanwhile these four elements are all contained in glass material in previous study. This phenomenon can assume that the recorded elements values are affected by glass slice. However, the elements which do not exist in the glass will not be affected. In table 4, the same value means that the content of elements in the Somerton man and control samples can be regarded as the same value. Different value represents a significant difference in element content, and the change trend is not similar. No tendency means that the comparison figures can’t show the law of change and the results can’t be compared. Figure 2 shows the lead (Pb206) relative value comparison between Somerton man and control samples. Figure 2 Lead (Pb206) Value Comparison

The X axis demonstrates the scan time of mass spectrometer. The Y axis demonstrates the relative value of Lead content. The mass spectrometer scans from the root of hair. Therefore, the smaller number of X axis represents the closer to death time. In Figure 2, the content of lead in control samples is very low and there is slight upward trend only in a short period of time. However, there have found a very high level of Lead in Somerton man’s hair compared with control samples especially the end of his hair. This situation of high lead content is worthy of attention. Through further studying the distribution graph of lead content, it clearly shows a tendency that the lead value has a visual reduction before his death. So, it can be affirmed that high level of lead was not the main cause of his death. In fact, the high level of lead content can be related to the living environment and the rapid decline in lead content may represents the recent replacement of the living environment. Thus, some of the geographic information in 1948 needed to research, such as solid analysis, petroleum quality, water quality and nuclear power plant location. Figure 3 shows the mercury (Hg202) relative value comparing between Somerton man and control samples. Figure 3 Mercury (Hg202) Value Comparison

The X axis demonstrates the scan time of mass spectrometer. The Y axis demonstrates the relative value of mercury content. There have found a higher level of mercury in Somerton man’s hair compared with control samples. This value from root to the end of hair is basically the same. Through research, mercury is a highly toxic heavy metal pollutants of biologic toxicity. It is difficult to be discharged back into the organism. So it is a serious threat to human health. However, mercury is ubiquitous in nature. There are trace amounts of mercury existing in plants animals and food. Normally, human can eliminate toxins through excretion and metabolism to keep the amount that should not influence health. This is the reason for finding mercury in human’s hair. The main pollution of mercury is from chlor-alkali, plastics, batteries, electronics and other industrial emissions. The Somerton man’s higher level of mercury may be due to his living area. Thus, this should not be regarded as the cause of his death. The strontium value between the Somerton man and control samples’ hair are obviously different. Figure 4 shows the strontium (Sr88) relative value comparing between Somerton man and control samples. Figure 4 Strontium (Sr88) Value Comparison

The X axis demonstrates the scan time of mass spectrometer. The Y axis demonstrates the relative value of strontium content. Strontium exists in mineral water. It is an essential element for human. This element can prevent hardening of the arteries. At the root of Somerton man hair, the content of strontium is significant high. This means the living area for Somerton man contains high level of strontium content before his death. In addition, the strontium value shows an increasing tendency in his last two weeks. However, strontium is not a toxic element and the increasing tendency is not the cause for the death of Somerton man. Reasonable inference is that the Somerton man changes living environment two weeks before the death and this is the same with the speculation for lead content change.
Moving-average Filter in Matlab
Some comparison figures cannot be shown clearly by Matlab plotting. Thus, the Moving-average Filter should be applied. Firstly, selecting a window size for Filter. Then, calculating the arithmetic average of outliers within the window and make the average of the demand as outlier’s window centre point. After that, moving the window as window size and the average method is repeated until this process is complete. This method has a good inhibitory effect on periodic disturbance and makes the figure smoother. It is suitable for high frequency oscillation system. All of the elements content figures have been plotted by using moving-average filter and shown on appendix B. After using moving-average filter, the comparison figures have some new founds, such that more similar tendency elements are found and some clear comparison figures have been shown. The details are shown on table 5. Table 5 Classify elements by comparison results

Through filtering, As75, Ag107, Cd111 are the new found toxic elements which have high level in the Somerton man’s hair. The content distribution is shown as follow: Figure 5 Cadmium (Cd111) Value Comparison

Cadmium is an element present in the nickel-cadmium battery and it is a toxic element which can create poison gas when boiled. The average content value of cadmium in Somerton man is much higher than control samples especially when the scan time is 1400 seconds. However, the change trend of this element are similar with lead and content value of cadmium shows a decreasing tend for his last time. Unlike lead, cadmium is more toxic and it can be regarded as the clue for the death of Somerton man. However, this kind of battery did not appear before 60 years. That can be indicate this battery is not the source of cadmium. It can also be observed from the figure that the hair for control samples contain cadmium as well. Thus, it can assume that this kind of element may come from drinking water or food, or other frequently used items. Figure 6 Silver (Ag107) Value Comparison

Through the observation of Figure 6,the silver content of Somerton man is higher than control samples. Besides, the value change for silver in hair of Somerton man is not obvious and the whole tends to be stable. Thus, this element should not be used for the speculation of Somerton man living condition. Besides, the element of silver is not harmful for human healthy. It can only make some colour change for skin. Thus, this element will not be researched in this project. Figure7 Arsenic (As75) Value Comparison

Arsenic content level in Somerton man is increasing during the last two week. At the tip of Somerton hair, the arsenic content is similar with control samples. That means this content level is not harmful for human. Besides, the living area of Somerton can be assumed as same as control samples. However, the arsenic level is significant high at his last few days and the arsenic can be used for making toxicant. So, changing living area or being poisoned should be considered. This comparison figure can be regarded as one valuable clue.
Knowledge Gaps
This project can generate several new clues for the case of Somerton man. Meanwhile, these new clues were confirmed by comparative analysis of elemental contents. New clues can provide more directions for the future research.
Quartz test data analysis
Data screening
Compared with glass plate, quartz plate is more pure. So, some elements recorded in the glass experiment were not present in the quartz test and some elements have different relative atomic weight. The recorded 35 elements in quartz test are shown in Table 6.

Data comparison figures
All of the quartz data is recorded. In order to comparison, the data of element has been classified as four sets of data: • Control sample hairs: Files name are Hair02-Hair08. For control hairs, it analyzed 2 sections of each hair, each 500um in length, so there are 0.7 centimeters control sample in total. The number of samples is seven, and each person takes two hairs as the two samples. • Somerton Man: It analyzed 500um sections, each subsequent transect beginning where the previous finished for a total of 96 sections (4.8cm total). • Standards: The files named NIST612-1 to NIST612-20 (20 transects) are standards and were run to ensure that the instrument wasn’t grifting too much during the analysis, they can be used to compensate for the drift if need be as they were run at intervals during the sample acquisition. • Background: Transits of 100um lengths across the quartz, files are Glue -1 to Glue–4. For the quartz test data, each element needs to plot three comparison figures. The first comparison is the comparison of four sets of data which are control samples, Somerthon man, quartz and standards. The second one is enlarged graph for the first comparison figure. The third figure shown fourteen control samples’ hair data comparison. Using the different colour dots to represent the four sets of data. Blue dots represent control samples, red dots represent Somerton man, yellow dots represent standards and green dots represent quartz background. The Figures (8-14) show the comparison of four sets of data. The X axis for all of the figures describes the scan times of the laser. The Y axis represents the relative value of elements in four sets of data.


The comparison result of silver (Ag107) value between four sets of data is shown in Figure 8. Yellow dots represent the drift values which are basically stable and indicate that the drift change is not significant. Thus, the recorded data is reliable. Green dots represent the silver content in quartz. As can be seen from the figure, the content of silver in the quartz is very small. Therefore, this set of data has little effect on the test data. In general, the silver element content in Somerton man’s hair is higher than the control hairs. In quartz experiment, the relative content value of silver in the hair is a table value and it is similar with the glass experiment result. Figure 9 Carbon (C13)


Figure 10 Sulphur (S34)


Same as silver, the standard values for sulphur and carbon are constant which means the instrument wasn’t drifting too much. By comparison, the carbon and sulphur relative values are similar among Somerton man and 12 control hairs. Only two samples have significant differences and these samples come from one special person. Carbon and sulphur are essential elements in human hair. The change in the content of these two elements can be a direct indicator of a person's living environment. Based on the comparison results of the Figure 9 and 10, the living environment conditions for Somerton man and six control samples are similar but different from the special one. Thus, the living environment of Somerton man can be confirmed. Figure 11 Calcium (Ca43)

Figure 12 Potassium (K39)

Figure 13 Strontium (Sr88)

Compared with the elements relative values between Somerton man and control samples, Figure 11, 12, and 13 have some similarities. The relative values of calcium, potassium and strontium in Somerton man’ hair are higher than most control hairs. However, the content of these three elements in two samples is close to the content of Somerton man’ hair. Moreover, these two hair samples both are from the one person. Based this result, it can be speculated that the content values of these three elements in the living environment for Somerton man and this special sample are similar. Figure 14 Lead (Pb206)


It has mentioned in the previous chapter that lead is a toxic element, and the data obtained from the glass plate experiment show that the lead content in Somerton man’s hair is significantly higher than that in control hairs. This phenomenon still exists in the quartz plate test. Since the incomplete hair for quartz plate test, the trend of lead content value in the hair before Somerton man dying cannot be expressed. However, the content of lead in Somerton man’s hair is indeed higher than the control hairs. The difference in lead levels does not indicate that the death of Somerton man is caused by the high level of lead in the body. The difference may be due to the fact that the lead content in human living environment is different from 60 years ago. Figure 15 Comparison of the relative values of some elements in control hairs


For control hairs, two sections of each hair have been analysed. There are fourteen control hairs which are from seven persons. By comparing these 14 samples, it was found that there was a difference in the elemental content between the samples, especially the first control person’s hair. Figure 15 shows the relative value of the first sample is significantly higher than the other samples. These elements are Mg, Ca, K, Mn, Na, Li, Sr. In addition, by the analysis and comparison results of several previous graphs, the values of the elemental contents of this sample are similar to those of Somerton man. From this result it can be inferred that this control sample and Somerton man have similarities in the living environment or lifestyles.
Two data comparison
Two tests data comparison table
In the glass plate test and the quartz plate test, 31 same elements were recorded and shown in table 7. Table 7 the Same Elements in Two Data Sets

Comparison of Somerton man’s two hairs
In the last two chapters, we compare and analyze the differences between Somerton man and the control samples in the two experimental data. Next, the two experimental results of Somerton man's two hair data will be compared. We hope to compare the two groups of experimental data to find a same trend but different values data, and then multiply a constant number with one of the test data to obtain the other test data. Figure 16 (a) Silicon (Si) value comparison in quartz test

Figure 16 (b) Comparison of the relative values of Silicon (Si) in Somerton man hair

Figure 16(a) is a comparison of the silicon data obtained in a quartz plate experiment. The silicon content in the standard is reduced. So that the silicon content in the hair data is reduced. It is shown that the environment of test has influence on test result. From Figure 16 (b), these two hairs of Somerton man have significant different in the relative value of silicon. Besides, the trend of these two sets of data is significantly different. Thus, it cannot find the constant number from Figure 16. The following figures that from Figure 17 to 20 are the different elements comparison results of two Somerton man’s hairs. It is hard to find the same trend from this comparison. Therefore, it is necessary to find another suitable way to compare the two sets of data. Figure 17 Comparison of the relative values of Arsenic (As75) in Somerton man hair

Figure 18 Comparison of the relative values of Strontium (Sr88) in Somerton man hair

Figure 19 Comparison of the relative values of Lead (Pb206) in Somerton man hair

Figure 20 Comparison of the relative values of Sulphur (S34) in Somerton man hair

Future Works
At this project, Somerton man’s hair elements data which got from glass test and quartz test have been plotted. The future works as following: • Re-analysing the uncommon elements value of Somerton man’s hair • Find the Somerton man’s living environment clues • Find the same trend part from two Somerton man’s hair comparison figures. • Gain the constant number to multiply one test data
Project Management
Timeline
The timeline Gantt chart has been attached in appendix B. It has listed the key milestones of the project (shown in Table 4). Table 7 Key Milestones of the Project


Work breakdown
The key task for the project is plotting and comparing data figures. Then, finding clues from the comparison. Due to two group members have different study directions, the project work is individual.
Task allocation
The project has two directions. In general, two group members work on different specific tasks. This report devote to analyzing the mass spectrometer data of the Somerton man hairs. The other group member works on cracking code and writing software
Management Strategy
To ensure finishing project on time, we have set the following strategies: • Meeting with supervisors frequently • Receiving effective feed backs from supervisors • Finish tasks without delay • Communicate with group member frequently.
Budget
The project has 500 dollars budget but the software tools are open source in the University of Adelaide. So we do not need cost money on this project.
Risk Management
The risks of project are listed in Table 2. The first risk should be considered is misunderstanding project tasks. So, the well communication with supervisors is essential. For this report, the crucial task is plotting figures by Matlab. Matlab unavailable will have influence on project processing. However, the Matlab is available on the computers of university. So, this risk can be negligible. Table 8 Project Risks

Conclusions
In this project, three important comparisons of experimental data were made. These three comparisons are related to glass test, quartz test and the comparison of glass and quartz test results. In the comparison of the experimental data of glass plate test, the relative values of element content for lead, mercury, arsenic and cadmium in Somerton man’s hair are significantly higher than control samples in certain period of time. However, these elements’ content have been reduced to a safe range before his death. Thus the high content of these elements cannot be regarded as the main cause of Somerton man’s death, only as a reference to the change of living environment. In the comparison for the data of quartz test, the total amount of recorded elements were reduced from 44 in glass test to 35 which is due to the high purity of quartz plate. Thus, some elements in glass test are excluded. Through comparison, the content of carbon and sulphur in Somerton man’s hair has a large difference with the fourth sample. In addition, the content of potassium, strontium and calcium are similar with the first sample. Therefore, it can assume that Somerton man’s living area is different with the fourth sample, but similar with the first sample. The data comparison between glass and quartz test does not achieve the desired results. So, the experimental method may need to change in the future work.