Projects:2017s1-190 Modelling and Validation for Synchronous Generators
Contents
- 1 Team Members:
- 2 Supervisors:
- 3 Aim:
- 4 Motivation:
- 5 2017 Main Development:
- 6 References:
Team Members:
- Ainal Syazwan Itamta
- Binhao Li
- Xinrui Li
Supervisors:
- Dr. Andrew Allison
- David Vowels
Aim:
The aim of this project is to identify the dynamical parameters of the synchronous generators in NG06 Junior Lab. The model will be calibrated and verified via several specified tests on the machine. After that, the test procedures and designs specification will be documented.
Motivation:
The steady state characteristics of the synchronous generators are already well documented.However, the dynamical characteristics are required to be explored. Using these as guidelines, future students and academics can further analyze the synchronous machine in NG06 Junior Lab.
2017 Main Development:
1.Software Model of The Generator in Matlab:
The matlab software model of the generator is based on the book Small-signal stability, control and dynamic performance of power systems(https://www.adelaide.edu.au/press/titles/small-signal/), by Gibbard, Pourbeik and Vowles. The part is focus on the Small-signal models of synchronous generators in per-unit system. The purposes of the model is to do further reseach about verifying transient variables more specifically in d2q1 system(First Q-axis Damper Winding, Second D-axis Damper Winding), like winding magnet flux , field voltage , field current and so on. DQ tranform and FVT are widely used in this part.
2.Measurement of Rotor Angle Using Encoding Wheel:
By using the combination of code wheel (i.e. HEDS-6140#B13) and optical incremental quadrature encoder (i.e. HEDS-9040B00) together with DAQ board, our project group can accurately determine the rotational angle of the shaft in Lab View software. Rotor angle is significantly important. During normal operation of synchronous generators, stator magnetic field and rotor magnetic field rotate at the same speed but existing an angular difference between them and that depends on the power output. Based on this motivation, our group has selected the above two units and had them installed in NG06 lab. The output of encoder transmits to the DAQ board that illustrates the amount of rotational angle the shaft was travelling. By doing so, we are able to analyze the relations that involves the rotor angle and other quantities.
3.Lab-View and Data Acquisition (DAQ) Board:
Lab-View is a graphical programming language. In this project, a new Lab-View program is needed to capture several parameters in order to analyze the data. The way Lab-View capture the data is via the device that is called Data Acquisition (DAQ) Board. This device will capture the generated signal from installed sensors in the NG06 Lab.
The design of the Lab-View programming is to be able for the code to capture several parameters which are three-phase voltages, three-phase current, DC excitation field and Rotor angle. Since the maximum output voltage of the DAQ board is just 10 Volts, the value capture using the new program is in scaled value. Therefore, several methods are used to identified the scaled value of it. Besides that, the program is capable to capture 64 samples in 50 Hz frequency. In aspect of data saving method, it has the ability to save the data in a readable format (lvm) and the naming of the file is consistent.
There are several improvement that can be implemented in this Lab-View program. The details of the codes and its improvement are discussed in the thesis of this project.
Steady State Testing:
Steady state tests of synchronous machine are similar to the electrical energy system practical notes. The purpose of the tests is to determine several parameters at different machine operation condition. These test are open-circuit test, short-circuit test and slip test.
throughout the use of the EES Synchronous machine experiment, the team is able to accurately measure several parameters including Xd and Xq. The value of Xd is 1.324 p.u. and Xq is 0.5823 p.u.
Synchronous Machine Saturation Model :
The saturation is necessary for the modelling of synchronous machine. In order to capture the effect of hysteresis, open circuit test configuration from electrical energy system course is used. The test is performed by capturing the data when the field current is changed. The calibrated LabVIEW is used during conducting the experiment.
The method used in determining a machines saturation model is based on Gibbard, Vowles and Pourbeik. Once the process of capturing is finished, the value of root mean square of terminal voltages are obtained by using zero crossing method.
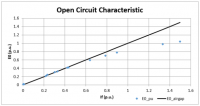
The values of E0, Air gap line are used to plot the saturation graph of open circuit characteristic. The air gap line is the function of E0 and If by neglecting the saturation. Below is the graph
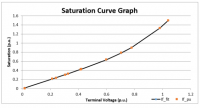
The air gap and the OCC curve of the machine are used to identified the saturation characteristics using the per unit values of terminal voltages. According to Gibbard, Vowles and Pourbeik, interpolation function for saturation characteristics is the exponential type:
S(φ)=Aφ^(B-1) S(V_t )=V_A/V_t -1
Where φ represents the air gap flux linkages. As this under the open circuit condition, V_t= φ. Based on the 2016 students’ report, the value of A and B are identified which are 0.5 and 5.0694 respectively.
The value of new A and B is identified by minimising the value of sum of square error. Based on the calculation the value of A and B are approximately at 0.383 and 5.591 respectively. Therefore: S(φ)=0.383φ^5.591. The function is used to plot the saturation characteristic of the machine.
Method of data capture :
1.Data Acquisition (DAQ) :
DAQ is the process of measuring an electrical or physical phenomenon such as voltages, currents and rotating angle. A DAQ system consists of three main parts, which are sensors, DAQ measurement hardware and a programmable software (LabVIEW) in a computer.
2.Accurateness of LabVIEW via Calibration Process :
Calibration of AC signals
The experiment is performed by connecting the 240 V of AC power supply to the induction machine, which act as a prime mover. The voltages from the panel board are measured by using LabVIEW. Besides that, several equipment are used which are oscilloscope, high voltage probes and power analyser. These equipment are used to measure the output voltages and currents which will be used later to identify the scale factor for the LabVIEW output. The scale factor for each phase voltage and current is found. Below is the scale factors for each phase:
VA = 110.4164 Volt/Volt VB = 111.9786 Volt/Volt VC = 111.9287 Volt/Volt
IA = 25.1648 Amp/Volt IB = 25.1582 Amp/Volt IC = 25.3139 Amp/Volt
References:
[1] F. P. D. Mello et al, “Derivation of synchronous machine parameters from tests”, IEEE Power Tech. Inc., Schenectady, NY, Rep. 4, 1977.
[2] T. Wildi, Electrical machines, drives, and power systems, 5th edition, New Jersey, Pearson Education Inc, 2006.
[3] D. Vowles, P. Pourbeik and M. Gibbard, “Small-signal stability, control and dynamic performance of power systems”. University of Adelaide Press, 2015.
[4] W. Soong and A. Allison, "EES lecture Note Package", 2016.
[5] Nesimi Ertugrul, "LabView for Electric Circuits, Machines, Drives and Laboratories", National Instruments, Prentice Hall PTR, 2002

