File list
This special page shows all uploaded files.
| Date | Name | Thumbnail | Size | Description | Versions |
|---|---|---|---|---|---|
| 21:35, 17 August 2018 | Radar.PNG (file) |  |
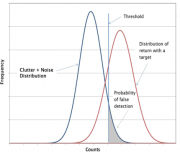
56 KB | As is shown in the graph, the Y-axis represents the frequency and X-axis represents the counts of responding frequency. The area under the red curve to the right of the threshold shows the possibility we detect the target signal. The area under blue cu... | 1 |