Projects:2014S1-11 Wireless Rotation Detector for Sport Equipment
This project focuses on developing a wireless non-optical solution for measuring the rotation of objects. The solution to this problem is approached through the use on antenna and the polarisation effect that antenna are subject to.
Contents
Project information
Motivation and Background
- Rotation can be measured through optical means but this is subject to line of sight and may be blocked in some cases. Antennas do not suffer these same problems.
- The most important principle used is that of the polarisation effect. This states that when two antennas are aligned parallel in the same plane then the power transmitted between them is maximised. When the two antennas are in perpendicular planes then the power is zero. Using this fact we can use the frequency of the changing power to measure the speed of rotation.
Previous work
Previous work has been done in this area through a honours project in 2012. This resulted in a device where a transmitting antenna and circuitry required to produce the signal are placed on the rotating object. This then sends a signal back to a receiving device that would then calculate the speed of rotation using the polarisation effect. This year we aimed to remove all the circuitry on the rotating object and just leave and antenna that will reflect a transmitted signal. This then gives us less weight and no power required on the rotating object. This approach is made possible by the use of an absorber and bi-directional coupler.
Aim
For this year project, we aim to create an improved device, which measure the rotation speed without the battery and signal generation on the target object and smaller physical size and weight of the integrated device. We also aim to build a more compact hand-held device with handle and easy access to user interface.
Outline of proposed work
- Improve knowledge of antenna theory, antenna simulation software, signal generation, signal interference, calculation algorithm (fast Fourier transform), Arduino Board and Arduino development tool.
- Develop the system overview of the project and identify the key components needed.
- Compare the features of commercial devices with custom designs (e.g. size, price, weight, performance, working condition and low-profile configuration).
- Test the commercial devices and custom-designed devices under laboratory conditions. Then integrated all the devices together and measure the performance of the project under real-world condition.
High-Level Plan
- Phase 1 :
- Generating the ISM frequency by using the voltage control oscillator.
- Phase 2 :
- Using the transceiver to send the signal.
- The absorber is attached to the target object.
- Receiving the reflected signal from absorber.
- Phase 3 :
- Separating the received signal from the transmitted signal through using of bidirectional-coupler or crosstalk-reduced receiver.
- Phase 4 :
- Using the power of the separated received signal to calculate the rotation speed of the target object.
Component Specification
- Commercial Devices
- Voltage contolled Oscillator
- Bi-dirctional Coupler
- Power Detector
- Arduino Uno Board
- Custom-designed Devices
- Transceiver
- Transmitter and Receiver
- Absorber
Component test results
Each of the components were tested individually before being incorporated together
- VCO
The VCO was test with a power supply to see the tuning voltage needed before using the Arduino board to receive similar result. Using the Arduino board to supply a 3.2V tuning voltage the VCO produces at 2.4025 Ghz signal with 5.6 dBm power. This is the signal that is used in the device.
- Bi-Directionl Coupler
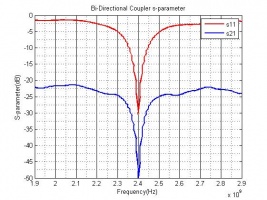
The Bi-Directional coupler was tested with a network analyser. port 1 of the network analyser was connected to the the input and port 2 was connected to the coupled in reverse port of the coupler. The output of the coupler was connected to the transceiver and the input coupled forward port is terminated with a 50 ohm resister. Using this setup the s-parameters are found. For the use of the device the s11 and s21 parameters are the most important. The S11 shows the power reflected by the transceiver. The s21 parameter shows proportion of this power that we will receive at our desired port. From this we can tell that any signal that we receive stronger then 30dBm will be above the noise of the reflections of the transcevier and this will produce a signal at at the reversed coupling(Where the readings will be taken) of 50 dBm or above.
- Power Detector
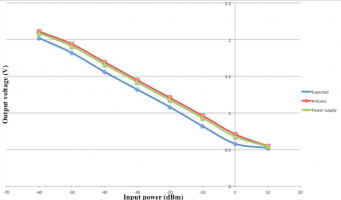
The power detector take an rf signal and gives an output voltage proportional to the input power. The power detector was tested at 2Ghz due to limitations of testing equipment. First it was tested with a variable power supply then using voltages taken from the Arduino board. The result were compared to the expected results give by the components data sheet. The results received were slightly higher than that expected but as the trend was the same as the expected results this is acceptable. As the calculations look at the frequency of the change in power as long as the output voltage changes with a steady rate this is fine.
- Arduino Board
Along with the calculations the Arduino board is used to display results. The 2 most important things that it displays are the speed of the rotating object and the received voltage. The speed can be changed between Hz and RPM depending on the desired measurement. The voltage can also be change to a power reading. The display can also show recorded result. The Arduino Board can hold up to 5 speed recordings.
- Transceiver
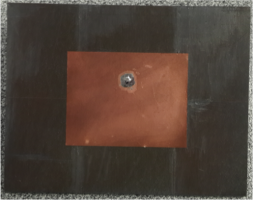
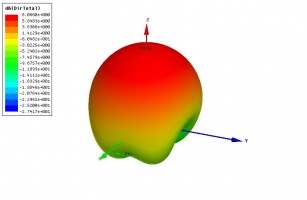
A coaxial microstrip patch antenna is used for designing the transmitter. The coaxial microstrip patch antenna is a directional antenna with around 6 to 8dB gain. The general performance of it meets the design specification of this project.
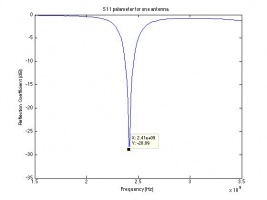
The resonate frequency of the transceiver is at 2.41GHz with -28.90dB reflection coefficient. Although the resonate frequency is not 2.4GHz sharp, the -10dB bandwidth covers the 2.4GHz. Hence the design is acceptable. The reflection coefficient very low, which ensures the quality of the received signal.
The radiation pattern of the transceiver is shown below.
- Dual Antenna
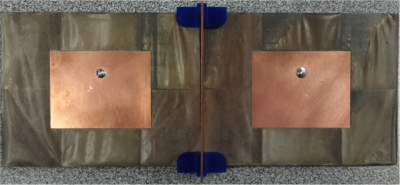
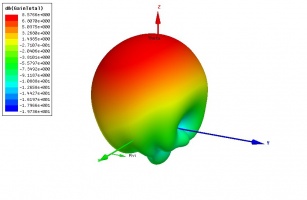
The design strategy of the dual antenna is very similar to the transceiver expect that it needs to find a solution to reduce the crosstalk between two antennas caused by conductive coupling and capacitive coupling in the PCB. a copper plate was used as a shield to reduce the crosstalk for this project.
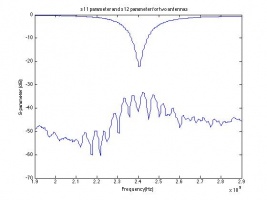
the resonate frequency of the dual antenna, which is 2.405GHz. The reflection coefficient is -21dB, and the crosstalk coefficient is -41.6dB. As the scale level of the crosstalk now is very close to noise signal level, the crosstalk now will not affect the quality of the received signal significantly.
The radiation pattern of the dual antenna is shown below.
- Absorber
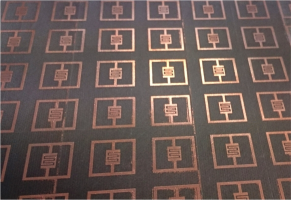
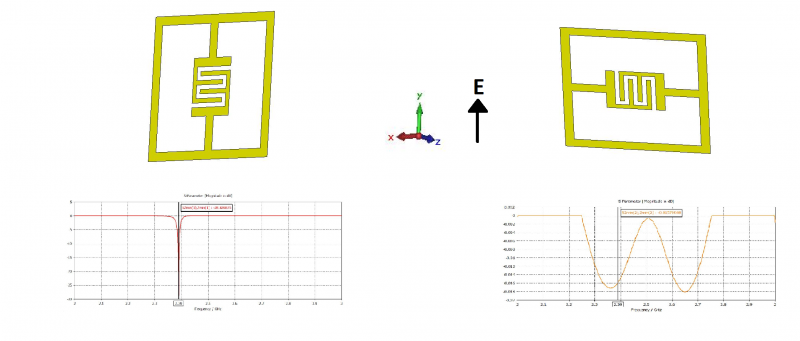
By replacing the bulky transmitter used in previous years with an absorber we have minimized our footprint on the rotating object significantly. While mounted and rotating on the object to be measured, the absorber allows the handheld device to know if the rotating object is either vertical or horizontal to its initial starting position. It does this by taking advantage of metamaterials. This new field of research allows the absorber to reflect a signal off of its surface most of the time, while sending back NO signal when in absorb mode (vertical position below). The handheld device can sense this effect and thus count the number of times it takes place every rotation per second.
Shown above is a single cell of the absorber at two different angles under an incident electromagnetic wave polarized as shown in black. Below each mode are their corresponding reflection coefficient plots in decibels across a range of frequencies. The first mode (top left) shows the single cell as vertical, or in absorb mode where the second shows the cell as horizontal or in reflect mode. Note that in absorb mode the resulting plot gives a reflection coefficient of -28.8dB at 2.39GHz calculated to be 99.9% absorption, which is more than adequate for this project. Also note the values of the reflection coefficient of the plot in reflect mode. As these values are very close to zero we simply assume near perfect reflection at this angle. During the design phase of the absorber, advanced computer software CST Microwave Studio was used before fabrication to quantify and visualize the electromagnetic response of the complex material, e.g. the E-field and H-field at all surfaces as well as Poynting vectors.
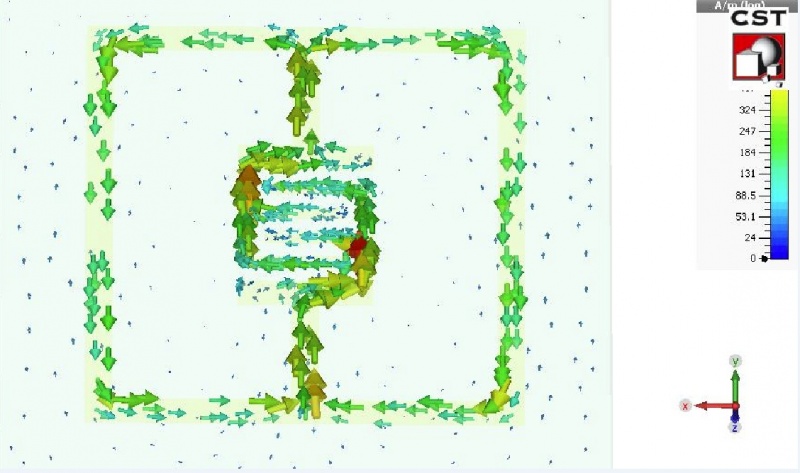
Above gives a visualization of the simulated surface currents at the surface of the absorber as well as the electric ground plane. Note that there are surface currents flowing in both the clockwise and anticlockwise direction around the main loop of the absorber. These currents rotating in opposite directions display the fundamental mechanism of absorption and are equal in magnitude.
- Device Casing
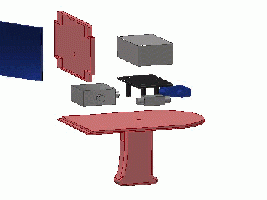
The goal of the casing was to ensure an enjoyable user experience. This was achieved by designing the case with the following features: A handle that is easy and comfortable to hold, lightweight and as compact as possible, and to look modern with a pleasing appearance. The device casing was first designed on the computer modeling software Autodesk Inventor as it allowed to choose a final layout of every component and how they could fit together in a space efficient manner. This software was also chosen due to its easy conversion to a 3D printer in which the entire casing was printed out of a both ABS and PLA plastics.
Team
Group members
- Mr Yizhang Chen
- Mr Todd Mark
- Mr Thomas Davis
Supervisors
- Dr Thomas Kaufmann
- Prof. Christophe Fumeaux
Resources
- Bench 10
- Standard PC
- Arduino UNO Board
- DC Power supply
- Signal Generator
- Arbitrary Function Generator
- Oscilloscope
- Network Analyser
- Anechoic Chamber
- Application software
- ANSYS HFSS
- DraftSight
- Processing 2
- Arduino IDE

