Projects:2014s2-71 Calorimetry and Modelling of Lithium-Ion Chemical Batteries
Batteries are difficult to model, using simple lumped circuits, because they are actually distributed systems with complicated internal states. Batteries are nonlinear and they exhibit complicated path dependent behavior, resembling hysteresis. The challenge for this project is to build a simple and yet accurate model for the State of Charge (SOC) of a chemical battery, based purely on externally measurable variables: voltage, current and temperature. The project will be needed to construct and calibrate a calorimetric chamber with appropriate sensors. They will also need to construct a versatile analogue power source, which can be used to charge the batteries, or discharge the batteries according to an arbitrary profile that can be programmed by users. The profile of charge and discharge should be programmed and executed automatically. The progress of experiments should be logged automatically for later analysis. The thermal analysis or modelling is the secondary target of this project.
Contents
Background and Significance
Motivation
In this era, Battery is the important element for the wide ranges of applications. They are the major contributor to the development of energy storage for using in the field of electronics. From The important military equipment to the space technology, batteries have significant roles. Moreover, they are very popular in the various portable electronics devices and the fuel efficient vehicles. Among the all types of battery, Lithium group batteries are more well-liked for few reasons. For example, Li-po and Li-ion have the certain advantages over other battery which will be described in this report later. The researches on this type of Li-ion batteries are increasing day-by-day. The main reason for doing this is that they have minimal memory effect, high energy to weight ratio and slow rate of self-discharge compare to the other battery types . The most of the research are dedicated to the improvement of power efficiency and power availability for the application where we are using this batteries .The other thing which is vital in those researches is modelling of battery to estimate dynamic behavior of battery. The modelling of the battery includes prototyping and measurement of the various variables. The Estimating of State of charge is very vital because of their necessity in various applications where we need robust real time monitoring system. For Example, Space technology which required battery technology must be provided with real time monitoring system. The other example is the online estimation of state-of-charge for Electrical Vehicles, is vital for power distribution strategy.
Representation of Battery in a Lump Circuit
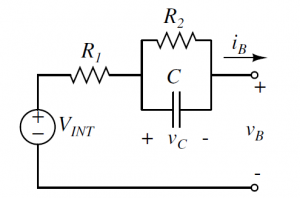
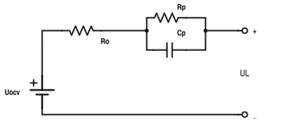
During the charging of a battery, there happens chemical reaction and rise in potential difference. During this Chemical reaction some phenomena happens in the battery cell. They are “Charge Transfer phenomenon”, “Diffusion phenomenon”, “and intercalation phenomenon”. To monitor battery’s dynamic behavior and phenomena, there are two ways. One is the analysis with chemical reaction for which we need a direct experiment with the chemical inside the battery. The other ways is to represent those phenomena with a lump circuit.There are two most popular circuit to represent the phenomena.They are shown in figure (1) & (2). The R1 and R2 will both represent the cause of the loss in the battery system or we can tell that the resistance model is a representation of the effect of the finite conductivities in the electrodes and separator. It models the reaction rate near the electrode with the temperature change .Diffusion phenomenon is the diffusion of the space charges near the electrodes or in the interface of solution. C models the diffusion phenomenon in the battery. Although the model in previous page is very easy to describe and explain, there is one extension of the model for better representation of the battery dynamic behavior. The extension of the circuit makes it more precise to describe the battery phenomenon .The extension is with warburg impedance.
The extension of Warburg impedance will be the series of parallel resistance and capacitance.The extension of warburg impedance by foster network is given on figure (3) In This project figure(1) has been used to represent our battery.
SOC estimation method
There are several method to estimate SOC.Some methods are described below.
Open Circuit Voltage Method
The open circuit voltage is getting from a stable state of battery in which all the internal processes are stabilized. It is equal to the battery EMF. On the other hand, SOC has a relatively fixed functional relationship with the battery. We can use the equation below to shown this relationship:
U = f (SOC)
U: open circuit voltage SOC: State of Charge This function can be got from the open circuit data measured from several tests with different SOC. In this way, the relationship between SOC and open circuit voltage can be estimated. However, this method has its limitations. For getting precise open circuit voltage, the battery should rest for long time, it could be a time consuming work. Moreover, it is difficult to control the battery in a stable external environment for long time.
Ah counting method
Ah counting method mainly uses Peukert equation to adjust the current to standard current and then take intergration of time to get the SOC[16] [17] . It is the most widely used method to estimate SOC. It is also not hard to use and relatively precise. In this method, the battery is treated as a black box.The change of battery can be obtained from integrating the current though the battery. In this way, we do not need to consider the internal chemical reactions. The equation of SOC by using this method can be get as shown below.where SOC(tk): SOC at t(k) times; SOC(t0): The initial state of charge; η: Charge or discharge efficiency; C0: Battery rated capacity; C0: Battery rated capacity; i(t): Current;
Kalman filter method
The Kalman filter is difficult approach as this contains complex and intensive computation. The mathematical convergences are required for doing those computations . Kalman filter is an algorithm where the algorithm uses a number of calculations over time including the noise and inaccuracies too reduce them . Moreover, it produces a series of variables which are estimated from the process and it depends on the prior knowledge of state. As it is depends upon a series of measurements, it is more accurate than the single measurement. As there is a certain chance of divergences in the calculation, the method is mathematically intensive. Extended Kalman filter is an extension of the method in which we dealt with the nonlinear type conditions .This methods are also used estimation for dynamic behavior method. The drawback with this problem is that incorrect values of predetermined variables can produce an extensive error and divergence in calculation.
Objectives
• To make Controllable current source using suitable micro-controller and programming.
• To Use a calorimetric chamber with suitable sensors to measure the current, voltage and temperature. The data will be collected through the help of microcontroller and logger machine. The maintenance of constant temperature is other cause to build a chamber.
• Use the data to fit in an electrical model with the help of analysing and curve fitting.
• To estimate the state of charge from the analysing.
Battery Test
Before staring the main experiment,a group of test regarding battery has been conducted.
Battery charge and Discharge Test
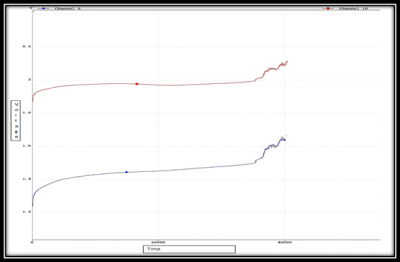
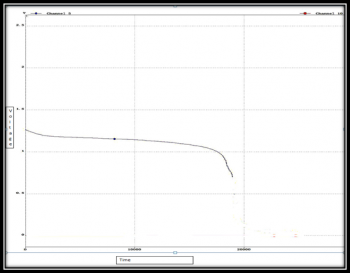
The Ni-mH has been charged and discharge by commercial charger.the result is given below on figure(4)& (5).
If we observe the curve which were received from both charge and discharge test, we can clearly see a flat zone where the curve is increasing or decreasing slowly. The logic behind this is slow chemical reaction rate .The other thing we can notice is that there is a gap between charging and discharging path .This is called hysteresis.Rather than choosing Ni-mH battery ,The Li family battery has been chosen because there is few advantages.One is for less hysteresis and other is memory effect.Li-Po was chosen due to its less sensitivity to undercharge and overcharge during charging and discharging compare to Li-ion.
Battery Temperature Test
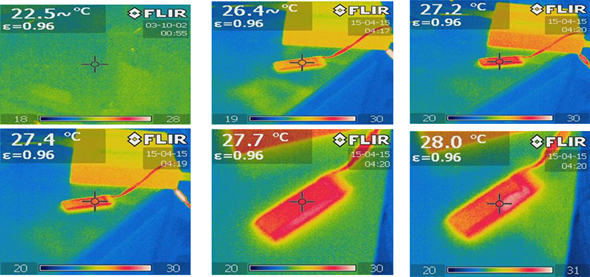
The temperature test was conducted with the thermal infrared camera.The temperature recording by the camera during charging is given below.
From the figure (6), The temperature is rising with the progress of charging.So from this experiment,It was cleared that the temperature rises with the charging process.As SOC changes with temperature,to estimate SOC The constant temperature in the experiment is needed.For that final test of battery need to have a calorimetric chamber with temperature control facility.So,for final test ,The chamber was made.
Final Test
Preparation
Controllable Current Source
STM32F4 Discovery is made by ST MICROELECTRONICS. It is really powerful with a 32-bit ARM Cortex-M4F core, 1 MB Flash and 192 KB RAM in an LQFP100 package. Moreover, it has embedded ST-Link/V2 which is important for us to do on board programming and debugging by flashing hex file. The connector of it for programming and debugging is USB cable type A to mini B with drivers which will be automatically installed by Windows. There are 80 GPIO pins for us to use in the project as input or output. It also supplies UARTs and UARTs for sending and receiving data we get about temperatures, currents and voltages. For sensing voltage, it has 3 sets of ADC which include15 pins with high sampling speed. The clock speed of this board is 168MHzwhich is totally enough for this project. The SPIs support can help us to transfer. The output voltage of this board is only 5V and not controllable, therefore we need another device to be controlled and supply the power to battery. For reach the goal of both charge and discharge, H-bridge can easily control the direction of current without complicated design. L298N H-bridge has been chose for building the controllable power source. It has 2Acurrent limit, 5-35Vvoltage limit and dual output. It can be controlled by PWM signal which will be generated by STM32F4 Discovery and delivered through GPIO pins. H-bridge is controlled by the micro-controller with PWM signal. There are two PWM signal input pin in H-bridge for every power output. We can control for charge and discharge by two PWM signal. If H-bridge pin Input 1 receives PWM and pin Input 2 receive nothing, H-bridge will give load a current from positive to negative. If pin Input 2 receives PWM and pin Input 1 receive nothing, H-bridge will give load a current from negative to positive. If pin In 1 and pin In 2 are both receiving nothing at the same time, the output circuit will be open circuit. In this way, we can change three different states for the battery. For reaching constant voltage or current, we can use the laboratory power supply output control by setting suitable current and voltage value.The connection between the H bridge and STM32F4 discovery board given on figure (7).
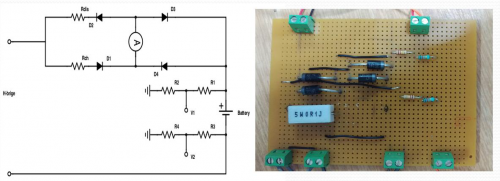
Only H-bridge and micro-controller are not enough for building the controllable power source, therefore we built a full diode bridge circuit to support them.
For reaching constant voltage or current, we can use the laboratory power supply output control by setting suitable current and voltage value.
Only H-bridge and micro-controller are not enough for building the controllable power source, therefore we built a full diode bridge circuit to support them.
In this circuit, the discharge resistor is 8.2 ohms which mounted on an aluminum block and the charge resistor is 0.1 ohms. The diodes are 1N5404with 3A maximum current and 0.9V voltage drop in this case. There are also three connectors for two ADCs and one current sensor which will be used in data acquisition. Because of the limitation of GPIO pin, two set of voltage divider have been put in the circuit. It will be detailed explained in sensing and data logging part.
The program of PWM generation and time control are two different parts. PWM generation code is modified from the sample code of ST MICROELECTRONICS. Then we add time controlling by setting a TIM function with interruption as highest priority. If the time is up, the two pin’s PWM signal output states will be changed refer to setting value.
This controllable power source is much better than version A. It reaches the most of our goals except generating different kinds of waveforms.
Temperature,Current & Voltage measurement
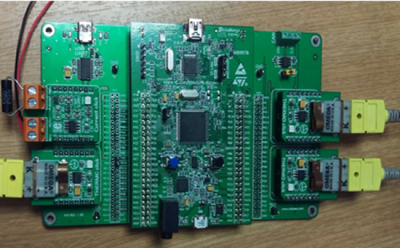
The Thermo and the current clicks has been used to measure the temperature and current.The GPIO pins of STM32F4 Discovery board has been used to measure the voltage.This GPIO pins are the ADC with a certain rating.For making it suitable for our experiment the voltage dividers have been used.The two ADCs will be placed in the positive and negative side of the battery.
Current & Voltage Sensing
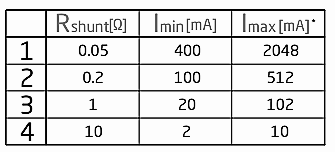
The current sensor we used is current click which is similar with thermo click; it is easy to mount on the STM32F4 Discovery through shield board. It has INA196 current shunt monitor, MCP3201 12-bit ADC, MAX6106 voltage reference as well as two screw terminals. This little board can receive current through IN(+) and OUT(-) pins of the first screw terminal. After that,INA196 IC will converts this current into a voltage for MCP3201 12-bit ADC to convert and transfer through SPI. Second screw terminal is used for external shunt. In order to measure current values in various ranges, we have to change the shunt to the appropriate value like table 1.It also requires programming modifying if the shunt resistor changes.
In our case, most of the tests are doing in constant current condition; therefore, we just need to choose a suitable one without changing during the test.
Voltage sensing is a relatively easy part which do not requires extra extension and add-on board. Embedded ADCs are enough for this function. ADCs in STM32F4 Discovery has a range from 0 –3V which means voltage divider is necessary for sensing voltage over 3V. In this case, we chose voltage divider with value 121.8 kohms and 12.13 kohms. Then reason why we choose this value is because that if the value of voltage divider is too large, the voltage sensed by ADC will has larger error; if the value of voltage divider is too small, there will be current leakage through them. For our case, the most suitable range is from 1kohms to 100kohms.
For getting more accurate value, we take some average on the ADC value to get better results, but this will lead to frequency decreasing. It is better to average in the later data analysis like matlab analysis and graph plotting. Furthermore, STM32F4 Discovery is using the USB cable power supply as internal referencing voltage. USB output voltage is not really stable; this will lead to fluctuation on the ADC values and influence the result precision. In this project, the error we measured of ADC is 0.5% which is acceptable.
temperature sensing
Temperature sensing is very important for both control and data record. It has to be precision and fast. In this project, K type thermal couple has been chose as sensing probe. K type thermal couple probe has a very small volume which will not have big impact on the heat flow through battery. It also has a suitable range from -270°C to 1372°C with great sensitivity of about 41µV/°C. It is connected with a MAX31855K thermocouple-to-digital converter for converting the voltage to temperature data. This converter in mounted in an extension board called thermo click which can easily connect with STM32F4 Discovery and transfer data through SPI.
There are three thermal couples which are sensing different part of the battery and aluminium block for calculating the heat flow. As we are using ready-made sensing converter and probe for temperature sensing, there are still some problems. The example code of thermo click is not suitable for STM32F4 Discovery so that we have to search for other examples; the main problem is SPI is not working properly without perfect example code that we spend much more time to debug than the expectation. Another problem is that MAX31855K is not precise enough to give an accurate and stable temperature value even it has embedded cold side compensator. It can be easily influenced by the ambient temperature. In order to avoid the errors, we has done an experiment to calibrate it with a commercial sensor and made an equation for precision results.
Calorimetric box and Temperature controller
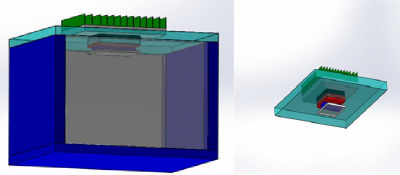
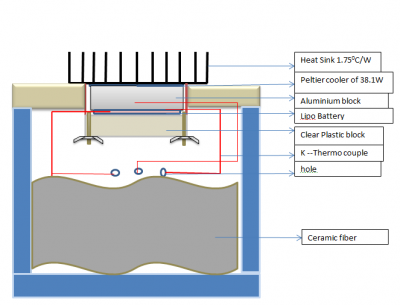
In order to control the temperature and heat flow, we build a calorimetric chamber which is shown in figure 11.
We initially considered using a 3D printed box as calorimetric chamber. But 3D printed box cannot stop the heat transfer effectively between inside and outside. It is better to use commercial esky because of its thermal insulation design and low cost. For precision control of the heat, it is necessary to put some thermal insulation material to fill the empty space inside of esky. This thermal insulation material should not be easy to catch fire and neither harmful for human without any protection. After some research, we found out wool fibreis a good thermal insulation material which has high inflammation point and totally no hazardous for directly using. The only problem of wool fibre is that it is hard to buy a small amount of pure wool fibre from the market. Therefore we moved to our second choice which is ceramic fibre blanket. It has better thermal insulation ability than wool fibre and also better heat endurance which is up to 18000F. On the top of the esky, there is a heat sink which is 100mm width, 100mm Length and 25 mm height. It has a thermal resistance of 1.750C/Wand made by aluminium which has good conductivity of heat. Under the heat sink are two peltier coolers. They are used to pump the heat of battery out though the heat sink to the ambient. They are also used for generated heat it is driving by a reversed current. The peltier cooler’s rated power is 38.1W and the maximum current is 3.9A. Below two peltier coolers is an aluminium block used as a thermal window which has been mentioned before. Between the clamp and aluminium block is the battery and it has been put in a 3D printed like box to make it stable. There are some ceramic fiber between battery and clamp to stop the heat. Below is the figure about the design of calorimetric chamber. The first thermal couple is between battery and aluminium block, second one is on the back of battery and the third on is inside of the aluminum block.
H bridges have been used to drive the peltier coolers when we need to reduce the temperature.
Experiment and result analysis
Experiment method
In this test, we choose a battery with 0.95 SOC which has been tested using open circuit method. The charging and discharging are constant and 0.9A. The temperature is 25 degree Celsius. The testing steps are shown below:
1. Charge 20 seconds
2. Rest 60 seconds
3. Discharge 40 seconds
4. Rest 60 seconds
5. Repeat from step…
The test is lasting for 2 hours and 50 minutes.
Method for analyzing
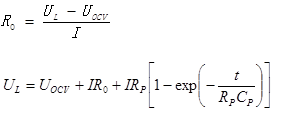
The data we got from the experiment, it is very difficult for putting them in the report because the number of data is huge. We have included those things in the usb storage drive. We have provided the data of all calculated parameter like R0, Rp, Cp, OCV and SOC. To analyse the result we have used matlab.Moreover, for getting the curve fit we used least square method and polynomial curve fit. The least square fit for getting the value of Rp & Cp.Then we have used polyfit function for curve fitting using the data we have obtained. The Circuit is given in figure (14). While giving rest, the Open circuit voltage is being going exponentially to its stable zone. As during rest the capacitor was being fully discharged, RC time constant become zero. So we can calculate the parameter using the equation below with the equation of internal resistance calculation.
From Ampere hour method, ɳ is the coulomb efficiency and C is the capacity of the battery which depends upon charge and discharge rate of battery. So for calculating SOC we can use,
Result and Analyses
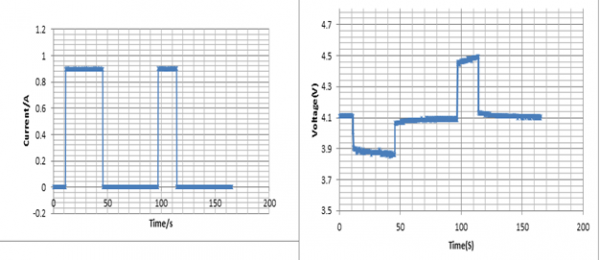
In Figure (15) I have shown a complete cycle result of voltage and current for the final test. From the left picture you can see the current pulse of charging and discharging. Longer current pulse is for discharging and shorter is for charge. The corresponding voltage is showed in the right picture. From that picture, we can observe the slow decay and increase while giving charging and discharging pulse and the change in battery voltage during rest period
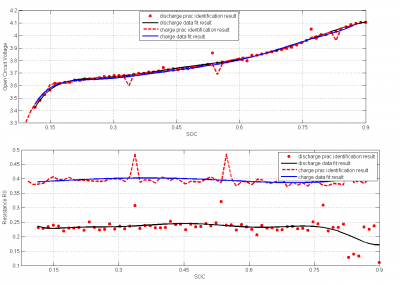
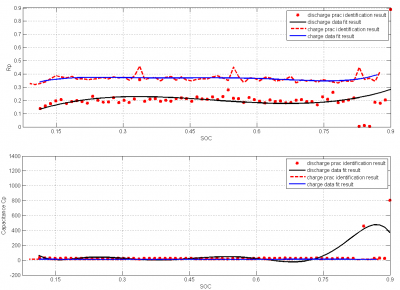
From the figure 16, we get the relation between SOC and OCV.We can see the SOC is increasing with open circuit voltage. The result is justified from the paper we have reviewed . If we see the resistance graph of R0 and Rp from figure 16 and 17, we can see that the values of them have not changed with the increase of SOC. This is also reasonable as per some paper at 25 degree Celsius.But if we see figure (17), the capacitor value from it is also stable for the change in SOC with a sudden increase of capacitance at the end part. Normally the capacitance must be increased with the increase of SOC . But the reason for the constant value is that we are not giving the enough rest periods to discharge the battery. As a result the parameter capacitor also did not discharge fully. The ideal result would be gotten when we charge the battery for a while and then give rest for a long period. After the rest period we will provide a discharge pulse for a certain time. The charge, discharge and rest period must be in minutes rather than in seconds.
Limitation and challenges: As we have seen from all the results, they are reasonable. However due to the inaccuracy in the ADC of thermo click; we were not being able to measure the temperature accurately. As a consequence of that it was impossible for us to measure the values of parameters in the thermal model. The reason behind this could be the change in reference temperature of the A to D converter.
Project Outcome
The Main Aims of the project has been accomplished successfully. We have done modelling of our battery using lump circuit and calculated the value of the parameter model. Then we have used Ampere hour method to estimate SOC. The graph between the open circuit voltage and SOC is quite reasonable compare with the paper we saw . Moreover, we have made a good measurement system controlled by micro-controller to do this experiment automatically so that we can use the data to analysis the battery condition .However The thermal model parameters of the whole experiment could not be calculated due to the inaccuracy in our thermo click. Moreover, the heat generated by the battery is very little so it was very hard to do the heat transfer calculation. The other important issue is that the size of the battery was not equal to the aluminium panel which can create complexity in the modelling.
Future Work
• The Model we have implemented, that is thevenin model where we have represented the diffusion phenomena by capacitor. But, for improving the model, you can include more parallel RC in the circuit. One of the new advanced models of the battery is PNGV model which they can follow.
• They should follow the Hybrid Pulse Power Characterization (HPPC) method to charge and discharge battery. This will make the SOC estimation easy and simple .
• Establish a Simulink model for getting dynamic behaviour for comparing with measured value.
• The thermal sensor needs to be reconsidered. They should use the other types of sensors for measuring temperature rather than using thermo click with K-type thermo couple. After having inaccuracies in our sensors we have found from papers that tmp235 is good for using in this experiment.
• The testing should be on the multiple cells of battery rather than on single cell for producing significant amount of heat. The testing should be on the batteries of different chemistry.
• In our project we have used esky; a possible improvement of the calorimetric chamber would be made by designing it in solid works and print it in a 3D printer. The heat produced by the battery must be taken into account while designing that.
• To insulate the remaining part of the box they should use thermal insulation powder or natural wool fibre.
Group Member
Haihui Wang
Shuvra Saha
Denghui Yu
Supervisors
Dr Andrew Allison[1]
Dr John Pockett
Reference
[1] Lalit P. Mandal and Robert W. Cox “A Transient-Based Approach for Estimating the Electrical Parameters of a Lithium-ion Battery Model”, in Energy Conversion Congress and Exposition (ECCE), 2011 IEEE, pp. 2365-2640.
[2] E. Kuhn, C. Forgez, P. Lagonotte, G. Friedrich “Modelling Ni-mH battery using Cauer and Foster structures,” in Journal of Power Sources , Volume 158, Issue 2, 25 August 2006, pp 1490–1497
[3] G. L. Plett, “Extended kalman filter for battery management systems of lipb-based hev battery packs part 2. modeling and identification,”Journal of Power Sources, vol. 134, pp. 262–276, 2004.
[4] Hongwen He, Rui Xiong, Xiaowei Zhang, Fengchun Sun, and JinXin Fan, “State-of-Charge Estimation of the Lithium-Ion Battery Using an Adaptive Extended Kalman Filter Based on an Improved Thevenin Model,” in IEEE TRANSACTIONS ON VEHICULAR TECHNOLOGY, VOL. 60, NO. 4, MAY 2011
[5] Ahmed RAHMOUN and Helmuth BIECHL “Modelling of Li-ion batteries using equivalent circuit diagrams” University of Applied Sciences Kempten (Electrical Review), ISSN 0033-2097, R. 88 NR 7b/2012
[6] Wen-yeau Chang “The State of Charge Estimating Methods for Battery: A Review”ISRN Applied Mathematics Volume, 2013
[7] Guoliang Wu,Rengui Lu,Chunbo Zhu and C.C. Chan “An Improved Ampere-hour Method For Battery State of Charge Estimation Based on Temperature, Coulomb Efficiency Model and Capacity Loss Model ” Vehicle Power and Propulsion Conference (VPPC), 2010 IEEE ,pp1-4
[8] Baronti, F., et al. "Enhanced model for lithium-polymer cells including temperature effects." IECON 2010-36th Annual Conference on IEEE Industrial Electronics Society. IEEE, 2010.
[9] Baronti, F., et al. "State-of-charge estimation enhancing of lithium batteries through a temperature-dependent cell model." Applied Electronics (AE), 2011 International Conference on. IEEE, 2011.
[10] Rodrigues, Shalini, N. Munichandraiah, and A. K. Shukla. "A review of state-of-charge indication of batteries by means of ac impedance measurements." Journal of power Sources 87.1 (2000): 12-20.
