Projects:2014s2-76 Teletraffic Modelling and Analysis of the New Britannia Roundabout
The objective of the project is to use teletraffic theory to construct a teletraffic model for the new Britannia roundabout. The project will also serve as an independent study by evaluating the existing roundabout’s efficacy against its previous design.
Contents
Project Overview
Aim
The objective of the project is to use teletraffic theory to construct a teletraffic model for the new Britannia roundabout. It will attempt to replicate the actual road traffic flow under a set of scenarios for analysis. The project will also serve as an independent study by evaluating the existing roundabout’s efficacy against its previous design.
Motivation
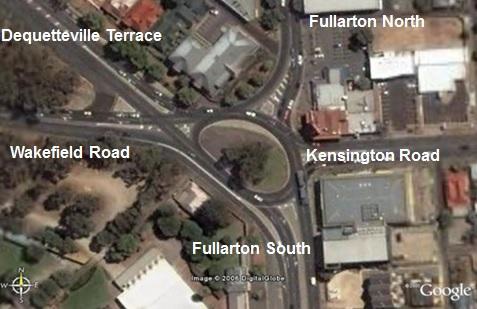
The Britannia intersection is identified by the Department of Planning, Transport and Infrastructure (DPTI) in South Australia as an essential route [1]. It forms a part of the inner city route of Adelaide where an estimation of 52,000 vehicles pass through the intersection daily [2]. The previous configuration of the intersection consists of a single dual lane roundabout serving five major roads as shown in Figure.
For years, commuters have complained about the excessive delays they have experienced during the morning and afternoon peak hour traffic [4]. It was also the worst non-signalized intersection within South Australia for collisions as there were a total of 308 recorded crashes between 2008 and 2012 [5].
There were several ideas to improve the intersection which suggestions include replacing the roundabout with traffic lights, underpass, flyovers or creation of roads [6]. However all of them were rejected due to either cost, environmental or political issues.
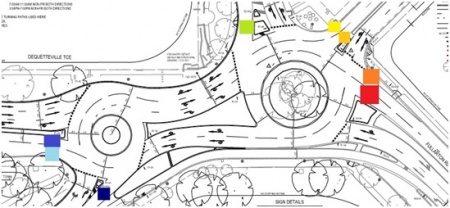
In 2013, the state government approved a $3.2 million upgrade to the Britannia intersection where it is replaced with an innovative dual roundabout shown in Figure 2. Extensive modelling suggested the new configuration will reduce crashes by up to 29% and a 10% to 15% increase in efficiency during the afternoon peak hours is expected [1].
Figure 2: New configuration of intersection [6]
The results generated from the project will act as further evidence to support or debunk the efficacy of the new Britannia roundabout. It will be of interest to the stakeholders of the Britannia upgrade and traffic engineers or researchers working on intersection solutions.
Previous Studies
A final year project group modelled the single roundabout using teletraffic theory for their final year project in 2006 [8]. Their approach regarded the roundabout as a server accepting the queuing cars from each access road, and sending them to their intended exit roads. The group came to a conclusion that the roundabout was more efficient than an intersection with traffic lights under all traffic conditions addressed. Our group will be reviewing the previous results in 2006 with our results of the dual roundabout for comparison of the two roundabouts.
Background
Queuing theory is the mathematical method of analyzing congestion and delays of waiting lines [9]. Models are constructed in queuing theory to predict queue lengths and waiting times. It has been applied to the design of call centers, routing of the traffic on the internet, shipping orders efficiently from warehouse, improving road traffic flow etc. Its roots originated in 1909 when the Danish engineer Agner Krarup Erlang created queuing models to describe the Copenhagen Telephone Exchange that he was working for [10]. The queuing system has a basic model of a process shown in Figure 3 whereby the customers arrive and wait in line for their turn to be serviced. They will leave the system after they have been serviced. It is a very useful model and serves as a basis to analyse complex queueing networks such as the new dual roundabout at the Britannia intersection.

Analysis Methods
Queuing Theory
- Characteristics of Queuing System
A queuing system can be defined by six characteristics:
- Arrival process.
- Service process.
- Number of servers in parallel.
- System capacity.
- Population constraints.
- Queuing discipline.
The Kendall’s Notation is the standard used to describe a queuing system and the format is (A/S/N/Sc/Pc/Qd) where the abbreviations represent the six traits listed earlier.
The first characteristic describes the type of arrival process and the common standard abbreviations:
- M = Interarrival times are independent, identically distributed (IID) and exponentially distributed. (Memoryless/Poisson/Markovian).
- D = Interarrival times are IID and deterministic (fixed or constant).
- G = Interarrival times are IID and controlled by a generic distribution.
The second characteristic describes the type ofthe service times. They share the same abbreviations as the arrival process:
- M = Service times are IID and exponentially distributed.
- D = Service times are IID and deterministic.
- G = Service times are IID and controlled by a generic distribution.
The third characteristic is the quantity of parallel servers in the system. Servers are considered parallel if they provide the same type of service and a customer only has to go through one of them to complete their service. The fourth characteristic is the maximum capacity that the system can hold; this includes the customers in the queue and the customers in the server. The fifth characteristic provides the size of the population where the customers are drawn from.
The sixth characteristic is the type of queue discipline. The common ones are:
- FCFS = First come, first served; the first customer waiting in line will get served first.
- LCFS = Last come, first served; the last customer waiting in line will get serverd first.
- SIRO = Service in random order; a customer is randomly drawn from the queue to enter service.
Generally only the first three characteristics are defined for majority of the queuing systems. By default, it is assumed that a system has unlimited capacity, unlimited population size and possesses a FCFS service discipline unless otherwise stated.
- Burke’s Theorem
Burke’s Theorem states that for any M/M/1, M/M/m or M/M/∞ queue under steady state conditions that possess Poisson arrival rates, then the departure process is also a Poisson process [12]. It also explains the number of customers in the queue at a specific time is independent of the departure process prior to the specific time.
- Queuing Network
The queuing system shown in section 2 (Figure 3) relates to a single server or parallel server system where a customer’s entire service time is spent with a single server. In reality there are many cases where the customer’s service is not completed until the customer has been served by more than one server. Queuing network models can be classified into three groups: open queuing networks, closed queuing networks and mixed queuing networks [13]. They function in the same manner as a single server/parallel server system. The difference is at the completion of one service, the customer has the option to proceed to another queue to be served by another server. This project will cover the open queuing network portion. In open queuing networks, the customer who has finished a service can either move to another queue to be serviced or depart from the system.
Using the Burke’s Theorem in section 3.1.2, the splitting and combining of Poisson processes in an open queuing network simple means that the arrival process will follow the Poisson distribution to each queue.
- Jackson Network
A Jackson network is essentially an arbitrary open network of M/M/m queues that makes use of the Jackson theorem to have a product-form solution [13]. The Jackson theorem states that as long as the arrival rate at each queue allows for equilibrium, it is possible to obtain the joint state distribution of the queuing network. The internal arrival rate can be found by assuming the system is at steady state conditions:
where j = 1,..., K and Λj is the external Poisson arrival rate. For example there are three queues feeding to internal queue 1. The first queue is an external queue with an arrival rate of 0.1 that only goes to internal queue 1. The second queue is an external queue with an arrival rate of 0.08 that has a 50% chance of going to internal queue 1. The third queue is an external queue with an arrival rate of 0.15 that has a 10% chance of going to internal queue 1. The internal arrival rate of this queue is 0.155. The implications of Jackson Theorem are:
- Once the possible destinations have been worked out, all queues in the system can assessed individually.
- The connections joining the internal queues will behave like a Poisson process, even if there is a feedback in the system.
Analysis of Roads Leading to Britannia Intersection
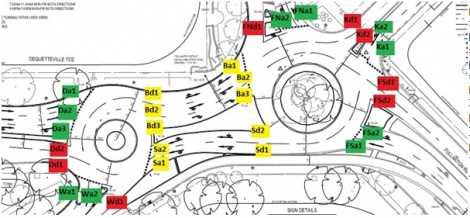
- Naming conventions for lanes and Britannia Layout
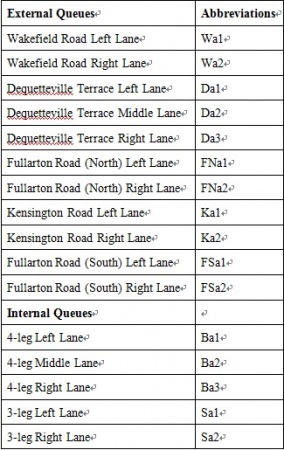
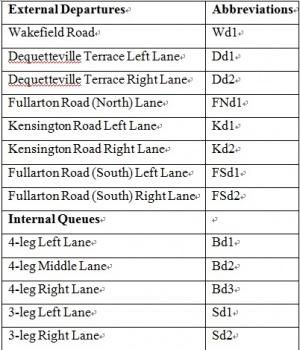
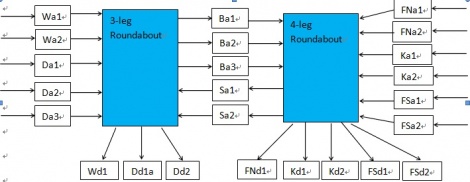
The general Jackson network queuing system for the Britannia intersection is shown in Figure 5. The external arrows pointing to the green boxes indicate the arrival of jobs (cars) to the external queues (lanes). The two servers (roundabouts) are identified in blue and they will service new jobs whenever available until completion and depart from the server. Then the jobs have an option to enter the next server by joining the internal queues indicated in yellow or choose to depart from the system by following the exits marked in red.
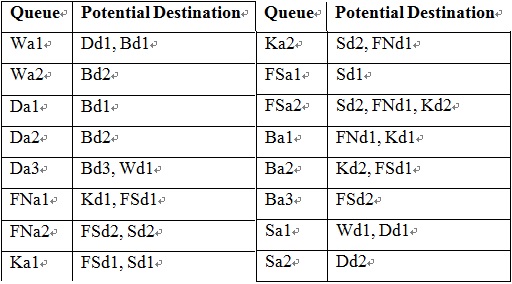
- Queues with Potential Destinations
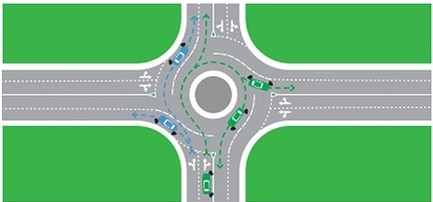
Each queue has potential destinations that its jobs could travel to. The general guideline according to South Australia’s The Driver’s Handbook for approaching multi-lane roundabouts:
- First exit on the left is only available for vehicles on the left lane.
- Either lane can be used if heading straight on.
- Leaving from third or any subsequent exit must be done on the right-hand lane.
It is assumed that the vehicles are not performing any U-turns when using the Britannia intersection. Hence, the potential destinations for each queue are:
- Queue Destination Probabilities
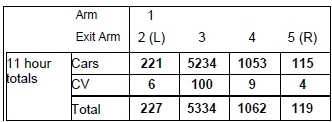
The probability for each destination for a given queue is derived from the Vehicle Turning Movement Survey provided by DPTI . An example of the movement survey in Figure 7 shows the actual figures of vehicles from which arm (road) they enter and exit the Britannia intersection.
However the movement survey only captures the probability of the entire specific road instead of each lane in the particular road. This issue was resolved first by splitting the vehicles equally among the lanes in the road. Then by using the potential destinations of each queue in the specific road listed in section 3.2.2, it is possible to work out the exact probability of each queue.
- Maximum Queue Length
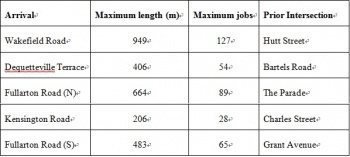
Each queue has a set maximum length which was found by using the measure distance feature on Google Maps to measure from the stop line of the Britannia intersection to the prior intersection feeding the queues. The results are shown in Table 4. It is assumed the average car length in South Australia is 5 metres and they are waiting in the lane separated by half a car length distance (2.5 metres). The maximum queue length is then divided by 7.5 metres to determine the maximum jobs that each queue can hold. For this project, only cars are considered in the modelling process to avoid complications of introducing commercial vehicles like buses due to time constraints.
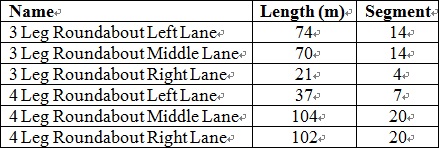
The implications of queues having limited lengths meant that the queuing system of the Britannia intersection has limited capacity. Theoretically, once the system has reached its full capacity, it will reject potential arrivals until there is space to accept new arrivals. However in the real situation, the cars outside the queues will still wait to enter the Britannia intersection as they are unable to manoeuver out of their lanes freely if the car in front does not move. The maximum lengths of the internal queues (Table 5) are found by using the scaled dimensions of the new Britannia Roundabout that the group has obtained from DPTI . The limited lengths of the internal queues have a huge impact on the modelling. If the length is exceeded, the arriving jobs will spill over to the server and cause the server to malfunction. It was decided that the jobs from the external queues heading for a maxed out internal queue will be prevented from entering the server even if the server has space for it to enter.
- Queues Considered as Poisson Process
As the arrival of cars is independent of one another and it is impossible to determine when they will come, a Poisson distribution would be able to model the random arrival queues. The Poisson distribution is given as :
where x = 0,1,2,3,4,…, e is the base of natural logarithm (2.71828) and λ is the long run average rate. λ can be found by using Little’s Law [19] which states that the arrival rate is the number of jobs over the average time:
By using the information from the movement survey where the quantity of vehicles for each lane are worked out, the arrival rate for each external queue are calculated. The external arrival rates are shown in Table 6. The arrival rates for the single roundabout are provided in Table 7 for analysis purpose in the results section.
The internal arrival rates are calculated from the formula shown in section 3.1.4.
Analysis of Roundabouts
- Characteristics of Roundabouts
The roundabouts are essentially servers in series. Right-hand drives are practiced in South Australia, so the cars will travel inside the roundabout in a clockwise direction until they eventually depart. The cars will enter the roundabout when the roundabout traffic to its immediate right is clear.
- Segmentation of roundabout
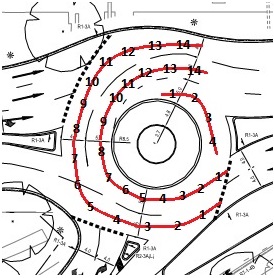
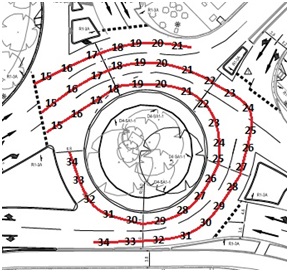
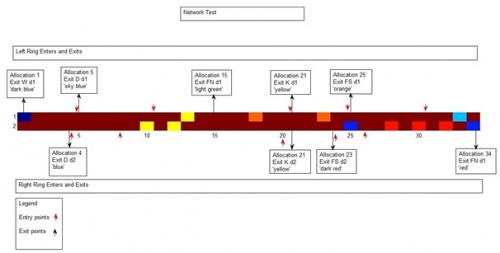
The group has obtained the scaled dimensions of the new Britannia roundabout from DPTI. It was used to measure the exact distance of the rings of the roundabout. It is then divided into segments of 5 metres and assigned a number as shown in Figure 8 and 9.
There are three reasons why the roundabouts are analysed in this way.
- Average length of car
- Stopping distance
- Assignment of entry and exit numbers
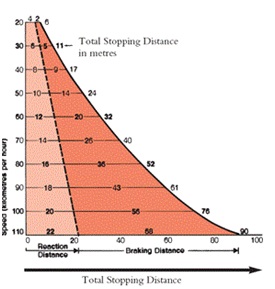
It was discussed earlier in section 3.2.4 that the average car length is 5 metres. In addition, the diagram in the Driver’s Handbook (Figure 10) shows that the total stopping distance required for a vehicle travelling at 20 km/h is 6 metres. By assuming the car moves at a speed of 5 m/s or 18 km/h, the total distance will be approximately 5 metres. This allows for implementation consistency for cars to be separated by an empty segment. One of the limitations of this model is the assumption that all cars are travelling at the same speed as drivers in real life display different driving patterns.
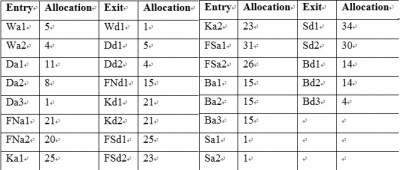
Each segment allocation had been assigned a reference number in order to dictate the entry and exit allocations. The lane of a given road will enter the corresponding ring of the roundabout.
- Entry and Exit Rules
It was analysed that to enter the roundabout safely, there are a set of rules to follow.
- Entry segment allocation to allow a space ahead for any jobs already on the roundabout
- Three spaces before the entry allocation to ensure sufficient space for oncoming jobs on the roundabout.
Each job on the roundabout held information dictating its destination in the form of the exit allocation number.
Implementation
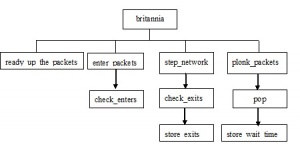
A software requirements specifications document was produced to reduce development effort of the queuing model as it forces the group to consider all requirements strictly before the programming begins and reduce later redesign, recoding and retesting. It also acts as a baseline for validation and verification. The design was supposed to be modular so that each module can be tested individually and validated it is working as intended before integration of other modules. A bottom-up approach is used in the testing and integration of modules. It also allows new modules to be integrated to the system seamlessly without any major amendments to the existing ones in the later stages. MATLAB was used to implement the queuing model as there were lots of matrixes to configure and the group members had experience in dealing with MATLAB which saves time in learning a new programming language. Java was then used as a visual representation of the Britannia intersection.
MATLAB
- Queuing process
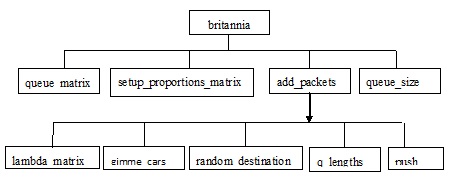
A matrix consisting of 11 rows and 129 columns was created to represent each external queue. The first column in each row was reserved to remember the pointer to the column for the next ‘pop’ operation. The second column of each row was used to hold the pointer to the column for the next ‘push’ operation. The ‘push’ function will add a new job to the back of the queue while ‘pop’ will remove a job from the front of the queue to replicate the FCFS service discipline. Another matrix of 5 rows and 9 columns represents each internal queue with the same purpose. It is then checked to ensure that the external queues are kept at or below the maximum range. The maximum lengths of the five roads can be adjusted by editing the ‘max_q_lengths’ matrix. The maximum lengths of the internal queues use a separate matrix. The maximum queue lengths were stored as the maximum number of jobs. When the ‘random_destination’ function is called, a random destination was given to a new arriving job to the queue. The generated random destination was consistent with potential destinations for the particular queue. The potential destination was based on the defined destination probability. The ‘setup_proportions_matrix’ routine was called at the start of the program and set the ‘proportions_matrix’. This routine takes the available destinations for a particular queue, each destination’s respective probability and generates 11 rows and 100 columns. Each row contained the potential job’s destinations, with the quantity of each destination consistent with their respective probability. For example, a particular queue has destinations of destination_1, destination_2 and destination_3, in proportions of 30, 10 and 60 respectively. One row would represent this particular queue, and within this row, the first 30 columns would have entries of ‘destination_1’, the next 10 columns would have entries of ‘destination_2’, and the last 60 columns with ‘destination_3’. Whenever a random destination is required, MATLAB will generate a random number from 1 to 100, and obtain a packet destination in that respective column.
- Roundabout
.
The available spaces on the segments were represented with values of ‘99’ in the ‘network_ring’ matrix. Jobs being routed were represented by their exit allocation number.
- Entry Rules
- Exit Rules
- Output Files for Results and Simulation
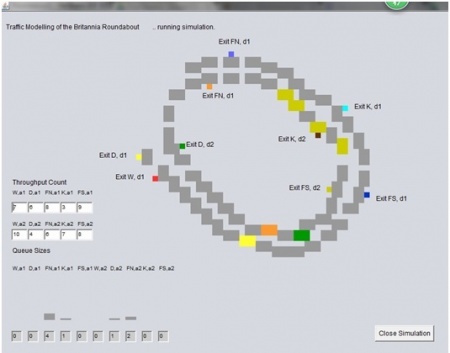
A visual representation of the jobs entering, moving and exiting the two servers can be displayed by opening the customized ‘network_ring.fig’ figure first and then run the MATLAB execution. Each exit destination has a unique colour identifier so that the user can identify the destination of a job on the server easily (Figure 14). The simulation runs according to the processing of the program, which aids in the testing and troubleshooting process to ensure that the jobs move in sequence, enter and exit at the correct allocations (Figure 15). However, it is unable to show where the servers are split but it can be noticed at a certain portion at segment 15 where the jobs stop at a location and then reappear at the next allocation after a short period of time.
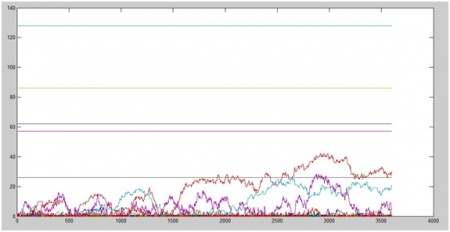
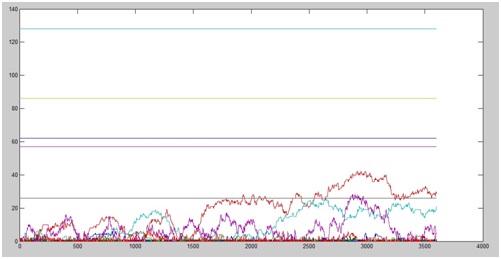
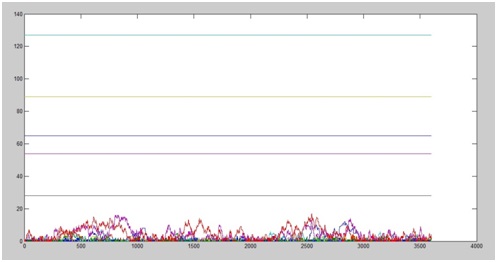
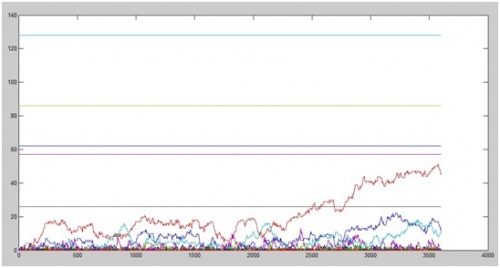
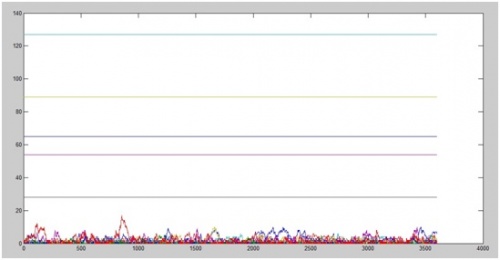
A graphical output showing the queue lengths for the external queues over time (Figure 16) was generated at the end of the MATLAB execution to allow the user to understand the queue trends as Poisson arrival jobs were added and the servers removing the jobs from the queues. The maximum queue lengths are indicated as straight horizontal lines on the graph.
When the queuing model has completed the number of steps, the MATLAB output window will display the following items:
- Number of steps completed
- Number of seconds simulated
- Quantity of jobs serviced through the intersection
- Average and standard deviation of waiting time for each job serviced
This helped in the consolidation of results needed to analyse the performance of the configuration. MATLAB will also generate three text output files to allow for simulation in NetBeans upon completion of the program. The files served as the input for Netbeans to display the jobs occupying the allocations on the roundabouts, the queue length and the throughput in a more user-friendly way.
Demonstration Models
- Design of demonstration models
A free Java-based software called NetBeans IDE is used for simulation, experimentation and visual representation of both the Britannia single and dual roundabouts. JFrame form files, which the group used for graphical display, are created to write and design the Java code and components available in the Java library.
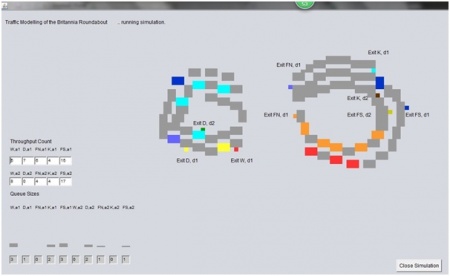
The graphical display form showed packet allocations which are designed to represent the respective exit locations on the Britannia single and dual roundabout configurations. Figure 17 and 18 shows the graphical display form of both Britannia single and dual roundabout configurations respectively.
The concept for designing and simulation procedures is similar for both Britannia single and dual roundabout configurations. Grey overlay panels for lane paths and exit locations are designed by referring to layouts provided by DPTI. The packets and exit locations are represented with various colours to allow the group to achieve visual analysis results with higher accuracy. These different variations of colours allow stakeholders and interested parties to visualise the random movement of packets on both single and dual roundabout configurations.
In the graphical display forms, throughput and queue length detailed results of different exit locations are shown on the left side. The forms illustrate the length of queues relative to other queues by column panels and a table measuring the quantity of packets that have left a particular queue.
The design of both single and dual roundabout graphical display forms also require respective modeling computations from MATLAB to introduce packets for simulation other than Java programming from NetBeans IDE. The purpose of using Java programming in NetBeans is to read respective MATLAB output source files as input to display packets occupying the allocations on both the single and dual roundabout configurations. The written Java program shall read the MATLAB output source files as input, followed by performing a 'stringtokenizer' function and then perform a 'while' loop function to display the movement of packets from one grey overlay panel to the next corresponding grey overlay panel on the graphical display form. Each of the string packets has a specified set of values. In both single and dual roundabout configurations, each of the values have corresponding colours to show the packets' location and destination, number of packets and column panel variations on the bar graphs. The Java code for the dual roundabout configuration is attached in Appendix B.
- Input source files
Each of the input source files used in the NetBeans IDE contain text from MATLAB to allow graphical representation display from the generated modeling information. All the input source files shall be opened by WordPad.
Simulation and Performance of Software
- Quadstone Paramics
Demonstration models are crucial to simulation and experimentation for results which the group also need for analysis. Initially, the use of Quadstone Paramics was proposed for visual simulations and presentations, but after further research and discussions, the group decided to discontinue with the proposal since the calculation and modelling methods are a 'black box' and the group was facing a risk of time constraint. DPTI used this software for their simulation and analysis, therefore their results are based on the software calculation and modelling methods. There are numerous functions to simulate real-time scenarios and effects in this software.
- Netbeans IDE
The functionalities provided by NetBeans IDE are basic and limited and due to time constraints, basic models for simulations are designed with the basic functional requirements. The functional requirements are calculated and expressed as performance indicators, which are 'Waiting Time', 'Throughput Count' and 'Queue Length'. There are various assumptions being made like dry weather and cars as the only type of vehicle on the road.
The graphical display forms show the random movement of packets in the roundabout effectively and those packets exited at the location they randomly chose. The length of each queue, using column panels and values, effectively show the variations and the stakeholders are able to understand the source of packets and packet switching. The data tally of packets that have entered the two roundabout configuration demonstrated data storage capability.
- MATLAB
The queuing model was able to perform and show the visual representation of 3600 steps in less than four minutes. The simulation is noticeably faster when the servers’ visual representation was not shown. It simulates the real time of one hour data in only around one minute. It is possible to speed up the process more by efficient code writing. The MATLAB-based queuing network model was able to achieve one of the main objectives of the project that is to construct a teletraffic model suitable for the new Britannia roundabout.
Results
The morning peak hour, afternoon peak hour and 12 hour traffic were the three scenarios simulated for the two configurations. The project team is able to simulate the scenarios based on the two configurations’ movement survey obtained from DPTI and achieve the results. There were 50 simulations for every scenario in each configuration to spot for any inconsistency in results. Each simulation was recorded in an Excel file. The other scenarios at other times were not considered as it will not produce any concrete evidence for efficacy of the two configurations due to the low arrival rates.
The dual roundabout configuration results were achieved by enhancing the queuing model programming that the previous project group did in 2006 to suit the present needs. The modified model consists of an additional external queue, a second server, new functions to control the internal queues and increased server capacity. The queuing model was not written from scratch mainly as the project team deems the previous group did a fair analysis of the single roundabout model. This saves a lot of time which allows the group to invest more resources in research. It also allows for results consistency when doing analysis of the two configurations as the basis for programming the queues and servers are similar.
The single roundabout results were obtained by using the previous group’s model and updating it with the actual arrival rates that was derived from the single roundabout data given by DPTI which the previous group did not manage to get.
The performance indicators chosen were the waiting time spent to enter the intersection, the queue lengths of each road, and the quantity of cars that the intersection has serviced.
Waiting Times
The average waiting time to enter the Britannia intersection is calculated by taking the average of the waiting times of the five external roads.
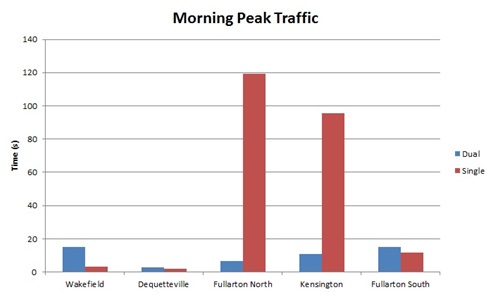
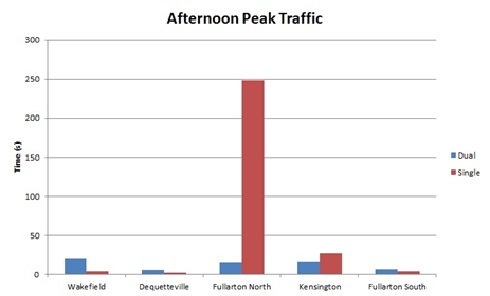
It can be deduced from the results that the upgrade to the Britannia intersection has reduced the average waiting time to enter the intersection by 4.5 times for morning and afternoon peak scenarios. The morning peak traffic has seen an improvement of 36.2 seconds while the afternoon peak traffic has improved by 44.7 seconds. There is a slight improvement of 4.8 seconds for the 12 hour traffic. An in-depth inspection was done on the morning and afternoon peak waiting times to spot the waiting time on individual roads. The average waiting time for a particular road is given by take the average of the waiting time of all lanes on the road and displayed in Figure 25 and 26. The average waiting times have reduced significantly for Fullarton Road (North) and Kensington Road in the morning peak hour traffic. It was noted that only Fullarton Road (North) experienced vastly reduced waiting times in the afternoon peak hour traffic while Kensington Road sees a slight improvement in waiting time. It can be said that the revamp did improve the city bound traffic coming from the east suburban areas. The much improved Fullarton Road (North) may be due to the design of new intersection. In the old single roundabout, cars at Fullarton Road (North) have to compete with vehicles coming from Wakefield Road, Dequetteville Terrace and Fullarton Road (South) as they have to wait for breaks in the roundabout traffic to its immediate right. Wakefield Road and Dequetteville Terrace traffic in particular dominated that small portion of the roundabout over Fullarton Road (North) traffic. With the introduction of a third lane in the new intersection from Dequetteville Terrace to Kensington Road, it creates more chances for Fullarton Road (North) traffic to enter the roundabout. It should be noted that the average waiting times have increased slightly for Fullarton Road (South) and Dequetteville Terrace traffic since the upgrade. Wakefield Road traffic also has to wait much longer than before for the morning and afternoon peak hour traffic. This could be due to the removal of the give-way triangle between Wakefield Road and Dequetteville Terrace meant that Wakefield Road traffic heading for Dequetteville Terrace will now have to go through the queuing process to enter the roundabout instead of bypassing it completely.
Queue Lengths
The length of each queue is increased whenever new jobs arrive and decreased when jobs enter the roundabout over a period of 1 hour.
In the previous configuration for the morning peak hour traffic (LHS), the queue lengths of Fullarton Road (North) and Kensington Road are increasing over time but they are manageable and well within the maximum allowed queue length. The highest number of jobs waiting for service recorded is at around 40 jobs out of a possible 86 jobs at Fullarton Road (North).
In the same scenario for the dual roundabout configuration (RHS), the queue lengths of all roads are pretty much even with the number of jobs waiting to be serviced lower than 20 jobs at any queue.
For the afternoon peak hour traffic in the old configuration (Figure 29), the queue length of Fullarton Road (North) in particular is increasing at a steady rate from the 40 minute mark before dipping towards the end of the simulation. It should be noted that the length is still within the maximum allowed queue length. The highest number of jobs waiting for service recorded is at around 50 jobs out of a possible 86 jobs at Fullarton Road (North).
The result of the queue trends for the afternoon peak hour traffic in the new dual roundabout (Figure 30) depicts a similar picture as the morning peak hour traffic. The queue lengths of all roads are relatively even with the number of jobs waiting to be serviced lower than 10 jobs at any queue.
From the results, it can be said that the new dual roundabout has brought about reduced queue lengths over time in the morning and afternoon peak hour traffic.
Throughput
The throughput from the simulation results were:
Overall the new configuration has seen improvement across all the scenarios with special mention to the afternoon peak hour traffic having a 24.9% improvement in throughput. The improvements done to the intersection by DPTI could have increased the confidence of the driver’s ability to navigate the once notorious intersection, thus bringing more motorists to the intersection. It is evident from the increase in arrival rates for most of the roads. The upgrades done by DPTI are explained in section 5.5.
Comparison with DPTI Reported Results
In the design phase, DPTI announced on its Britannia website [2] that it expects to see an improvement in afternoon peak efficiency of 10% to 15% and a shorter travelling time through the intersection from 78 seconds to 38 seconds. It predicts the morning peak efficiency will be at the same level as the single roundabout.
The statements are consistent with the project team simulation results; the morning peak efficiency has increased by only 5.4% while the afternoon peak has improved by 24.9%. Although there was no indication of how the travelling time was defined in the website, the reduction of travel time by 40 seconds is similar to the project team’s reduction waiting time to enter the intersection by 36 seconds in the morning and 45 seconds in the afternoon.
It must be mentioned that the simulation results are based off real data and they are fairly consistent with DPTI’s design predictions prior to implementation. This is strong evidence that the queuing model is working as intended.
Other Performance Improvements
There are other performance improvements that queuing theory alone is unable to justify.
DPTI estimated that the number of crashes in the intersection will reduce by up to 29% during their design of the new dual roundabout [2]. The official figures stated the accidents have reduced by 33% during the first six months since the upgrade [21].
The improvements made to the lighting, road direction arrows and advanced directional gantry signage are placed on all five legs of the intersection that gives cars sufficient time to position themselves in the correct lanes before entering the roundabout. This lowers the possibility of drivers changing lanes suddenly when they realise they are in the wrong lane, thus lowering the chances of accidents occurring [2].
The splitting of the complex five leg roundabout into a standard four leg roundabout and a three leg roundabout ensure that motorists understand it more easily as three and four leg roundabouts are common throughout Adelaide. It also results in the reduction of speeds through the intersection and provides more time and space for cars to move through the intersection [2]. The reduction of speed is caused by the shorter length of each roundabout and having to stop at the internal lanes to access the other roundabout. Even though the speed has been reduced, the results have showed an increase in throughput.
Conclusion
With a good project management and team strategy, the team is able to achieve the main objectives of constructing a teletraffic model of the new Britannia intersection and evaluate its efficacy against the previous model. The design of the queuing network model is able to produce most of the characteristics of queue formation and fair service. The software also allows for new modules to be integrated to the system in future. The results of the simulations has shown that the new upgrade to the Britannia intersection generally has enhanced the performance in terms of reduced waiting time, shorter queue lengths and increase in throughput.
Further work
In order to model the queuing system as accurately as possible, the addition of another queuing process can be considered in the form of public buses. Their arrival are based on their bus schedule, hence their arrivals are not random. There are many complications in handling this as heavier vehicles require a longer stopping distance and this can affect the entry rules in the roundabout. It should be noted that in the movement survey, commercial vehicles only account for 1.5% to 4% of the traffic on each leg. Therefore the results may not differ much. Another consideration will be to research on how to handle choked roundabouts. The group went for a site survey and noticed the cars in the internal queues often exceed the allowed queue length and spill over to the roundabout. The current system assumes the roundabout servers are always stepping with no stops. The spill over was mitigated by preventing the job heading to a particular internal queue from entering the roundabout if the quantity of cars in that internal queue and the cars in the roundabout of the same destination exceed the maximum queue length. Another scenario will be to find out if it is feasible to handle the queues and the servers when an accident occurs inside the roundabout. Research could be done to investigate the possibility of cars travelling at different speeds in the roundabouts instead of one fixed speed. In the real life the cars are travelling above the assumed speed of 18 km/h and they do not have uniform speed across all cars.
Team Management
Team Members
- Mr Francis Lee
- Mr Jun Lee
- Mr Conggang Ren
Supervisors
- Prof Lang White
- Dr Brian Ng
Reference
[1] K. Zhang and A. Excell, "An innovative dual roundabout - design drives behaviour change," in 4th International Conference on Roundabouts, Seattle, 2014.
[2] DPTI, "Fast facts - Infrastructure - Department of Planning, Transport and Infrastructure (DPTI)," 18 June 2013. [Online]. Available: http://www.infrastructure.sa.gov.au/content/britannia/fast_facts. [Accessed 12 April 2015].
[3] ABC News, "Double roundabout planned for Britannia corner in Adelaide," ABC News, 5 June 2013. [Online]. Available: http://www.abc.net.au/news/2013-06-04/britannia-roundabout-double-adelaide-traffic/4731798?section=sa. [Accessed 12 April 2015].
[4] DPTI, "The Britannia Intersection Upgrade," 2013. [Online]. Available: http://www.infrastructure.sa.gov.au/__data/assets/pdf_file/0019/113095/Britannia_Roundabout_-_Factsheet_-_June_2013.pdf. [Accessed 12 April 2015].
[5] G. Maps, Artist, Britannia Roundabout Earth View. [Art]. Google, 2015.
[6] D. Nankervis, "Britannia Roundabout to get $3.2m overhaul in South Australia State Budget," The Advertiser, 4 June 2014. [Online]. Available: http://www.adelaidenow.com.au/news/south-australia/raas-risky-roads-study-finds-motorists-want-roads-repaired-before-big-ticket-infrastructure-items/story-e6frea83-1226656523805. [Accessed 12 April 2015].
[7] DPTI, Artist, Fullarton Road Intersection Traffic Control. [Art]. Government of South Australia, 2013.
[8] H. J. Ly, "Traffic Modelling of the Britannia Roundabout Final Report," Adelaide, 2006.
[9] M. Zukerman, "Introduction to Queueing Theory and Stochastic Teletraffic Models," 2000 - 2015. [Online]. Available: http://www.ee.cityu.edu.hk/~zukerman/classnotes.pdf. [Accessed 12 April 2015].
[10] V. Sundarapandian, "7. Queueing Theory," in Probability, Statistics and Queueing Theory, New Delhi, PHI Learning Private Limited, 2009.
[11] D. G. Kendall, "Stochastic Processes Occurring in the Theory of Queues and their Analysis by the Method of the Imbedded Markov Chain," The Annals of Mathematical Statistics, vol. 24, no. 3, pp. 338-354, 1953.
[12] P. J. Burke, "The Output of a Queuing System," Operations Research, vol. 4, no. 6, pp. 699-704, 1956.
[13] J. R. Jackson, "Networks of Waiting Lines," Operations Research, vol. 5, no. 4, pp. 518-521, 1957.
[14] T. D. Handbook, "Approaching and entering a roundabout," Government of South Australia, 2015. [Online]. Available: http://mylicence.sa.gov.au/road-rules/the-drivers-handbook/roundabout.
[15] T. S. M. Herald, Artist, Transport for NSW says rules on driving on roundabouts are some of the most misunderstood in the state.. [Art]. 2013.
[16] DPTI, Artist, Vehicle Movement Turning Survey. [Art]. Government of South Australia, 2014.
[17] Holden, "Commodore Range," Australia, 2015.
[18] U. Amherst, "Statistics The Poisson Distribution," UMass Amherst, [Online]. Available: http://www.umass.edu/wsp/resources/poisson/index.html. [Accessed 2015].
[19] J. D. C. Little, "A Proof for the Queuing Formula: L = λW," Operations Research, vol. 9, no. 3, pp. 383-387, 1961.
[20] DPTI, "Speeding and Inappropriate Travel Speeds," Government of South Australia, [Online]. Available: http://mylicence.sa.gov.au/road-rules/the-drivers-handbook/speeding. [Accessed 2015].
[21] M. Mooney, "Figures show fewer crashes at dual Britannia Roundabout," Seven News, 27 May 2014. [Online]. Available: https://au.news.yahoo.com/sa/a/23892414/figures-show-fewer-crashes-at-dual-britannia-roundabout/. [Accessed 2015].
