Projects:2014s2-82 Grid Integration of Solar PV Embedded Generation
This project focuses on two main parts which are power system modeling and probabilistic analysis, and PV system inverter experiment and data analysis. For power system modeling and probabilistic analysis, it aims to properly build up the power system uncertainties models such as system demand, renewable generation and load flow, thus based on those models to implement probabilistic analysis to assess power system security. For PV system inverter experiment and data analysis, it aims to conducting steady-state and transient experiments on PV inverter, hence to obtain the characteristics of the inverter.
Contents
Project Information
Background
Due to the decreasing of natural resources and greenhouse effect, renewable energy is widely used through the whole world. In South Australia rooftop solar PV installations has proliferated with total capacity up to 500MW. However, because of the variability associated with solar power, planning and operating a power system with high penetration of solar power require special consideration of their impact on power system security, and also solar PV system cannot be scheduled and dispatched similar to traditional synchronous generators because they depend on intermittent solar irradiation, so proper risk-based security assessment method needs to be implemented to ensure the security of the power system. Meanwhile transient and steady-state effect of PV system inverter to the power system needs to be concerned as well.
Motivation
Traditional deterministic security assessment does not take into account the probabilistic nature of power system behaviour especially when it comes with solar PV embedded generation, the effect from uncertainty of load demand and distributed generation will become significant, so to present a probabilistic approach risk-based assessment with solar PV power generation highly embedded is important. In order to implement system security assessment, accurate system uncertainty models are needed to be built up first, and those models are based on large amount of relevant data, so proper data analysis will be implemented as well.
Understanding the characteristics of steady-state and transient behavior on solar PV inverters is crucial importance for network analysis. This is also a necessary prerequisite for the development of reliable aggregated models for steady-state power flow models.
Objective
The objective of the project are,
- Modelling power system uncertainties
- Implementing probabilistic analysis.
- Demonstrating proper case study
- conducting steady-state characterisation experiments on solar PV inverters
- conducting transient characterisation experiments on solar PV inverters
Modeling and Probabilistic Analysis
Modeling
The power system modeling includes modeling power system uncertainties which focuses on building up the models of system demand, wind power generation and solar PV generation, and modeling the power system load flow.
Power System Demand
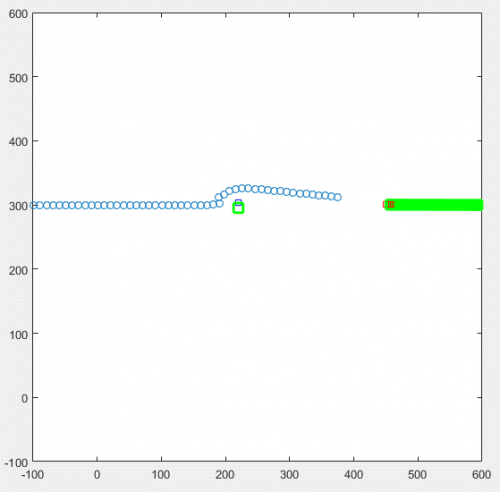
Based on literature review the power system demand can be modelled by normal distribution. And the demand is normally varying in regions, in different dates and seasons, so for a regional demand the models are split up in a warmer and a cooler period, further, split up in weekdays and weekends. Meanwhile due to the high ambient temperature in warmer period, the demand curve is significantly different when the temperature is over 35℃, so for warmer period the demand model will be split up further by the temperature. And as an example, the 6 different types of mean value of demand curve from Metro Region are shown in Figure 1.
Wind Power Generation
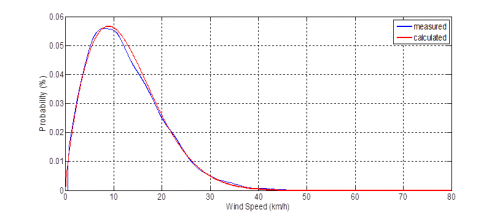
Based on literature review, wind speed in a region can be modelled by a two-parameter Weibull distribution. As an example, the measured probability density function of wind speed in Middle North Region and corresponding formulisation of Weibull distribution are shown in Figure2.
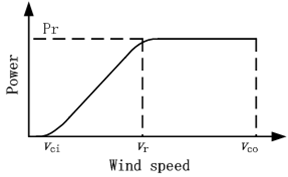
From Figure 2, the calculated curve is well matching the measured one which indicates the wind speed can be properly modelled by Weibull distribution. And non-linear model is used to build up the relationship between wind speed and output power which is shown in Figure 3.
Solar PV Generation
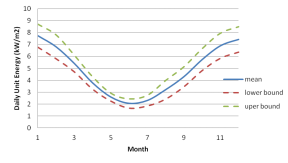
Step 1: Unit daily energy is modeled by Normal distribution, Figure 4.
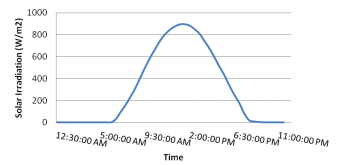
Step 2: Formulizing the ideal solar irradiation curve, Figure 5.
Step 3: Scale the ideal irradiation curve with ratio of unit daily energy between Step 1 and Step 2.
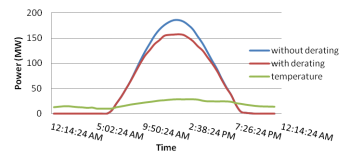
Step 4: Using scaled irradiation curve to calculate the PV output power with considering temperature derating, Figure 6.
Power System Load Flow
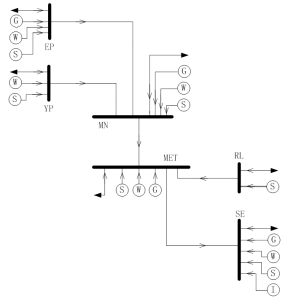
Because this project is based on aggregated measured data analysis, and also due to lack of system parameters, so a simplified load flow model is implemented which uses one single bus to represent a region, hence simplifies the SA power network into 6 buses system. Those 6 buses represent corresponding regions which are Eyre Peninsula (EP), Yorke Peninsular (YP), Middle North (MN), Metro (MET), River Land (RL), and South East (SE). The simplified load flow connection structure is shown in Figure 7.
Probabilistic Analysis
Based on the models developed in previous sections, probabilistic analysis includes comparison of stochastic characteristics of regional renewable generation, the effect of increasing renewable generation to the power system and system security assessment in detail.
Stochastic Characteristics of Regional Renewable Generation
The capacity factor, which is the ratio between the actual output power and its installed capacity, is used to compare the stochastic characteristics of the renewable generation of each region.
The capacity factor of wind power generation is shown as,
![]()
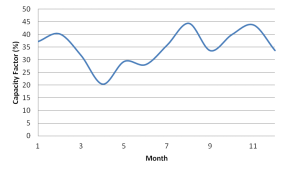
And as an example, the monthly average of daily capacity factor of wind power generation of YP region is generated and shown in Figure 8.
The capacity factor of Solar PV generation is shown as,
![]()
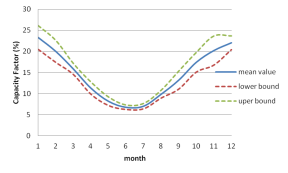
The mean value of daily capacity factor in one month actually is proportional to its unit daily energy, and from Figure 4, which indicates the mean value of daily capacity factor in one month can be modeled by normal distribution as well, shown in Figure 9.
Contingency
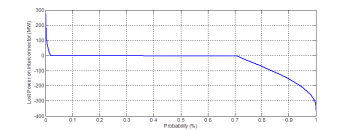
When lost half of transmission lines between two regions at certain time point, double the power on the remaining transmission lines first to check whether they can deliver the doubled power without affecting their thermal capacity or not, if the value is not over the thermal capacity then this remaining lines can cover the power loss of another line, otherwise reducing or increasing the thermal generation in closest region depending on the direction of power flow to cover the losses. As an example, the lost power can’t be covered by remaining transmission lines of interconnector between South Australia and Victoria in one year is shown in Figure 10.
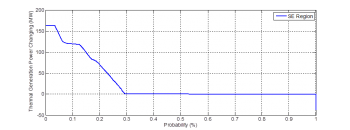
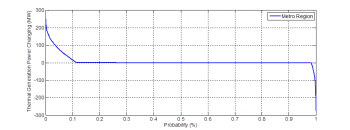
And the simulation results illustrate the power losses can be cover by only changing the thermal generation in SE and MET region which are shown in Figure11 and Figure 12.
Thermal Capacity
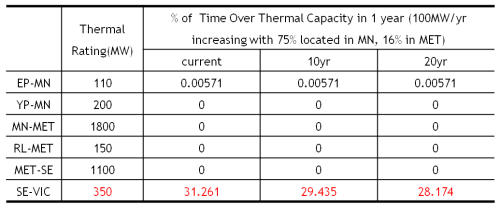
In this scenario, assuming the PV generation installation capacity is increasing 100MW each year, and 75% of increasing is located in MN Region, 16% in MET Region, and evenly spread in other regions. The simulation results are shown in Table 1.
Combing with the case study demonstrated in 'Contingency', when contingency is happened causing losing half transmission lines between SE-VIC means halving the thermal rating of SE-VIC, the simulation results are shown in Table 2.
Expected Energy Not Supplied
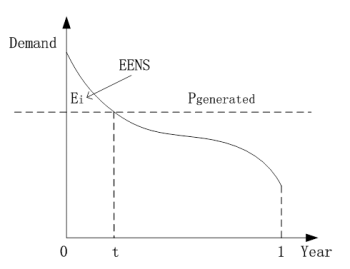
With certain machine failure rate and combining PV generation into demand, then the probability of wind power generation and f thermal generation can be calculated, hence to calculate the EENS which is shown in Figure13.
Considering all the probability of wind power generation and f thermal generation, the EENS of one year is shown in Table 3.
Referring to section 'Thermal Capacity', under current thermal capacity condition shown in Table 1 the 100MW/yr increasing of PV generation installation capacity will barely affect the transmission lines up to 20 years. If adding up those yearly increasing to the case demonstrated here, the simulation results are shown in Table 4.
Experiment and Data Analysis
Experimental Design
Main Experimental Equipment
1. YC500A Micro-inverter YC500A micro-inverter is the flagship product of APS America, which is a grid-tied micro-inverter with intelligent networking and monitoring systems. YC500A micro-inverter converts the DC power from the solar module to the proper AC current for power grid. Single unit connects two module and it has a pair of AC connectors. See Figure 14.
2. California Instruments Power Source
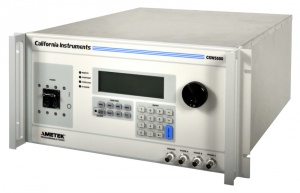
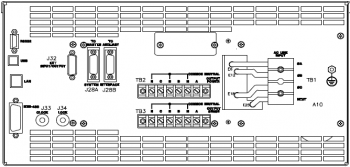
The California Instruments CSW 5550 AC/DC Power Source combines a flexible AC/DC power source with a high performance power analyzer. It can offer a 0-156/0-312V AC or DC voltage range and 40-5000Hz output frequencies. CSW 5550 can be operated from an easy to use front panel keypad. See figures below.
Experimental Setup
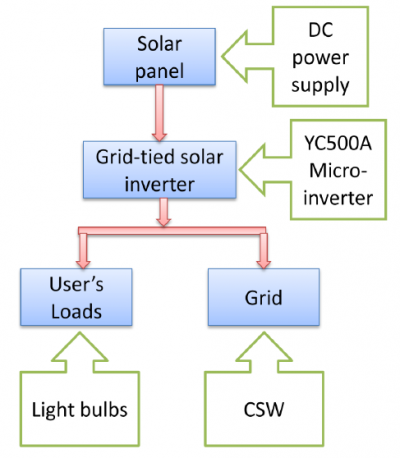
A grid-connected PV generation system is electricity generating soalr PV system that is connected to the utility grid. It consists of solar panels, one or several inverters, a power conditioning unit and grid connection equipment. In order to conduct steady-state and transient characterisation experiments on solar PV inverters, it is applied a DC power supply unit to simulate PV arrays, light bulbs to simulate the users' loads and California Instruments AC power source to simulate the power grid. Thus, the schematic diagram of this experiment is figure below.
Results Analysis
It is mainly divided two parts of this experiment, which are steady state testing and transient state testing.
Steady-state
- Input and output waveform of inverter
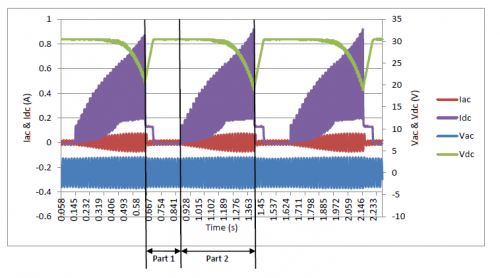
Set the DC power source (the input of YC500A mirco-inverter): Vdc=30V, Idc=4A. Also, set California Instruments power supply as 240V, 50Hz at AC. Get the waveforms about the input/output voltage and current of the inverter as below.
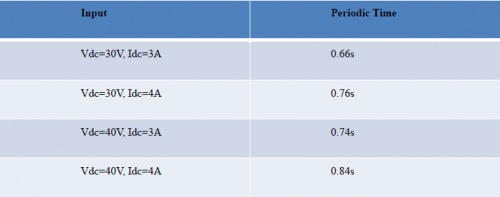
YC500A micro-inverter does the cycle operation. Every period lasts about 0.76s. There are two types of state when the inverter is working - stand by and export, which are part 1 and part 2 in the above figure respectively. When the input of the inverter is different, the periodic time is different. Their relationship is listed in the table below.
- Working range of inverter
Change voltage or frequency respectively to get the working range of the inverter.
Voltage: 192.8V - 263.8V
Frequency: 49.25Hz - 50.44Hz
After the YC500A mirco-inverter is interrupted or stopped, it needs 80s to let it working again.The reconnection time of this inverter is 80s.
- Power factor of inverter
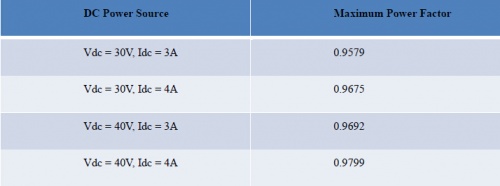
Change the voltage and current of DC power supply to test the inverter output power factor as a function of DC input. Get the table below.
- Total harmonic distortion
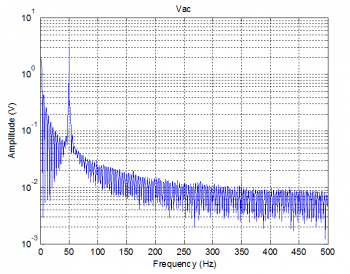
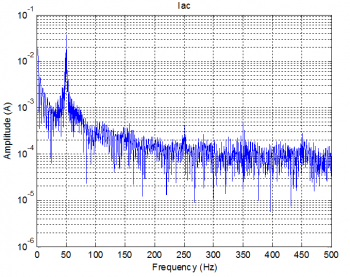
Total harmonic distortion (THD), is a measurement of the harmonic distortion present and is defined as the ratio of the sum of the voltage or current of all harmonic components to the voltage or current of the fundamental frequency, namely

Use Matlab to do FFT to get the amplitude-frequency response.
a. Voltage
From the figure , it cannot be seen the harmonic components. It meams the harmonic components of voltage can be ignored. Thus, THDu = 0.
b. Current
According to the formula, the total harmonic distortion of current; THDi = 0.2859%.
Transient state
- Inverter working range on the main supply disturbance
Use CSW to program the AC source which has a voltage or frequency disturbance during every testing. Programming CSW 5550 indicates to inverter that the voltage or frequency is zero during the interrupt time. Change the interrupt time to get the working range of YC500A micro-inverter under transient state.
- Delay time
a. Voltage disturbance
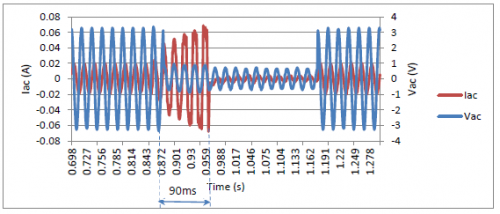
A disturbance voltage which is an unwanted voltage induced in the system by CSW lasts 300ms and the voltage drops to 50V, then the AC source returns to 240V, 50Hz.
From Figure 22 the voltage disturbance delay is roughly four and a half cycles. It means that the voltage disturbance delay is 4.5*0.02=0.09s, namely 90ms.
b. Frequency disturbance
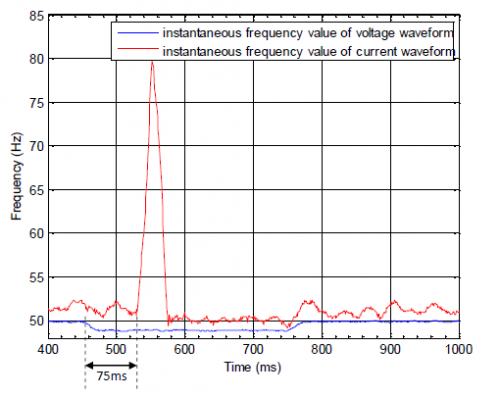
It is hard to see the voltage and current change due to the slight change of frequency. Thus, transfer to frequency domain to observe, making time-frequency response of voltage and current in figure 23.
The effect of frequency disturbance to the frequency of voltage and current can be clearly obtained from frequency domain analysis. The frequency disturbance delay is 75ms.
Conclusion
Outcomes
- Probability based models of power system uncertainties, which include power system demand, wind power generation andsolar PV generation.
- Probability based model of load flow
- Case study, which include stochastic characteristics analysis, contingency,thermal effect and EENS
- The periodic time of the inverter is increased following the more input power under stead-state. And the value of current is more significant than the voltage for impacting periodic time.
- The higher input power will lead to higher inverter power factor. Moreover, the value of input voltage is more important than current for impacting power factor of inverter.
- There is almost no harmonics in voltage waveform under steady-state, while it has harmonics in current waveform.
- The shorter interrupt time will lead to the wider voltage working range. And when the interrupt time is above 150ms, the working range of inverter will keep in 193V to 263V. When the interrupt time is between 300ms to 500ms, the frequency working range of inverter is shorter than other time intervals.
- When voltage or frequency disturbance from the main supply has happened, there is a time delay between voltage and current of the inverter output. And the current lags the voltage few millisecond.
Future work
There are many improvement and new features can be applied upon current work by future groups.
For modeling and probabilistic analysis,
- Applying power system analysis software such as PSS/E into the future project. Because current works focus on the power system data processing and analysis, so it is hard to implement power system dynamic and transient analysis without proper power system analysis software.
- Combining actual power system parameters such as components failure rate, installation numbers, efficiency and so on to improve the accuracy of both system models and the results obtained from case studies.
- Introducing updated technology such as energy storage into the future project.
For experiment and data analysis,
- Dependence on the DC side
Simulate the solar array to confirm the inverter’s capabilities to determine and operate at the maximum power point to illuminate current versus voltage (I-V) characteristics
- Load simulation
Simulate the variability of the load to confirm the inverter’s ability to handle load changes, transients, power factors and other characteristics.
- Develop PSS/e models to represent the measured inverter behaviour.
Team
Group members
Hang Yin
Kai Sun
Supervisor
Dr Rastko Zivanovic [1]
Sponsor
ElectraNet [2]
References
[1] B. Bak-Jensen, J. Bech, CG. Bjerregaard, PR. Jensen, “Models for Probabilistic Power Transmission System Reliability Calculation” IEEE Transactions on Power Systems, 1999, Vol.14(3), pp.1166-1171
[2] Y. Liao, M. Zhou, “Studies on Impact of Wind Power Using Power System Probabilistic Production Simulation” 2012 Asia-Pacific Power and Energy Engineering Conference, March 2012, pp.1-4
[3] A. Hadian, M.-R Haghifam, J. Zohrevand, E. Akhavan-Rezai, “Probabilistic Approach for Renewable DG Placement in Distribution Systems with Uncertain and Time Varying Loads” 2009 IEEE Power and Energy Society General Meeting, July 2009, pp. 1-8
[4] D.H. Nguyen, M. Negnevitsky, “ Probabilistic Risk-based Security Assessment for Power System with Power Generation” 2013 IEEE Power and Energy Society General Meeting, 2013, pp. 1-5
[5] T. Alquthami, H. Ravindra, M.O. Faruque, M. Steurer, T. Baldwin, “Study of Photovoltaic Integration Impact on System Stability Using Custom Model of PV Arrays Integrated with PSS/E” North American Power Symposium, Sept 2010, pp. 1-8
[6] T. Tran-Quoc, A. Luu-Ngoc, X. Le-Pivert, J. Merten, F. Barruel, “Probabilistic Analysis of Photovoltaic Generation Impacts on Distribution Networks” 27th European Photovoltaic Solar Energy Conference and Exhibition
[7] S. Conti, S. Raiti, “Probabilistic Load Flow Using Monte Carlo Techniques for Distribution Networks with Photovoltaic” Solar Enery, 2007, Vol.81(12), pp.1473-1481
[8] M. Lu, YD. Zhao, T. K. Saha, “A Probabilistic Load Flow Method Considering Transmission Network Contingency” 2007 IEEE Power Engineering Society General Meeting, June 2007, pp.1-6
[9] M. Mosadeghy, T. K. Saha, “Reliability Evaluation of Wind Farms Considering Different Reliability Assessment Levels” 2014 IEEE Power Engineering Society General Meeting, July 2014, pp.1-5
[10] J. Sveca, L. Soder, “Wind Power Integration in Power Systems with Bottleneck Problems” 2003 IEEE Bologna Power Tech Conference Proceedings, 2003, Vol.2, p.7 pp. Vol.2
[11] C. Guido, C. Pierluigi, V. Pietro, “Multi-linear Monte Carlo Simulation Method for Probabilistic Load Flow of Distribution Systems with Wind and Photovoltaic Generation Systems” Renewable Energy, April 2015, Vol.76, pp.283-295
[12] U. Julio, “Probabilistic Load Flow with Correlated Wind Power Injections” Electric Power Systems Research, 2010, Vol.80(5), pp.528-536
[13] C. Cristina, R. Esther, R. Jesus, “Probabilistic Load Flow with Versatile Non-Gaussian Power Injections” Electric Power Systems Research, February 2015, Vol.119, pp.266-277
[14] U. Julio, “Probabilistic Load Flow with Wind Production Uncertainty Using Cumulants and Cornish-Fisher Expansion” International Journal of Electrical Power and Energy Systems, 2009, Vol.31(9), pp.474-481
[15] L. Dong, W. Cheng, H. Bao, Y. Yang, “A Probabilistic Load Flow Method with Consideration of Random Branch Outages and Its Application” 2010 Asia-Pacific Power and Energy Engineering Conference, March 2010, pp.1-4
[16] G. Li, X. Zhang, “Comparison Between Two Probabilistic Load Flow Methods for Reliability Assessment” 2009 IEEE Power & Energy Society General Meeting, July 2009, pp.1-7
[17] L. Dond, C. Zhang, Y. Yang, P. Zhang, “Improvement of Probabilistic Load Flow to Consider Network Configuration Uncertainties” 2009 Asia-Pacific Power and Energy Engineering Conference, March 2009, pp.1-5
[18] A. Da Silva, W. Sales, L. Da Fonseca Manso, R. Billinton, “Long-Term Probabilistic Evaluation of Operating Reserve Requirements With Renewable Source” IEEE Transactions on Power Systems, Feb. 2010, Vol.25(1), pp.106-116
[19] X. Liu, S. Islam, “Reliability Evaluation of a Wind-Diesel Hybrid Power System with Battery Bank Using Discrete Wind Speed Frame Analysis” 2006 International Conference on Probabilistic Methods Applied to Power Systems, June 2006, pp.1-7
[20] G. Orfanos, P. Georgilakis, N. Hatziargyriou, “Transmission Expansion Planning of Systems with Increasing Wind Power Integration” IEEE Transactions on Power Systems, May 2013, Vol.28(2), pp.1355-1362
[21] M. Bardhi, G. Grandi, G.M. Tina, “Comparison of PV Cell Temperature Estimation by Different Thermal Power Exchange Calculation Methods” International Conference on Renewable Energy and Power Quality, Santiago de Compostela, Spain, March 28-30
[22] T. Govindasamy, L. Ji, Y. Tang, “Photovoltaic Module Thermal/wind Performance: long-term monitoring and model development for energy rating” NCPV and solar program review meeting 2003
[23] S. Armstrong, W.G. Hurley, “A Thermal Model for Photovoltaic Panels under Varying Atmospheric Conditions” Applied Thermal Engineering, 2010, Vol.30(11), pp. 1488-1495
[24] A.D. Jones, C.P. Underwood, “A Thermal Model for Photovoltaic Systems” Solar Energy, 2001, Vol.70(4), pp.349-359
[25] AMETEK, “California Instruments CSW Series”, AMETEK Programmable Power, 2010
[26] APS America, "APS YC500-A photovoltaic grid-connected inverter", installation/user manual, 2014,Version 4.1 1/15
[27] APT, "Total harmonic distortion and effects in electrical power systems", Associated Power Technologies, 2012
[28] J. Bauer, J. Lettl, "Solar power station output inverter control design", Radio Engineering, 2011, VOL. 20, NO. 1
[29] B. Burger, R. Ruther, "Inverter sizing of grid-connected photovoltaic systems in the light of local solar resource distribution characteristics and temperature", Science Direct, Solar Energy, 2006
[30] S. Chowdhury, G.A. Taylor, S.P. Chowdhury, A.K. Saha, Y.H. Song, "Modelling, simulation and performance analysis of a PV array in an embedded environment", UPEC, 2007
[31] R. Gottschalg, “Performance characterisation of photovoltaic modules”, Centre for Renewable Energy Systems Technology, Department of Electronic and Electrical Engineering, Loughborough University, 2010
[32] M. Holt, "Solar photovoltaic (PV) systems", NEC Requirements for Solar Photovoltaic System, 2011
[33] Power Analytics Corporation, “Photovoltaic Modeling”, Paladin DesignBase, 2011
[34] R.G.G. Raju, N.P. Subramaniam, “Operation and Modeling of photovoltaic power generators”, Recent Advances in Space Technology Services and Climate Change, Nov. 2010, pp.466-469
[35] E. Turner, “Testing for grid-tied solar system inverters”, Electronic Products, AMETEK Programmable Power, San Diego, CA, 2010
[36] R.J. Wai, W.H. Wang, "Grid-connected Photovoltaic generation system", IEEE Xplore, 2008, Volume 55, Issue 3
