Projects:2015s1-09 Development of a Deadman Switch for Tramline Traction Simulation Tool
Contents
Supervisors
Dr. Rastko Zivanovic
Co-Supervisor: Abul Hasnat (Public Transport Services)
Students
Ronghao Li
Xuran Yu
Disha G Nayak
Aim
The aim of the project is to incorporate safety features and expand the tram line further down port road.
Objectives
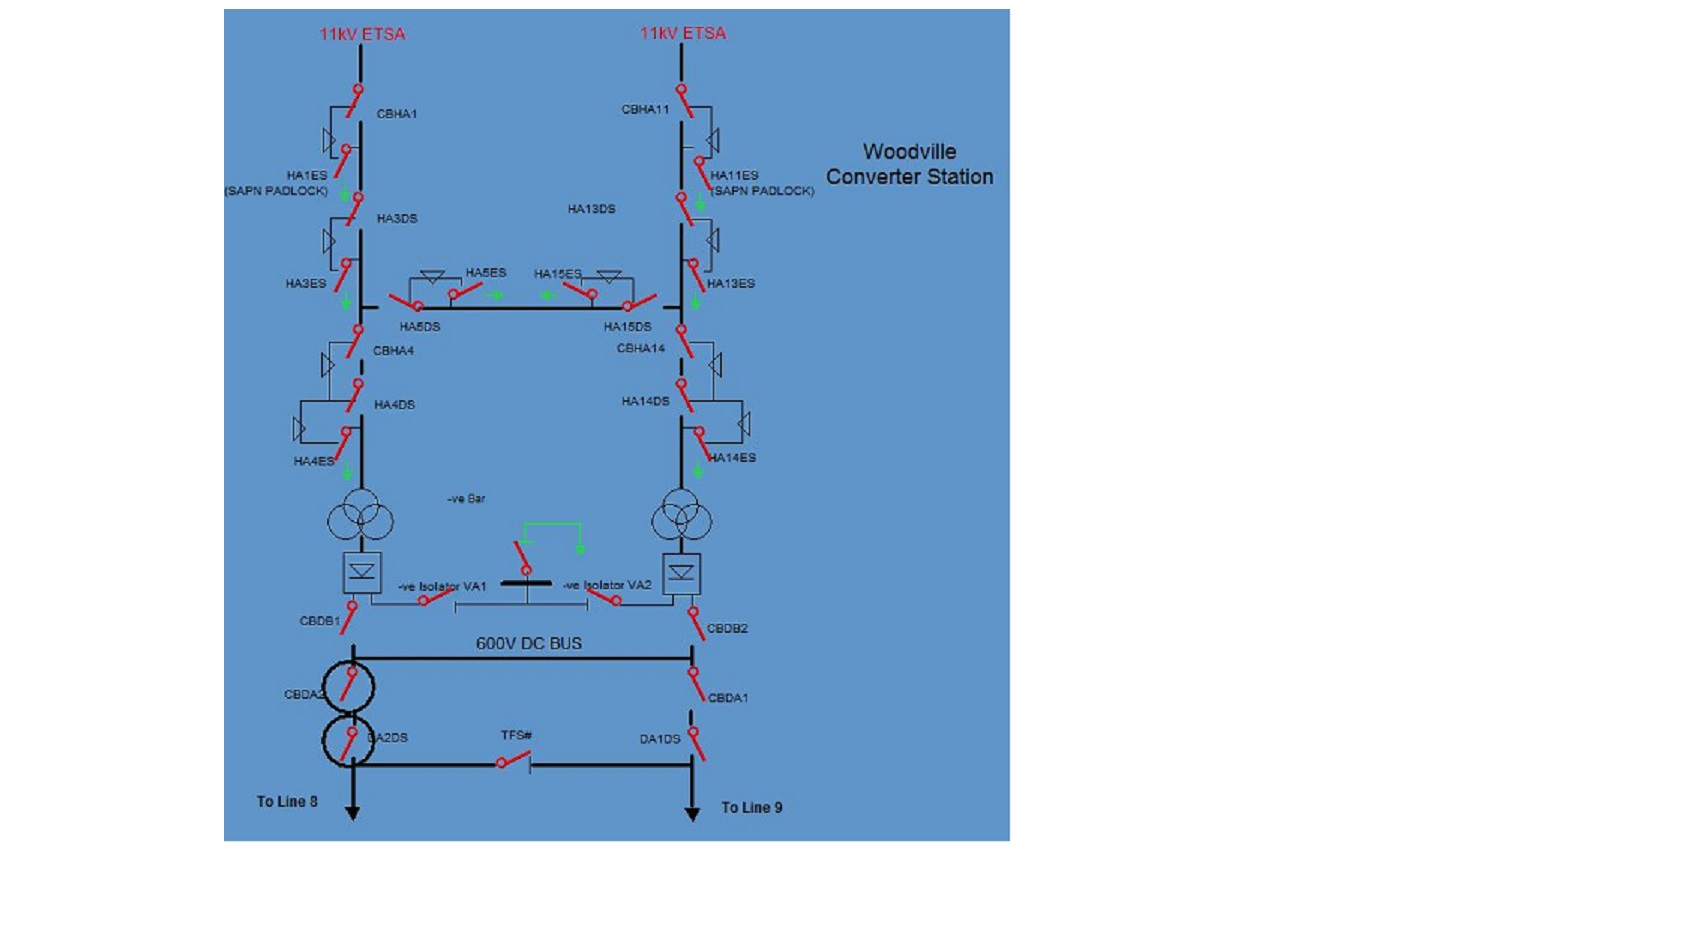
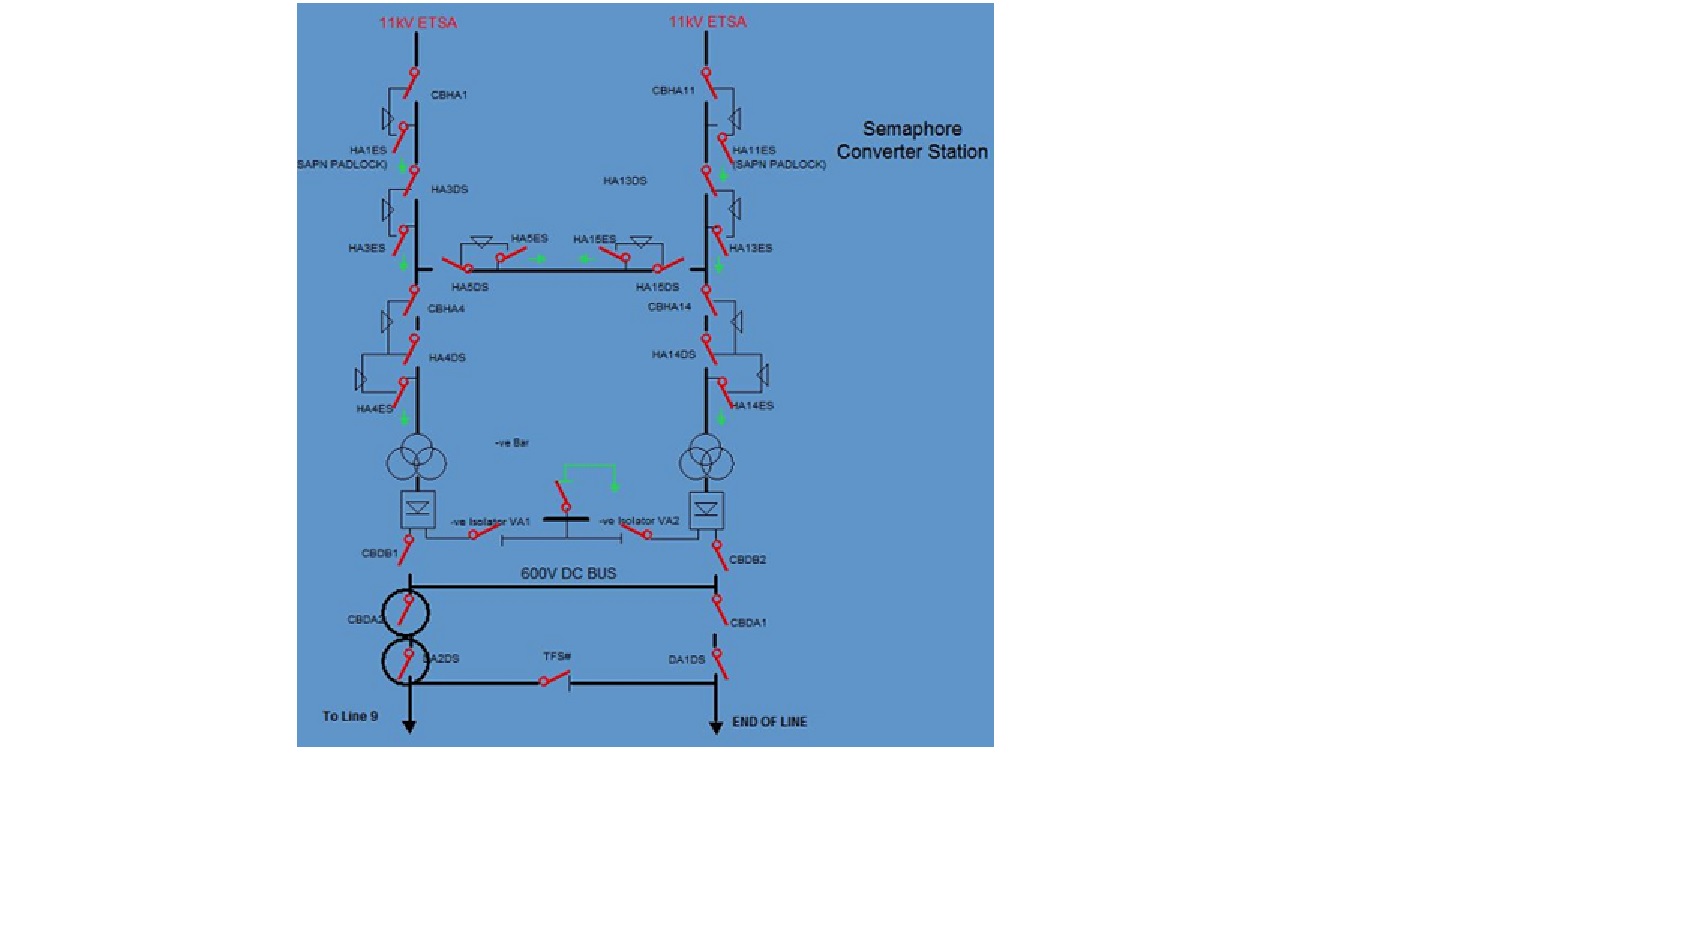
a) Addition of two new dual rectifier substations in the simulation tool namely at Woodville and Semaphore.
b) Development of a new function in the tool called the panic button also known as the dead mans’ switch. On activating this button the power to all the tram lines will be cut off thereby bringing the trams to a complete halt immediately.
c) Improvement in the automated program to incorporate the additional features and make the system more reliable and stable.
Software
The simulation tool is built on the CitectSCADA platform. It is free software available for download on the Schneider Electric company website.
Proposed Approach
The project is divided into 3 phases where each phase results in the completion of the previously mentioned objectives. The tasks to be undertaken in each of the phases are listed below:
1. Addition of two substations: Public Transport Services department has outlined the extension of the existing layout further down the port road in the form of additional substations. The two additional substations are namely: Woodville and Semaphore. In this phase, our aim is to represent these two additional substations on the current existing simulation tool.
1.1. Substation Study: Out of the 7 substations, 5 are single line rectifiers and the other 2 are dual line rectifiers. A detailed schematic study of each station is necessary as the additional substations should follow similar schematics. The circuit diagrams which include the details of all connecting switches will be studied thoroughly to incorporate the same in the additional substations.
1.1.2. Previous Project Study: Preceding our project, work has been carried out which has successfully developed the simulation tool from scratch. A user guide was developed which explains in detail the concept used in creation of code for the tool. This document will be revisited on the basis of need as we have to develop code in sync with the existing test cases.
1.2. Citect Scada: It is software package used for the development of the simulation tool. As mentioned earlier, the current simulation runs on this software which makes it important for us to be as familiar with its operation.
1.2.1. Cicode Tutorials: The programming language associated with Citect Scada is Cicode. The code for the addition of the two substations should be developed in the Cicode environment. Tutorials available on the Schneider Electric site and also others on the internet are being undertaken to understand the different ways to develop algorithms.
1.2.2. Develop functions and Debug: The completion of the above tasks will provide us the necessary knowledge to write algorithms for the additional substations. Considering both the additional substations are dual rectifiers we will be replicating an existing dual substations layout into our algorithm. The code will be written in Cicode but certain codes developed will be tested and debugged in Matlab as it is a much user friendly environment. We will be developing two source codes i.e. one for Woodville and one for Semaphore.
2. Addition of the panic button: This phase comprises of introducing a new functionality in the simulation tool called the panic button. In the event of an emergency, this functionality will help the trams disconnect from the power lines.
2.1. Literature review of Diakoptics and Sparse Matrix: In this section our focus will lie on the concept of Diakoptics. As we are dealing with a complex system, solving the system as a whole may result in errors. Therefore, the concept of Diakoptics of reducing the complex system into smaller systems in order to solve them and then combing the solutions is a better way of dealing with the problem.
2.1.2. Developing Algorithms in Cicode: The knowledge gained in tasks 1.2.1 and 1.2.2 will prove as a stepping stone to develop the algorithms for the panic button. The algorithm will consist of a source code which will check the status of switches between two connecting substations, if closed it will open it and display the result. It will follow the same steps for all the other substations in a predetermined order and open all the switches ensuring no trams are connected to the power lines. Each substation will divided into smaller sections and the status of the switches in these sections will be stored in a matrix which are solved to arrive at a solution.
2.1.3. Test and Debug: As the algorithm is being developed each piece of code will be tested for errors. Once debugged it will be combined with the previous code and tested as a whole.
3. Improvement of the switching programs: The last phase of the project will focus on what happens after the panic button has been activated.
3.1. Creating isolation procedure: The isolation procedures is an information sheet which tells the end user the switches that need to be opened for all the trams to be cut off from power. It is a step by step procedure guide to open the switches in the correct order to safeguard all the equipment in the power system.
3.1.2 Creating the restoration procedure: It is the reverse process of the isolation procedure which tells the end user the correct procedure to allow the trams to be connected back to power without any physical damage to any equipment or human being.
Applied Concepts
Diakoptics
Diakoptics is a piece wise solution of electrical networks. Traditionally, electrical networks can be solved if some known parameters are mentioned. From the known parameters, mesh or nodal equations are developed and calculated. These equations can be translated to matrices but large electrical networks constitute of large matrices and this approach can be cumbersome. In Diakoptics, it suggests breaking down the complex system to smaller segments and solving for answers which are then combined together and solved as a whole. It tells us that nodes of a sectioned system can be aggregated by dynamic programming. This method involves solving of matrices while making few assumptions which allow simple physical interpretation of complex networks.
Algorithm based on Diakoptics
This algorithm is consumed in load flow study of transmission network. In transmission network, Y bus matrix is represent of the admittance of each part of system. Thus, with some of voltage and real and reactive power of the system, we can calculate all the voltage of each node.
In this algorithm, similar conception is taken into consideration, which use node voltage states to establish switch states. Each switching system consists of two kinds of matrix – connection matrix and state matrix. All the two matrix work on a binary principal and only have two kinds of elements zero and one. Connection matrix is a symmetrical matrix with non-zero diagonal elements which represent the state of all switches in system. Zero in connection matrix means two part are not physically connected which means either the switch or the circuit breaker between the two parts are open. While, one means switch close.
State matrix (initial matrix) is a binary vector which shows the active state of each lines. Length of the vector is equal to the dimension of connection vector.
An internal matrix called solution matrix could be got by multiply connection matrix with initial matrix. This procedure should be least for large numbers of iteration and the state matrix could be got until the solution matrix be steady state.
Operators operate the switch states to change the connection matrix of the changing part. The new connection matrix will multiply with the last initial matrix and after several iteration, the whole system will reach the steady state.
Goals Achieved
1. Addition of 2 substations
The two substations namely at Woodville and Semaphore were added in to the simulation tool. The figures are shown below.
2. Panic Button Implementation
A new feature called the panic button is integrated into the simulation tool. This button upon activation opens the circuit breakers in the substation which cuts of all power to the lines and therby bringing the trams to a complete halt.
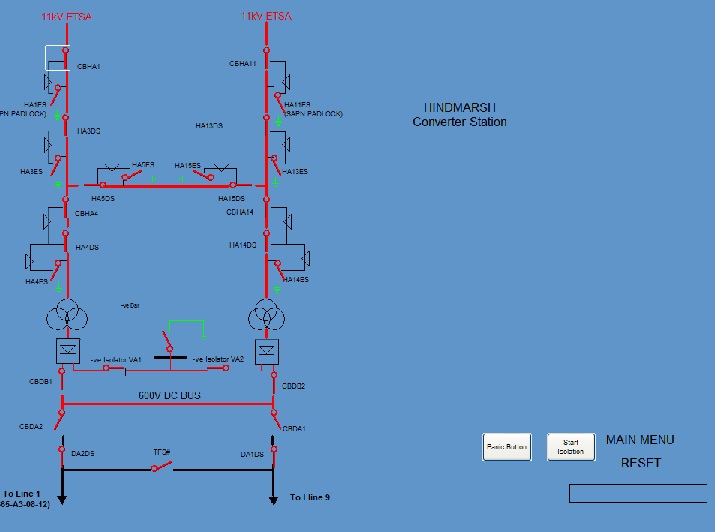
Its feature is explained as follows When you click the panic button, in Figure 1, the two main circuit breakers in Hindmarsh Substation will open. The red lines means power flow goes through the circuit, while black lines shows no power flow exists in the circuit. Therefore, the circuit at the bottom section become black, which means the power supply cannot reach to this section because of the opened circuit breaker CBDA1 and CBDA2, the switch value of these two circuit breakers is 0. Other 8 substations have the same results. At the bottom of Figure 1, the substation is linked to Line 9 and Line 1.
3. Map Of Adelaide Tram line
A map is be designed to exhibit the original seven existing substation from Hindmarsh to Glenelg. It aims to show the whole structure of tramlines system and each section in the map can link to the detailed graphs and diagrams. In the Figure shown below, both the substations and lines can be chose to check each portion of the system. To set a convenient way for controllers to check, they can either click the word of lines or the real black lines to open a new window and see the diagrams.
References
1. Higginson, E. 2012, “Tramline Traction System Simulation Tool Final Report”, The University of Adelaide. 2. Lloyd, R. & Mustillo, A. 2013, “Adelaide Tramline Simulation Reference Guide”, The University of Adelaide. 3. Ma, H. 2012, “Adelaide Tramline Traction System Simulation Tool”, The University of Adelaide. 4. Mustillo, A. 2013, “Tramline Isolation Simulation System Semester Progress Report”, The University of Adelaide.


