Projects:2015s1-25 Indoor localisation using Bluetooth LE for event advertising
The desire and need for indoor localisation is becoming more widespread in society. In particular, exhibition event-goers are often faced with the problem of wasting time looking for items of interest to them and may find themselves missing out on the exhibits that are more suited to their taste. This Honours Project proposes a solution to this problem. It aims to provide useful advertisement about nearby exhibits to users based on their location. It concerns the development of an indoor positioning system based on Bluetooth Low Energy (Bluetooth LE) technology and concerns its integration into an application designed for iOS. This project aims to further prove the viability of the use of Bluetooth LE as an indoor positioning technology that has the potential to become widespread in society and to enhance the experience of event-goers.
Contents
- 1 Acronyms
- 2 Project Information
- 3 Background and Literature Review
- 4 Project Development
- 5 Results and Evaluation
- 6 Conclusions and Future Work
- 7 Project Team
- 8 References
- 9 Booth List (for internal use only)
Acronyms
AP: Access Point
AR: Advertising Rate
BER: Bit Error Rate
ECMS: Faculty of Engineering, Computer and Mathematical Sciences
EEE: Electrical and Electronic Engineering
GPS: Global Positioning System
IPS: Indoor Positioning System
k-NN: k-Nearest Neighbors
LE: Low Energy
LQ: Link Quality
PDU: Protocol Data Unit
RSSI: Received Signal Strength Indicator
TPL: Transmitted Power Level
Tx: Transmitter
UofA: The University of Adelaide
Project Information
Introduction
The ability to determine location within an indoor setting is an area of growing interest to many businesses [1]. Bluetooth Low Energy (LE) is a modern communication technology that was primarily targeted at the smart home, health, sport and fitness industries [1] but has been discovered to have high potential to be used in indoor positioning systems (IPS). Its promise of low energy consumption and features such as low cost and wide availability are just some of the benefits that Bluetooth LE can provide to positioning systems.
Objectives
The purpose of this project was to develop an indoor positioning system based on Bluetooth Low Energy technology that could be integrated into an application designed for handheld iOS devices. This application is to be used for advertising at public events with the intention of being able to provide an interactive display of a user’s location with the ability to identify and display information about potential objects of interest within a user’s vicinity. Although this project’s main focus for application development was targeted at handheld iOS devices, the project was undertaken with the possibility of future expansion into Android devices in mind.
The development of the IPS initially concerned the study of technologies used in indoor positioning systems and the available commercial products which enabled a selection of components for the final IPS to be made. It concerned the study of positioning algorithms that have been used in IPS and a selection of algorithms to be further explored that appeared to have the most potential for use for the purposes of the project. Once a decision was made on the components of the IPS, tests and experiments were carried out in order to become familiar with the capabilities and limitations of the system and to determine how applicable the chosen methods were in the context of the final system.
This system is initially intended to be deployed at the Adelaide Convention Centre for the University of Adelaide’s (UofA’s) event ‘Ingenuity 2015’ (see Appendix A). It is to be targeted towards final year students and teaching staff at the UofA in the School of Electrical and Electronic Engineering (EEE) and the general public who will be attending Ingenuity 2015. The system is to be available via an application designed for handheld iOS devices that has the capability of providing information about the closest three or four project exhibition booths based on a users location within the vicinity. The system is expected to be adaptable such that it can be expanded into other locations with similar applications.
Motivation
The desire for targeted location based advertising is becoming more widespread [2]. As such there is an increasing demand for indoor positioning systems [2]. Be it a desire to locate a specific display within a museum or gallery, a need to locate a seat inside a large arena or simply a wish to learn more about objects in ones surroundings, indoor positing systems are highly sought after. Global positioning system (GPS) has proved to be highly reliable and accurate when used in the context of outdoor localisation [3]. It is no surprise it has become a de facto standard for outdoor localisation [4]. However, when used for indoor localisation, the detection and decoding of GPS signals have become a difficult task due to the additional signal attenuation caused by physical obstacles such as the walls of buildings [3]. Due to the limitation of GPS in an indoor setting, there have been many technologies proposed and discussed in literature that pose as alternatives for indoor localisation. These technologies and work pertaining to them are discussed below. Despite much research into alternatives to GPS, none of these technologies have made a substantial impact in the field such that one could be claimed as a de facto standard for indoor localisation as GPS can be claimed for outdoor. Bluetooth Low Energy has been recognised as one such technology with high potential to perform indoor localisation [4] and as such will be the focus of this project.
The outcomes of this project are intended to assist in the further justification and feasibility of the use of Bluetooth LE technology in the context of indoor localisation. It will also be concerned with enhancing the advertisement and experience of those attending exhibition type events, in particular Ingenuity 2015. Anyone interested in the further feasibility of Bluetooth Low Energy as a technology for indoor localisation and attending Ingenuity 2015 will stand to benefit from this project.
Significance
Upon completion, this project aims to further justify the use of Bluetooth LE as a feasible technology for use in indoor positioning applications. More specifically, it aims to provide evidence of the applicability of Bluetooth LE based transmitters for indoor location detection in an exhibition type setting where there is high signal fluctuation due to interference and noise. In broader terms, the successful completion of this project will enable event-goers (in particular, those attending Ingenuity 2015) to have a more positive experience through the ease of booth location and discovery with the potential to expand into broader applications. The exhibitors will also stand to benefit from the completed system as their information will be more readily available and disseminated quicker to those in attendance.
Requirements and Specifications
The Indoor Positioning System to be developed was required to satisfy the following requirements and specifications:
- Be able to determine, with the highest possible accuracy, the location of a user within an indoor setting,
- Use components based on Bluetooth Low Energy technology,
- Use components that are small and easily deployed,
- Use positioning algorithms that are simple and can be easily integrated into an application developed for iOS (and possibly Android in the future),
- Require minimal calibration and setup at the deployment location,
- Use the least amount of transmitters possible.
- Able to provide location based information that can be used for advertisement,
- Use technology developed for iOS (and Android, where possible).
Background and Literature Review
Indoor localisation is the determination of location within an indoor environment. In order to perform indoor localisation, indoor positioning systems (IPS) have been developed. Indoor Positioning Systems rely on the use of measured parameters that reflect the location of a target object (a receiver) relative to single or several fixed points with known locations (transmitters). As such, the key components of an IPS include: a means of transmitting location information (transmitters), a means of receiving location information (receivers), a communication protocol common to both the transmitters and receivers (communication) and a way of inferring location from these parameters (positioning algorithms).
This section begins with the background and literature review of the communication technologies that have been proposed for use in indoor positioning systems with a discussion of why the Global Positioning System (GPS) is not suitable for indoor positioning applications. It provides justifications into why Bluetooth Low Energy (LE) was chosen as the underlying communication protocol of the IPS developed in this project as opposed to alternate technologies. Then a discussion of possible positioning algorithms found in literature that have the potential to be used within the final IPS is presented. The way in which these positioning algorithms use the received signal strength indicator (RSSI) parameter (the chosen parameter will also be discussed.
Indoor Positioning System Technologies
Although many technologies have been proposed for use in indoor positioning systems, there has not been enough evidence to declare a single technology as a standard for indoor localisation, similar to GPS that has become the standard for outdoor localisation. The use of GPS in the context of indoor localisation has many limitations. Consequently, alternative communication technologies have been proposed and discussed in literature. Some of the proposed alternatives include: Wi-Fi, ZigBee, Ultra wideband radio, Traditional Bluetooth and Bluetooth Low Energy [5]. However, the technologies that have caught the most attention in the field of indoor positioning are Bluetooth and Wi-Fi and as such background information and literature pertaining to these will be primarily discussed along with a discussion of GPS. For the purposes of this project Bluetooth LE has been determined as the most suitable communication protocol for use in the developed IPS.
Global Positioning System
GPS is a well known and popular worldwide radio navigation system that has proven to be very effective for determining position within an outdoor environment [6]. It uses satellites to transmit communication information, such as the time taken for a signal to be sent and received, in order to assist in the determination of a user’s location; a user being someone holding a GPS compatible device such as a smart phone. However, when applied in an indoor context, signals from GPS satellites are too weak to penetrate through large obstacles/materials (such as buildings) making it useless for indoor localisation [6]. Due to its limitations within an indoor setting, GPS was not able to be considered for indoor localisation within this project. However, GPS relies on the use of the positioning algorithm, Trilateration which is a viable option to be used within this project.
In literature an interesting study on the use of GPS for indoor localisation was found in [3]. In [3] an indoor positioning system, based on GPS repeaters and modified positioning algorithms, was proposed. The results indicated that an Indoor Positioning System (IPS) based on GPS technologies can produce positioning accuracy comparable to that of outdoors GPS positioning with the restraint of a need for additional infrastructure in addition to buildings. Although this additional infrastructure was found to be cost effective and simple, it was not a feasible solution for this project in which small and easily deployable transmitters was a requirement of the system.
Wi-Fi
Wi-Fi communication is based on the transmission of radio waves (at frequencies of 2.4 GHz or 5 GHz) [7]. Although Wi-Fi has been identified as a very strong candidate for indoor positioning systems [8] it is only capable of conveying location information [9]. Bluetooth Low Energy conversely is not only able to provide location but it is also able to provide location based information (a small amount of information about a location) which can be used for advertisement. As the purpose of this project was to provide information on the detected objects within a user’s vicinity, Wi-Fi fails to meet the requirements of the project and was unusable within the IPS for this project.
A study on the effects of indoor localisation techniques in a Wi-Fi access point (AP) intense environment was presented in [10]. Although the technology and algorithms applied in this study were based on Wi-Fi, the results can be useful in this project. In particular, the algorithms explored throughout this paper may prove useful when applied in a Bluetooth LE context. This paper alludes to some factors that may need to be considered throughout this project that have the potential to affect the accuracy of localisation. These include: the effect of a large amount of APs (or transmitters), time tolerance i.e. signal strength decreasing over time, APs disappearing and appearing, different mobile device specifications and orientation of devices.
Bluetooth
Bluetooth is a technology that has received much attention in the field of indoor positioning. It has been chosen as the most suitable communication technology for this project as it is the only communication protocol discovered that was capable of providing location based information (a small amount of information that describes a location that can be used for advertising). It is designed to enable short range wireless communication between devices [4] using radio signals in the 2.4 GHz range. It has been designed to support low power wireless communication and hence, power control is one of the desirable features associated with it [4]. The power control feature allows a transmitter to adjust its strength based on the Received Signal Strength Indicator (RSSI) from another device. RSSI, which is a signal parameter of particular interest within this project, is among other Bluetooth measures that can be used as input data into positioning algorithms. Other measures that have been looked into are Link Quality (LQ) which can be picked up by a Bluetooth receiver and the transmitted power level (TPL) which is transmitted. One major advantage attributed to the use of Bluetooth technology is that it has high penetration in society meaning that Bluetooth capable devices are easily obtainable and the required hardware is mass produced such that Bluetooth technology has a very low unit cost [4] [11].
In 2010, Bluetooth Low Energy (Bluetooth LE) was introduced along with the specification for Bluetooth 4.0 technology [11].
Signal Strength Parameters
Received Signal Strength Indicator
The RSSI parameter is a signed 8-bit integer value that provides an indication of the signal strength experienced by the receiver of a Bluetooth Protocol Data Unit (PDU) [4]. For Bluetooth Low Energy capable devices the RSSI range is typically between -127 to 20dBm, where a larger value indicates a stronger signal.
Link Quality (LQ)
The LQ parameter is an unsigned 8-bit integer value which is most commonly related to the average bit error rate (BER) [4]. Hence, the LQ parameter spans the integer range 0 to 255, where a higher number indicates a better link.
Transmitted Power Level (TPL)
The TPL is represented by a signed 8-bit integer [4]. TPL is measured in dBm and as such will have a maximum value of +20dBm. The minimum value is device specific. The idea behind TPL is that Bluetooth chips with Transmitter (Tx) power between +4 dB and +30 dB are required to perform power control, where Bluetooth chips with high output power scale down the Tx effect to save power when the link is good [4].
Bluetooth Low Energy
Bluetooth Low Energy, as the name implies, was primarily designed to feature lower power consumption than classic Bluetooth technology whilst maintaining a similar communication range. This attribute was ideal for this project as amongst other trade-offs, power consumption and battery life of a Bluetooth LE enabled device have a direct correlation (with a high power consumption decreasing battery life). It is claimed that the low power consumption of Bluetooth LE capable devices means they can potentially last for years powered by a single coin cell battery [4]. This is an ideal condition to meet the requirements of the project as small and easily deployed transmitters that require minimal setup are needed within the system.
Technologies based on Bluetooth LE technology have been used to provide a means for Bluetooth LE enabled devices to communicate through “Advertisements.” These “Advertisements” are small packets of data that are broadcasted at regular intervals by transmitters [12]. Bluetooth LE uses three dedicated advertisement channels: 37, 38, and 39, which have been specifically allocated in the frequency spectrum such to minimise interference with the most common Wi-Fi channels 1, 6 and 11 [12]. The use of these three dedicated advertisement channels provides a speed advantage over tradition Bluetooth as the time it takes to locate all transmitters within a vicinity is dependent on the interval in which the transmitters are programmed to perform advertisement. This is another advantage of Bluetooth LE over traditional Bluetooth. Moreover, traditional Bluetooth is more appropriate for systems that require large data transfers whereas Bluetooth LE is more suited for applications that require small amounts of data [13] which is the case of this project.
There are several trade-offs that need to be considered when choosing technologies based on Bluetooth LE to be used as transmitters within the final system. The first trade-off is between advertisement time and device discovery. Bluetooth LE devices may advertise as little as once every 10 seconds or as fast as once every 20 milliseconds. This advertisement interval has a direct correlation to the time it takes to discover a device [4]. The transmit range of Bluetooth LE based transmitters has a direct correlation with the Transmission power level (TPL). At the highest transmission rate, the largest possible signal coverage can be obtained. However, this comes at the cost of battery life. This is another trade-off that must be taken into account when using Bluetooth LE based transmitters for indoor localisation.
After the introduction of Bluetooth LE, Bluetooth LE enabled devices were no longer made to be capable of receiving the LQ parameter, hence, removing the possibility of using this parameter within this project. Transmitter technologies based on Bluetooth LE typically have a fixed transmission power level (TPL) implying that the use of the TPL parameter is also no longer a viable option. Fortunately, the RSSI parameter is still easily accessible in Bluetooth LE enabled devices via simply receiving a broadcasted message. It is claimed to be the parameter within Bluetooth that has received the most attention and consensus to be the best suited for positioning applications despite its flaw in not being optimal [4]. Based on this, the RSSI parameter (in which Bluetooth LE capable devices can receive and can be used in positioning algorithms to infer location) will be the primary focus during the development of the IPS in this project.
Positioning Algorithms
The core of any localisation method relies on the real-time measurement of one to several parameters, such as angles, distances, or distance differences [14]. These measurement parameters reflect the relative location of a target object (an iOS device) to a single or several fixed points (transmitters) with known locations. The measurement parameter of interest to be used within positioning algorithms within this project is the Received Signal Strength Indicator (RSSI). In order to infer position, several types of algorithms have been proposed throughout literature. In a study on the best types of algorithms suited for indoor positioning based on Bluetooth LE technology and the RSSI parameter [4]., it was concluded that the most suited types of algorithms for this project are: Trilateration, Particle Filters and Fingerprinting.
Trilateration
In the context of location estimation, Trilateration is one of the oldest and most well renown methods [4]. Trilateration algorithms require three or more reference points in order to accurately determine distance. These three or more reference points are used to form the centres of three or more circles where the distances are considered to be the radii of these circles. In order to determine the relative or absolute position, simple geometric equations are used to calculate the intersection point between these circles. In the context of indoor localisation based on Bluetooth LE, the three or more reference points are known reference positions determined by fixed transmitter nodes and the distances can be obtained from received signal strength parameters. In the context of this project, the RSSI parameter values can be used.
Particle Filters
Particle filter algorithms involve the random and continuous generation of thousands of particles during runtime [4]. In the context of indoor positioning estimation these particles are the distance/difference to each of the reference transmitters or data/values that can be obtained. A filtering method is applied to this data where the particles that are unlikely to represent the current position are filtered out of the data set while particles that are more likely to be true representations of the position are retained for calculating the estimation.
The Kalman Filter is a type of Particle Filter that may be considered within this project if time permits.
Kalman Filter
The Kalman Filter [15] takes a large number of consecutive measurements to create the optional estimation of the state. It relies on two phases that occur repeatedly. These are a prediction and correction phase. The first phase is a calculation of a predicted state in the next moment and the second phase is where this prediction is corrected using a measured value. It is suspected that this process of prediction and correction can be used to filter out RSSI values that may have been affected by a large signal fluctuation.
Fingerprinting
In fingerprinting, attributes are assigned to a segment or grid cell. In the context of Indoor positioning estimation, RSSI or other received signal strength parameters are used as unique attributes. Fingerprinting involves the division of a map into segments or grids. In terms of RSSI, these segments consist of an average of RSSI values per transmitter node [4]. The fingerprint is thus made up of several RSSI averages and the position on the map segment or the grid cell that the fingerprint belongs to. Ultimately, a fingerprint database is constructed.
The k-Nearest Neighbours (k-NN) is a type of algorithm based on Fingerprinting that was considered within this project.
K-Nearest Neighbours (k-NN)
The output of a k-Nearest Neighbours (k-NN) algorithm is based on a comparison between an input vector and the training set (or fingerprint database) using a distance measure such as Euclidean distance [2]. It selects k-instances of the data set that are most similar to the input (those that have the shortest distance to the input) and those instances determine the class (or location) of the output. The class that has the majority of votes among the k-nearest neighbours of the input is selected as the output. For the purposes of this project k-NN can be applied by setting up a database of advertisement packet data within a location. The advertisement packet data received by a user at any point within this location can then be compared with the k-nearest neighbouring database reference points (which will be associated with an object (or booth) ) and the object/booth with the most matching points will be determined as the closest location to the user.
The Trilateration positioning algorithm and the k-NN positioning algorithm were chosen as the main two positioning algorithms to be explored within this project.
Project Development
The development of this project was defined into two key components that were primarily undertaken separately (each team member was assigned a component) but simultaneously (each team member worked on their component at the same time) with room for overlap and integration of components. These sections were titled Algorithmic Development and Application Development. The Algorithmic Development component of the project was primarily concerned with: the setup and deployment of beacons (transmitters) and the determination of the algorithmic approaches and the application of these positioning algorithms that will be used in the final indoor positioning system.
Whereas, the Application Development component was concerned with: the development of an application for handheld iOS devices that utilised these algorithmic approaches determined in the Algorithmic Development component, Graphical User Interface (GUI) design, and the testing procedures involved. The project was split in this way such to minimise risk, in that there is a clear cut distinction between components and in the event of failure to meet the demands of one aspect of the project the other aspect will still be semi-functional. However, the overall system will rely on the success of both aspects of the project.
Algorithmic Development
The Algorithmic Development component consisted of five main stages. The first stage was concerned with the selection of components to be used in the final indoor positioning system. This selection was based on a few requirements (discussed below) and the background information found above. The second stage involved researching how the chosen technologies could advertise location based information. The third component was a look into the positioning algorithms to be used and their justification. The fourth stage was a look into causes of path loss and the fifth stage involved experimentation and testing of the chosen algorithm and components.
Component Selection
The following requirements must be satisfied when selecting the technology to be used for the transmitters and receivers of this IPS:
- Based on Bluetooth Low Energy technology,
- Small and easily deployed,
- Require minimal calibration and setup at the deployment location,
- Able to provide location based information that can be used for advertisement,
- Developed for iOS (and Android, where possible).
The most important requirement was the need to provide location based information that can be used for advertisement. However, a limited amount of commercial technologies that use Bluetooth LE communication exist that can fulfill this need. The commercial technologies: iBeacon, Estimote and PayPal Beacon have been explored below.
iBeacon
iBeacon is Apple’s Trademark for location and proximity detection technology [1]. iBeacon technology relies on Bluetooth LE as its underlying communication protocol [12]. This satisfies the requirement of 1 above. Mobile devices are able to detect when an iBeacon is nearby and so, Mobile Apps can listen for iBeacon signals in the physical world and react accordingly [16] (by pushing notifications such as advertisements). This satisfies requirement 4 above. iBeacon was originally designed for iOS, however, SDK for Android has been released such that iBeacon technology can be used in Android. This satisfies requirement 5 above and is a very desirable aspect as this project would like to be expandable into Android in the future. A key feature of iBeacon technology is that the application can run in the background and only show up when another iBeacon is detected [1]. iBeacon transmitters have been designed to be small and easily deployed which also fulfils requirement 2 above.
estimote
Estimote Beacons broadcast tiny radio signals based on Bluetooth LE [1] [9] (requirement 1 above). Estimote is based on iBeacon technology [1] and the Estimote SDK allows apps on smart phones (iOS and Android) to understand their proximity to nearby objects and locations, recognising location based information (requirements 4 and 5). However, unlike iBeacon, Estimote is not completely commercialised as they are still in a development phase [1]. Due to this, this technology was looked upon less favourably in the final decision process.
PayPal Beacon
PayPal Beacon uses Bluetooth LE as its underlying communication technology [17] (requirement 1). It requires a connection to a Smartphone in order to be authenticated by a remote PayPal server [1] . However, PayPal fails to meet the requirement of requiring minimal calibration and setup at the deployment location (requirement 3) as the transmitter also requires Wi-Fi technology [1] . Furthermore, PayPal Beacons are more focused on making purchases (in sales) without the need for cards, cash or signatures instead of for determining location [1] . Consequently, this techno logy was deemed as not being suitable for this project.
Based on these findings iBeacon technology was the Commercial product that stood out the most and met all the requirements of the system. The next step in the algorithmic development phase that needed to be done was the investigation of how iBeacon advertisement packets transmit location based information. The findings in relation to this are summarised below.
iBeacon Advertisement
An iBeacon advertisement provides location based information via Bluetooth LE in the form of advertisement packets [18]. Apple has standardized the format of Bluetooth Low Energy Advertising [19] such that iBeacon advertisement packets contain the following pieces of information:
- Proximity UUID (16 byte): a unique identifier used to distinguish a set of iBeacon transmitters from another. For example if set of iBeacon transmitters were used to present special offers to customers in a chain of stores, iBeacon transmitters with the same proximity UUID would be associated with the same chain and as such an application for an iOS device (for example) for a specific chain will be configured to search for iBeacon transmitters with that associated UUID.
- Major (2 byte): a decimal number used to group a set of related iBeacon transmitters. For example all iBeacon transmitters inside the same location will have the same Major number which will help distinguish one location from another.
- Minor (2 bytes): a decimal number used to distinguish individual iBeacon transmitters within a group of iBeacon transmitters.For example each iBeacon transmitter within a particular location will have a different Minor number in order to help distinguish which part of that location the user is in.
- Transmission Power (Tx) (2 bytes): a representation of the strength of the signal measured at one metre from the device.
The last stage of the component selection was the identification of devices that are based on iBeacon technology and are to be used within the system. The choice of the iBeacon transmitter to be used was really only based on factors such as cost, availability, size and battery life. Radius Networks’ RadBeacon Tag was identified as a suitable device to be used as the iBeacon transmitters within this project.
Radius Networks' RadBeacon Tag
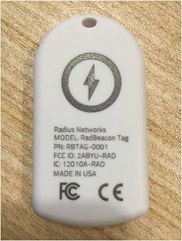
Radius Networks’ RadBeacon Tag (see image below), as stated in the specifications [20], is a standalone Bluetooth Low Energy (Bluetooth LE) proximity beacon that uses iBeacon technology. iBeacon technology has already been successfully applied in society for both indoor seat location/directing in large arenas and for advertisement purposes within shops [19][21]. RadBeacon Tags are powered by a replaceable coin-cell battery and can be adjusted to provide signal ranges from 5m to 50m. Using the configurable transmit power range of +4dBm to -20dBm and a configurable Advertisement Rate (AR) of 1Hz to 10Hz. The battery life of the RadBeacon Tags has a direct relation to the AR and Transmit Power with a higher AR or Transmit Power draining the battery at a faster rate. A RadBeacon Tag battery will typically last 30 days on a High AR (100ms), 145 days on a medium AR (500ms) and 285 days on a Low AR.
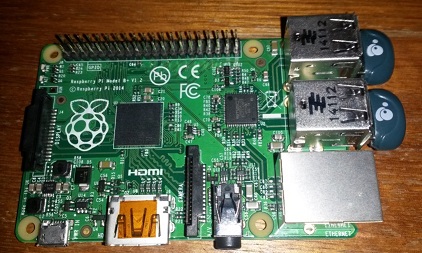
Evidently, the iBeacon receivers to be used in this project are handheld devices that run on iOS and use Bluetooth 4.0. However, before this IPS can be integrated into an application, designed for iOS, the system must be tested. Radius Networks’ PiBeacon was the chosen technology to be used in place of a handheld iOS device for system testing purposes. PiBeacon was chosen as it is capable of detecting and receiving advertisement packets from the RadBeacon Tags discussed above and it can store this information along with the received signal strength indicator (that is a receiver measurement) into a data file to be analysed (See image below).
Radius Networks' PiBeacon
Radius Networks’ PiBeacon [21] (see image below) is a Raspberry Pi based proximity beacon tool that is designed to work with multiple Bluetooth Low Energy proximity transmitter specifications. In particular PiBeacon is able to work with iBeacon technology. PiBeacons have the ability to transmit as a beacon or to scan for nearby beacons. As such PiBeacon has been identified as a useful substitute for an iOS device in the testing of the indoor positioning system.
The next part of the algorithmic development was to look into how the identified positioning algorithms could be used within the system based on the identified measurement (RSSI).
Positioning Algorithm Discussion and Justifications
As mentioned previously the Trilateration and k-Nearest Neigbours (k-NN) were the positioning algorithms that have been identified as having the most potential to determine location for this IPS.
Trilateration
Trilateration was chosen as it is one of the best known and simplest positioning algorithms in use. It forms the basis of GPS positioning and relies on simple geometric equations. It requires minimal setup/calibration which is essential to this project as minimal deployment and setup is a necessity.
Furthermore, an objective of this project is to achieve the best accuracy with a minimal amount of transmitters. Trilateration as it only requires at least three transmitters to be in range at any time, and amongst other favourable properties, is ideal for assisting in achieving this.
In this project the determination of location was decided, for simplicity, to only be two dimensional (x and y). This was a reasonable limitation as humans tend to hold their handheld devices at similar heights meaning not much change in this component can occur between users. Hence, this third dimension (z) of height could be ignored. In the future development of this project (as discussed in Section 5.2 a three dimensional system may be considered for future work.
Trilateration in its most basic form relies on three transmitters with known x and y locations and one receiver which is usually in the possession of a user with an unknown location. The idea is that RSSI can be used to determine the distance between the receiver and the transmitters. The means of determining this distance is discussed in Section 3.4 below. Once the distance between all the transmitters and receiver has been found the equation of a circle in two dimensions can be used:
where n = 1, 2 or 3 (representing the first, second and third transmitters details), and d represents distance in metres. (x_n, y_n) are the known locations of the transmitters (in metres) and (x, y) is the unknown location of the receiver (in metres). The location of the user is then determined by the intersection of these three circles. The addition of more transmitters complicates these equations but comes with the advantage of being able to determine location more accurately.
Additionally, it was found that if distance measurements are not very accurate these circles will not intersect at a point but rather at a region and this needs to be considered in the experimental component of the project.
k-Nearest Neighbors
The k-NN algorithm was the other algorithm identified to have great potential to be used to determine location. The k-Nearest Neighbours algorithm was chosen due to its ability to associate fingerprints of packet data with a location (or in the context of the first deployment of this system, a booth). If calibration and setup is possible k-NN can prove to be highly reliable in identifying which location (or booth) a user is closest to. This is because k-NN can associate locations with data points (RSSI values for example). It can then choose the closest n points (the RSSI values that match up most closely for example) and from these n points identify which location (booth) these points (or data packets) are associated with. Hence, distinguishing whether a user is closer to location1 (booth1) or location2 (booth2).
Trilateration relies on using some method to determine distance based on RSSI and depending on how it is applied, k-NN could also rely on using distances determined by RSSI. The method in which distance was determined is discussed below.
Distance Calculations
It was found (in literature) that RSSI follows a log-normal distribution [1]. As such the Log-Distance Path Loss Model was chosen to be used to determine distance from RSSI. Although alternative methods are in existence, these alternatives are to be explored in future work.
Log-Distance Path Loss Model
The Log-Distance Path Loss Model can be expressed as a function of RSSI [1]. This equation is:
where:
- RSS(dBm): is the received signal strength indicator picked up by the receiver at the current location at a particular point in time,
- RSSI_0 (dBm): is the received signal strength indicator at a reference distance of d_0(m),
- n: is a path loss exponent (n =2 for free space),
- d (m): is the distance between the transmitter and the receiver,
- d_0 (m): is a reference distance, and
- sd (dBm): is the standard deviation of RSSI measurements taken over some time
It was discovered that the path loss exponent n is likely to vary depending on environment [1]. The next component of the project development was to research into likely causes of path loss such that these could be looked at during experimentation.
Causes of Path Loss
Path loss is the "attenuation of signal power of a signal as it propagates through space" [1]. Likely causes of path loss include:
- Free Space Loss: the degradation of a signal due to distance (assuming complete line of sight between transmitters and receivers) [1]
- Fading Loss: time variation of signals due to changes in the transmission channel as a result of things such as furniture, human interference, movement of the devices [1].
- Multipath losses (reflection, diffraction, scattering): the signal is scattered or reflected due to objects changing its phase, attenuation or delay resulting in a degraded signal. Causes of multipath losses include reflection, diffraction and scattering [1].
- Refraction: change in the direction of an electromagnetic way as a result of changes in the medium in which the signal travels [1].
- Noise and interference: unwanted signals within the medium that affect the signals by distorting them at the receiver [1].
The last component of the algorithmic development phase was to outline some requirements and questions to be tested through experimentation that will be undertaken in the experimental phase.
Experimental Questions and Requirements
Experiments undertaken will need to be designed to answer the following questions:
- What received signal strength indicator (RSSI) resolution can be obtained with the chosen technology?
- How much do the RSSI values fluctuate with the chosen technology?
- What accuracy of distance measurements can be obtained using the distance path loss model with a path loss exponent of n = 2?
- How does distance affect RSSI values?
- Are the pre-set transmit powers correct?
- How well does the positioning algorithm, Trilateration, meet the requirements of the system and how accurately does it determine location?
- How well does a k-NN type positioning algorithm fulfil the positioning needs of the IPS and how accurately can it simulate and distinguish between booths of the first application site of Ingenuity 2015?
and to meet the following requirements:
- Able to determine the location of a user,
- Based on iBeacon technology,
- Obtain the highest possible location accuracy with the smallest amount of transmitters,
- Use transmitters that are easily deployed and do not need to be plugged in,
- Minimal calibration and setup at the application site (first application site (Ingenuity 2015),
- Use stationary transmitters,
- Use a single or a combination of positioning algorithm/s (in particular Trilateration or k-NN) based on the RSSI parameter.
Any additional requirements that have not been discussed here but have been discussed previously will also need to be met.
Experimental Approach
The experimentation component of the project was undertaken based on the following method:
- Design: a design of the test scenario was made based on meeting a purpose such as answering a question outlined above or justifying the use of one method over another. This design usually incorporated a diagrammatical outline of the test setup with details of where devices were to be placed.
- Setup: the determination of a location to setup the test in and the physical test setup. This usually involved considering the possible effects of the environment on the system.
- Data collection: advertisement packets were stored into a compressed gzip file using the PiBeacon over a certain amount of time.
- Pack up: the pack up of the test setup.
- Data Analysis: data obtained was extracted from the PiBeacon, converted into a text file and read into MATLAB scripts to be analysed.
- Conclusions: reaching conclusions based on the data analysis stage.
Application Development
The goal of the application development component of the project is to develop an app which applies the algorithms determined and the necessary background calculations needed to determine distances/location. The app will allow a user to view a map of the location and what booths/objects are in the location. It will provide a wiki page for the booth that a user is closest to. This stage involves the design of a GUI on the top of the app that enables easy interaction with the system to users. The application development component will involve the design and implementation of the functionalities outlined in Figure 1 below. It will then involve the design, storyboard and development of a GUI which will display the map and wiki page of exhibit points at Ingenuity 2015. An idea of what this will looks like are shown in Figures 2 and 3 below. The final stage of the Application development will be the integration of the algorithmic techniques into the app and testing of the final system.
Results and Evaluation
Indoor Positioning System Development
Although not used within all tests, a total of thirteen different RadBeacon Tags were available during this project. These Tags were differentiated with a unique Minor value ranging from 2-14. The test environments that were used in order to investigate how well the system could meet the requirements of the project are described below, including the experiments that were undertaken within each of these locations and the results and analysis of these experiments.
Test Environments
Isolated Environment
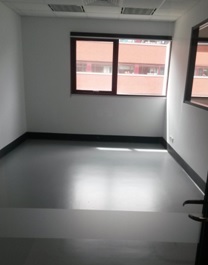
This room (see image below), typically used for autonomous vehicle testing, presented a somewhat isolated environment for experiments. The aspects of this room that made it somewhat ideal were the lack of:
- Human interference: there was minimal chance that the room would be disturbed by human activity.
- Objects and obstacles: there were no objects or obstacles such as furniture that could have affected the signals.
- Noise and interference: there was limited interference due to unwanted signals.
Initial System Calibration Test
The first experimental test that was undertaken in this test environment was an initial system capability test. The purpose of this test was to determine the system resolution and fluctuation of RSSI values obtainable with the chosen transmitter (Tags) and receiver (PiBeacon) technologies. The Isolated Environment described above was chosen such that the capability of the system could be observed with minimal interference from external factors.
Test Setup
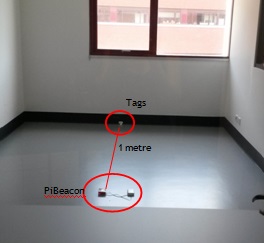
The test setup involved thirteen tags that were placed a measurement of one metre away from the receiver (PiBeacon) as shown in the image below. These Tags were switched out every two-five minutes ensuring data collected between these transitions was identified and removed during analysis. The Tags were set to the lowest advertising rate of once per second and the highest broadcasting power of 4dBm. The lowest advertising rate was chosen such to minimise the risk of lost packets due to competing devices that are advertising (which was not really a concern in this scenario). The highest broadcasting power was chosen as this provides the largest signal coverage area.
Test Results and Analysis
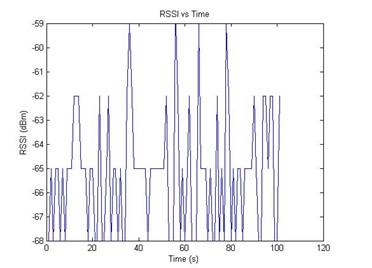
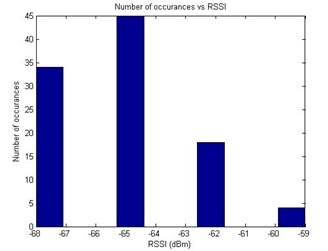
The data obtained during this experiment was imported into a text file which was read into MATLAB and analysed. The five minute capture of RSSI values obtained for the Tag with a Minor identifier number of 2 was extracted and plotted against time in the first image below and a histogram of RSSI values in the second image below.
It was observed in these images that there were four distinct values in which the RSSI readings fluctuated between. These were -68 dBm, -65 dBm, -62 dBm and -59 dBm. It can be observed that a step size of 3 dB exists between each of these values implying that this system setup had a resolution of 3 dBm. It can also be observed that the RSSI value -65 dBm is the value that most frequently occurred whereas -59 dBm was the RSSI value that least frequently occurred implying that the true RSSI estimate at this distance could be approximated to be around -65 dBm.
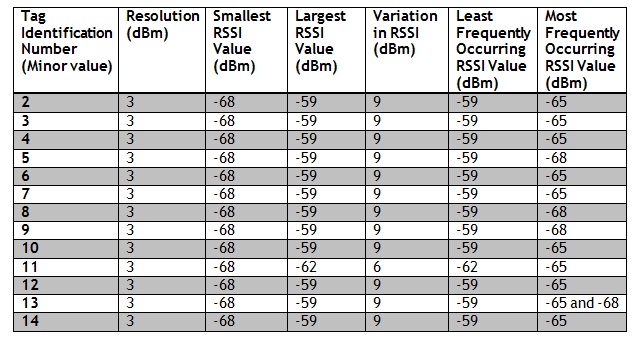
The table below shows the experimental results for all thirteen Tags. The table includes the Minor identification number that was used to differentiate between each Tag, the resolution the system setup was able to obtain (in dBm), the smallest RSSI reading (in dBm), the largest RSSI reading (in dBm), the variation of RSSI values (in dBm), the RSSI reading that occurred the least (in dBm) and the RSSI reading that occurred the most frequently (in dBm).
The results of this experiment showed minor variations in the outcomes for each different Tag. As a whole, the performance of each Tag was consistent. From these results it can be concluded that this system is capable of providing a resolution of 3 dBm. It can also be concluded that the signal fluctuation of the system can be expected to be around 6 dBm – 9 dBm under idealised circumstances.
Calibration Test
The next requirement that was tested was the accuracy of the system. The isolated test environment described above was also used for this experiment such that the accuracy of the system could be observed with minimal interference from external factors. In order to determine the accuracy of the system, a calibration test was completed. The purpose of this calibration test was not only to determine the accuracy of the system but also to compare the RSSI values at different reference distances. This enabled an analysis of how the RSSI values changed with distance and for the transmit power of each Tag to be compared with the RSSI values received at a measured distance of one metre.
Test Setup
This test setup was identical to the initial system capability test setup described above. The only difference was that the test was carried out for distances between the transmitter (Tags) and receiver (PiBeacon) of one metre, three metres and five metres.
Test Results and Analysis
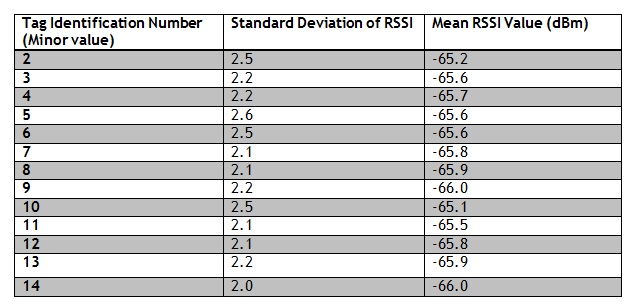
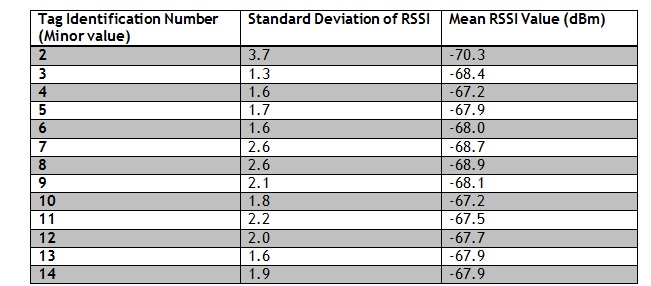
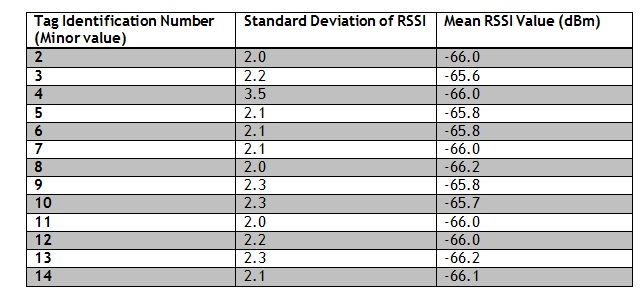
For each Tag, the standard deviation and mean of the RSSI values was taken for each of the measured distances (one metre, three metres and five metres). The results for the one metre test are shown in the first table below, the results for the three metre test are shown in the second table below and the results for the five metre test are shown in the third table below.
The tables above would suggest that on average the expected RSSI value for a Tag, located a distance of one metre from the Receiver, should be approximately -65/-66 dBm, an RSSI value of -68 dBm should be expected for a distance of three metres and an RSSI value of -66 dBm should be expected for a distance of three metres. The RSSI is expected to decrease in value the further away the receiver is from the transmitter. This implies the change from RSSI values around -65/66 dBm at one metre to RSSI values around -68 dBm at three metres is reasonable. However, the resolution of the system was found to be 3dBm which would suggest the values obtained for the three metre test are likely to be associated with a distance of 2 metres when using the calibrated RSSI values for one metre. Moreover, at five metres the system seems to struggle with an RSSI value of around -66 dBm which is similar to that obtained at a distance of one metre. This was because signal attenuation increases with distance as at further distances there are more things that can attenuate the signal.
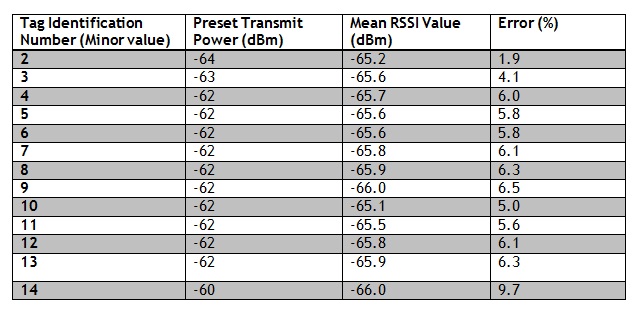
At the beginning of this project the Tags came with a preset reference power (which was assumedly the RSSI at exactly one metre from the transmitter). However, there was no guarantee this value was the value in which it was expected to be representing. As such a comparison, for each Tag, of the preset reference power against the obtained average RSSI value was made. This comparison was made in order to determine whether this parameter was what it was expected to be or whether the use of these ‘preset’ values would cause a calibration issue that could affect the accuracy of Log-Distance Path Loss Model calculations. The results are shown in the table below.
The table above reinforced the idea that a calibration for one metre was indeed needed for each of the Tags and the pre-set reference power values may not have been what they were expected to represent. The presented errors were quite high especially for Tag 14 which had an error of 9.7%. In order to meet the requirement of creating a system with the highest accuracy possible, percentage errors like this are unacceptable. In order to rectify this issue, the calibrated transmit powers (shown in Table 5) will replace the supposed preset reference powers in any Log-Distance Path Loss Model calculations.
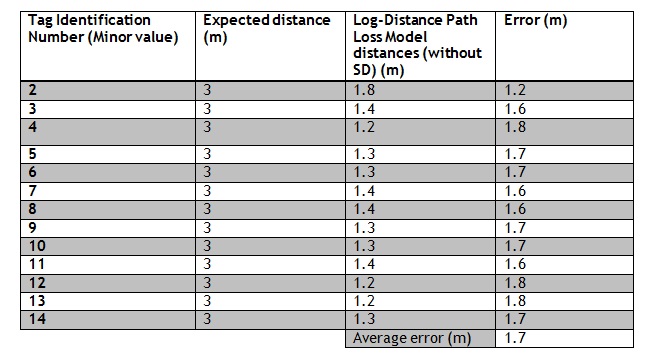
The last component of this test involved the use of the Log-Distance Path Loss Model formula. The data obtained in the three metre calibration test was used for the parameters of the Log-Distance Path Loss Model. The averaged RSSI over a five minute file was used as the RSSI input into the Log-Distance Path Loss Model, the calibrated transmit powers from the table above were used as the RSSI values at a reference distance of one metre, hence, the reference distance was one metre, the path loss exponent n was set to 2 which is usually the value used in free space and the standard deviation component was set and unset and compared in two different tests of distance. The table below shows how accurate the log-distance path loss model was in determining distance. It was found that the inclusion of the standard deviation in the distance equations only reduced the accuracy of the results as the fluctuations of RSSI values can be quite large. Hence, the standard deviation component of the log-distance path loss model was kept at zero.
It can be concluded from the table above that under these circumstances the accuracy of the system using a Log-Distance Path Loss Model is 1.7 metres.
Rearranging the Log-Distance Path Loss Model formula such that RSSI is obtained, and keeping a reference calibration RSSI at a distance of 1 metre, the expected RSSI values that should be obtained at three metres and five metres are approximately -75 dBm and -79 dBm respectively.
The errors in distance calculations can likely be contributed to three main factors: a calibration error, a path loss exponent error and/or an issue with resolution. The first factor is that the calibration test undertaken in this section may not have been accurate (a false reference of RSSI at one metre will cause all other measurements relying on this reference to be off). The second cause of error may have been due to a path loss exponent (n) of 2 being used (as this is the typical value for free space and this situation is not free space). The last factor that may have caused error is the limitation of the system to have a RSSI resolution of 3 dBm which makes it quite hard to differentiate one metre from another.
In conclusion, the results from the experiments undertaken in the Isolated Environment test setup have shown that the system has an RSSI resolution of 3 dBm and an accuracy of approximately 1.7 metres. Possible sources of error such as calibration problems, path loss exponent value, resolution limitations have also been identified.
Living Room/Dining Room Environment
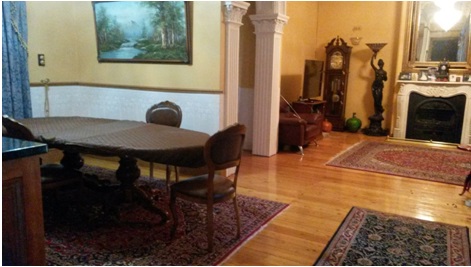
This room (see image below) represented a typical living room/dining room environment. There was a fairly common distribution of furniture around the room including: tables, chairs and armchairs, however, there was enough spaces that the transmitter (Tags) signal coverage was not limited. Likely causes of signal attenuation within this room can be attributed to minor interference from humans passing through, multipath components due to objects and obstacles and low signal interference from outside sources.
Trilateration Test
The only experimental test that was undertaken in this environment was a Trilateration test. The purpose of this test was to see how well the positioning algorithm, Trilateration, could meet the requirements of the system. This test was used to see how accurate the location of a user (receiver) could be found using the Trilateration algorithm. Moreover, being the algorithm with the most potential to minimise the amount of transmitters (Tags) needed in the final system, the Trilateration algorithm was tested with this intention in mind.
Test Setup
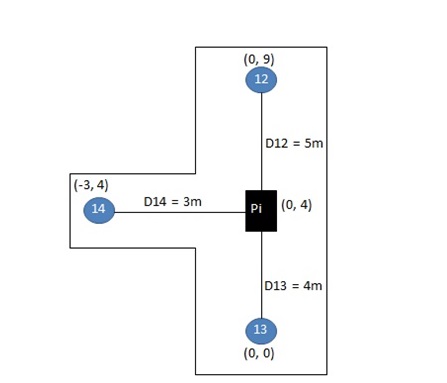
The test setup involved three iBeacon Tags placed a distance of three metres (D14), four metres (D13) and five metres (D12) away from the receiver (PiBeacon) in the living room/dining room environment as shown in the image below. Tags with Minor identification numbers (13, 14 and 12) were placed at fixed reference locations of (0, 0), (-3, 4) and (0, 9) respectively, as needed as part of the Trilateration algorithm method. The receiver (Pi) was placed at the measured location of (0, 4). Test Results and Analysis
The Tags were set to the lowest advertising rate of once per second and the highest broadcasting power of 4dBm. Data files were generated at five minute intervals and these files (consisting of captured advertisement packets) were analysed in MATLAB. The test was only run for a total of fifteen minutes (generating three data files).
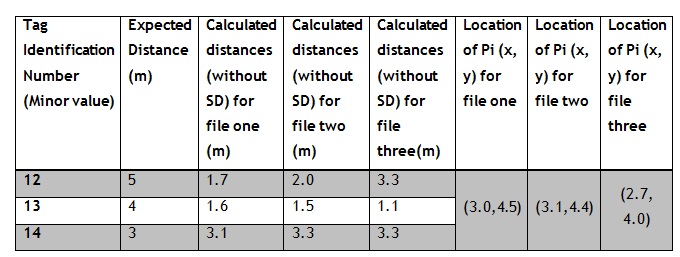
The Trilateration algorithm was also written up in MATLAB and the results of reading in each of these three files and performing Trilateration on the data is displayed in the table below. The Log-Distance Path Loss Model formula was used in order to find the distances between the transmitters and the receivers. The standard deviation component was set to zero.
It can be seen in the table above that for each of the three five minute blocks the determined location of the user (receiver) was approximately (3, 4). Compared to the expected/actual location of the user of (0, 4) the determined position was off by one metre in the x-direction and spot on in the y-direction. This error in the determined position of the user can be contributed to errors in the distance calculations. As seen in the table above, the system struggled to obtain reasonable measurements for distances greater than three metres but was quite accurate in determining the distance for Tag 14. These results correlate to what was observed in the Calibration test (in section 4.1.1.2) where the system seemed to struggle to accurately distinguish distances greater than three metres. This test has proven that an accuracy of about one metre was obtainable using the Trilateration algorithm. This test also proves that the system can remain relatively consistent when not interfered with by external sources (such as large human movement).
It can be concluded that the Trilateration algorithm is a very promising positioning algorithm to be used in the final system. It is not only simple to understand and implement but it has produced reasonable results. As the Trilateration algorithm only requires the use of at least three Tags, it is also an ideal algorithm for meeting the requirement of using a minimal amount of transmitters within the final IPS. It can be recommended that the use of Trilateration within the final system for the first application (Ingenuity 2015) will need to ensure Tags are placed approximately three metres (and no more) apart in order to distinguish between booths.
Classroom Environment
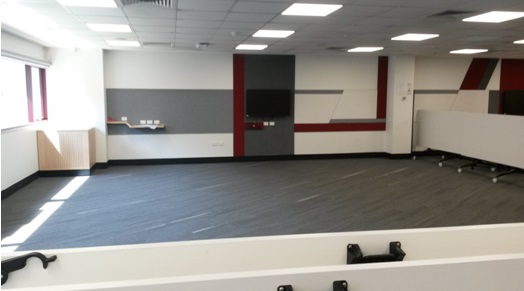
The last test scenario that was used was an isolated section of a University classroom (see image below). A barrier of tables was placed around an 8 metre by 10 metre section of a University classroom. This environment presented a large space free from objects and obstacles within the isolated area. However, the table barriers and large posts outside of the area may cause some multipath components to signals to occur. Furthermore, the isolated area of the classroom presented little to no interference from human activity, however, the space outside of the isolated test area was vastly populated. This room presented a high risk of signal interference due to outside sources as a result of wireless Bluetooth mouse and keyboards present within the room and due to any student wireless activity.
Grid Test
The only experiment that was carried out in this room was a Grid Test. The purpose of this test case was to test how well a k-NN type positioning algorithm could fulfil the positioning needs of the IPS. Furthermore, the purpose of this test was to simulate project booths at Ingenuity 2015 in order to meet the requirement of first deploying this system at Ingenuity 2015 (in order to determine the location of a user and distinguish which project booths they are closest to).
Test Setup
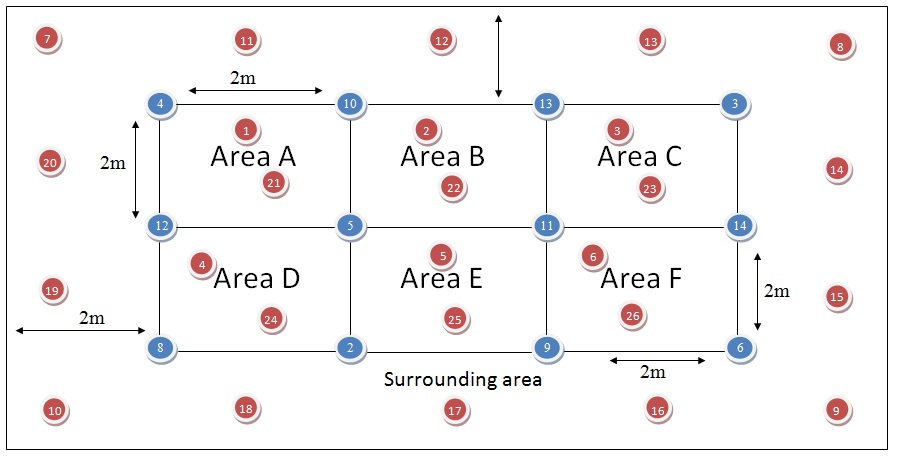
This test scenario involved the use of 12 Tags (identified by Minor value 2-6 and 8-14). These Tags were spread out over a 2 by 3 grid with each block of size 2 metres by 2 metres. The Tags were placed at each corner of each block as shown in the diagrammatical layout of this test is shown below. The size of each block in the grid was chosen to best simulate the size of booths at Ingenuity 2015. In this diagram, Tags are portrayed by blue circles and test points are portrayed by red circles. A receiver (PiBeacon) was placed at test points within each defined Area (A-F) for a total of five minutes and in the surrounding areas. All Tags were set to the lowest advertising rate of once per second and the highest broadcasting power of 4dBm. All test points are outlined in the diagram attached.
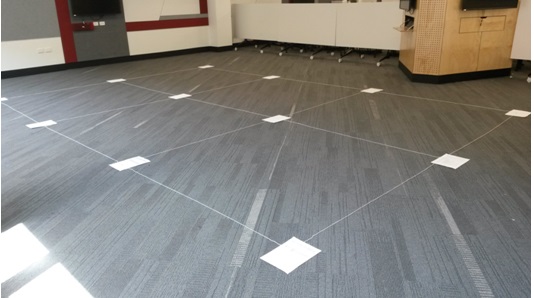
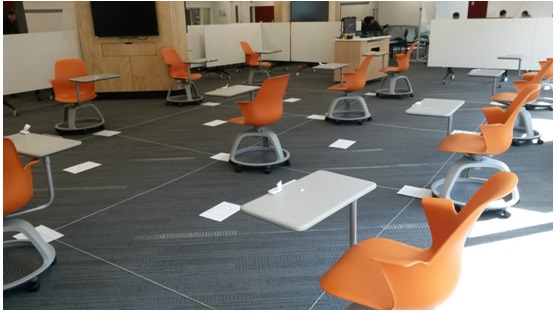
In the test setup the 2 by 3 grid was outlined by string with papers indicating the corners as seen in the image below. Chairs with attached tables were placed at the corners of each block such that the Tags could be rested upon these chairs and elevated from the ground. This is shown in the image below. The receiver was also placed on one of these tables and wheeled to a new location every five minutes. These movement intervals were taken into account in the results.
Test Results and Analysis
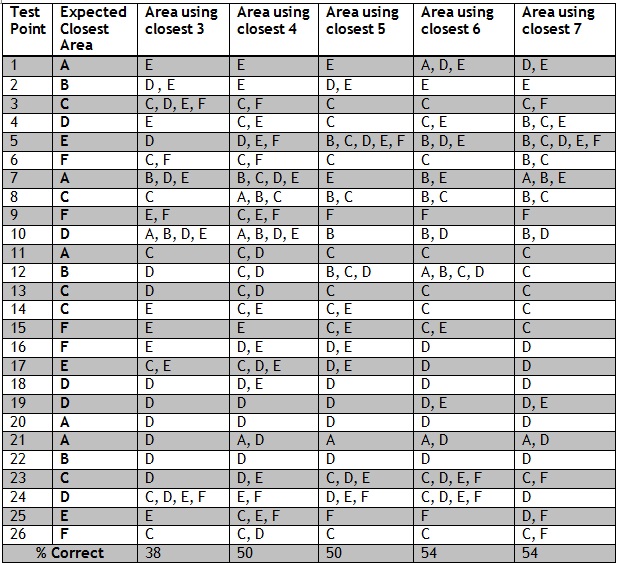
Data was captured for each of the 26 test cases. These data files were read into MATLAB and the k-NN like positioning algorithm was also written in MATLAB. This k-NN like algorithm first used the Log-Distance Path Loss Model to determine the distance between the transmitters and the receiver based on the mean RSSI value of each captured file. The algorithm then took the closest 3, 4, 5, 6, and 7 transmitters (Tags) to the receiver. Based on the closest Tags, the algorithm was then able to determine which area the receiver was closest to based on which Tag numbers in a specific area got the most hits. In the event where there was a tie between Areas, both Areas were outputted. The results for this experiment that were obtained using calibrated reference distances in the Log-Distance Path Loss Model equations are displayed in the table below.
The table includes the percentage of areas that were correctly identified as being either one of the closest or the closest area.
An analysis of the results in the table above would indicate that as a whole, the system was accurately able to determine the expected closest Area as the closest Area of one of the closest Areas to the receiver 49% of the time. It can be observed that the more Tags that were included in the determination of the closest Area, the more likely the correct Area would come up. However, the more Tags that were included in the determination of the closest Area, the more likely multiple closest Areas would be determined. Taking this into consideration, it was concluded that taking the nearest six Tags was the most appropriate solution for this system. In terms of the usefulness of this k-NN like algorithm in the final system, the system was able to determine at least the closest two or three areas to the receiver even if the exact area it was situated near was not determined. As the requirement of this system is to be able to detect the nearest three or four booths at the first application site of Ingenuity 2015, this system has potential to be effective.
Errors in results may have been caused by the use of metallic tables and chairs which would have caused the signals to attenuate. In order to improve this test scenario, alternatives to the chairs and tables should be found. Another factor that may have affected the results was the use of a path loss exponent of n = 2 in the distance path loss model equation as this is typically used for free space. The environmental factors of the room such as signal interference as described above may have also affected the system. In conclusion, this k-NN like algorithm has potential to be used in the first application of Ingenuity 2015 in final system. It has an accuracy of determining the closest booth/Area of approximately 49% and with perhaps modifications to the Log-Distance Path Loss Model or the use of less Tags, the results could be improved.
iOS Application Development
Conclusions and Future Work
The main objective of this project was to develop an indoor positioning system (IPS) based on Bluetooth Low Energy technology that could be integrated into an application developed for handheld iOS devices with the potential to be integrated into a similar application developed for Android handheld devices in the future. The first application of this system was to be deployed at Ingenuity 2015 where the system would be used to determine the location of a user and provide useful information about the closest three or four project booths to the user.
It was discovered that technologies based on Bluetooth LE communications are the most appropriate for the purposes of this project as they can provide location based information that can be used for advertisement. This was one of the requirements outlined earlier. Apple’s iBeacon technology was chosen to be the location and proximity detection technology to be used within the system. Radius Networks RadBeacon Tags and PiBeacon were the chosen technologies to be used as transmitters and receivers within the system that can use iBeacon. The Trilateraton and k-NN positioning algorithms were also identified to be the algorithms with the most potential to determine location well, within the final system.
The main requirements in which the designed IPS needed to satisfy were:
- Be able to determine, with the highest possible accuracy, the location of a user within an indoor setting,
- Use components based on Bluetooth Low Energy technology,
- Use components that are small and easily deployed,
- Use positioning algorithms that are simple and can be easily integrated into an application developed for iOS (and possibly Android in the future),
- Require minimal calibration and setup at the deployment location,
- Use the least amount of transmitters possible.
- Able to provide location based information that can be used for advertisement,
- Use technology developed for iOS (and Android, where possible).
These requirements along with some more specific requirements and experimentation questions were met in the experimental phase of the project. The conclusions made throughout this project and the future development of this project are summarised below.
Conclusions
It was discovered through experimentation that the devices used within this system were capable of providing an RSSI resolution of 3dBm. The signal fluctuation of the system can be expected to be around 6 dBm – 9 dBm under idealised circumstances. A calibration of devices is necessary in order to improve the accuracy of distance measurements and hence, location. The system was found to have an accuracy of about 1 metre - 1.7 metres. Possible sources of errors within this project were identified as calibration problems, use of the wrong path loss exponent and resolution limitations of the system. The Trilateration algorithm was found to have great potential for consideration in the final IPS. A location accuracy of one metre was able to be determined using this positioning algorithm. A k-NN like method was also proven to have potential to be used in the final IPS. This positioning algorithm, when applied to an Ingenuity 2015 type situation, was able to determine at least the closest two or three areas/booths to a user. The positioning algorithm itself was only seen to be capable of determining an exact area/booth 49% of the time. The work completed is at a stage where it can be integrated into an iOS application, although the accuracy of the system still needs to be improved.
Future Work
This project has the potential for a large aspect of future development. Firstly, more experimental analysis of the current technologies and tools used and their usefulness in determining distances should be made, as well as further experimental proof of the accuracy of the system under different circumstances and environments. These experimentations can be based on:
- Analysis involving varying the path loss exponent n,
- Improvements to the current poisoning algorithms that have been suggested and experimented with,
- Different methods of determining distance as opposed to the Log-Distance Path Loss Model,
- The effect of largely human populated environments,
- The use of different positioning algorithms,
- The use of the Kalman filter for filtering and smoothing RSSI values,
- The use of three dimensions and more than three transmitters used in the Trilateration algorithm,
- And many more
The positioning techniques and implementations developed through this project will need to be integrated into an iOS application and further tested. This can be further expanded upon with the introduction of Android.
Project Team
Students
- Mr Huajian Huang
- Ms Kyriaki Georgia Morias
Supervisors
References
- ↑ 1.00 1.01 1.02 1.03 1.04 1.05 1.06 1.07 1.08 1.09 1.10 1.11 1.12 1.13 1.14 1.15 1.16 1.17 1.18 A. Salas, "Indoor Positioning System based on Bluetooth Low Energy," M.S. thesis, Universitat Politècnica de Catalunya, June 2014.
- ↑ 2.0 2.1 2.2 A. Bekkelien, "Bluetooth Indoor Positioning", M.S these, Dept. Computer Science, University of Geneva, March 2012.
- ↑ 3.0 3.1 3.2 3.3 K. Ozsoy, A. Bozkurt and I. Tekin, “Indoor positioning based on global positioning system signals”, Microwave and Optical Technology Letters, vol. 55, no. 5, pp. 1091-1097, 2013.
- ↑ 4.00 4.01 4.02 4.03 4.04 4.05 4.06 4.07 4.08 4.09 4.10 4.11 4.12 4.13 4.14 4.15 E. Dahlgren and H. Mahmood, “Evaluation of indoor positioning based on Bluetooth Smart technology,” M.S. thesis, Dept. Computer Science and Engineering, Chalmers University of Technology, Göteborg, Sweden, 2014.
- ↑ Z. Farid, R. Nordin and M. Ismail, “Recent Advances in Wireless Indoor Localization Techniques and System”, Journal of Computer Networks and Communications, vol. 2013, 2013.
- ↑ 6.0 6.1 University of Virginia. (2015). Indoor/Outdoor Localization. [Online]. Available: http://www.cs.virginia.edu/~mwb7w/union/tour_guide/background.html.
- ↑ M. Brain, T. Wilson and B. Johnson. (2001). How WiFi Works, HowStuffWorks. [Online]. Available: http://computer.howstuffworks.com/wireless-network1.htm.
- ↑ Hossain, A.K.M.M.; Hien Nguyen Van; Yunye Jin; Wee-Seng Soh, "Indoor Localization Using Multiple Wireless Technologies," Mobile Adhoc and Sensor Systems, 2007. MASS 2007. IEEE International Conference on , vol., no., pp.1,8, 8-11 Oct. 2007
- ↑ 9.0 9.1 Y. Gu, A. Lo and I. Niemegeers, “A survey of indoor positioning systems for wireless personal networks”, IEEE Communications Surveys & Tutorials, vol. 11, no. 1, pp. 13-32, 2009.
- ↑ X. Chen, J. Kong, Y. Guo and X. Chen, “An Empirical Study of IndoorLocalization Algorithms with Densely Deployed APs,” IEEE, pp. 517 – 522, 2014
- ↑ 11.0 11.1 Oksar, I., "A Bluetooth signal strength based indoor localization method," Systems, Signals and Image Processing (IWSSIP), 2014 International Conference on , vol., no., pp.251,254, 12-15 May 2014
- ↑ 12.0 12.1 E. Mackensen, M. Lai, T. Wendt, “Bluetooth low energy (ble) based wireless sensors,in: Sensors”, 2012 IEEE, 2012, pp. 1-4.
- ↑ R. Nilsson, B. Saltzstein. (2012). Bluetooth Low Energy vs. Classic Bluetooth: Choose the Best Wireless Technology For Your Application. [Online]. Available: http://www.medicalelectronicsdesign.com/article/bluetooth-low-energy-vs-classic-bluetooth-choose-best-wireless-technology-your-application.
- ↑ D. Stojanović, N. Stojanović, "INDOOR LOCALIZATION AND TRACKING: METHODS, TECHNOLOGIES AND RESEARCH CHALLENGES", Faculty of Electronic Engineering, Dept. Computer Science, Republic of Serbia, Vol. 13, No 1, 2014, pp. 57 - 72, 2014
- ↑ P. Yanak. (2014). How To Determine Location If You have A Roof Over Your Head. [Online]. Available: http://blog.lemberg.co.uk/how-determine-location-if-you-have-roof-over-your-head.
- ↑ iBeacon Insider. (2014). 'What is iBeacon? A Guide to iBeacons'. [Online]. Available:http://www.ibeacon.com/what-is-ibeacon-a-guide-to-beacons/. [Accessed: 17- Apr- 2015].
- ↑ J. Lunn. (2013). How does PayPal Beacon work. [Online]. Available: https://devblog.paypal.com/how-does-paypal-beacon-work/.
- ↑ Getting Started with iBeacon. (2014). [Online]. Available: https://developer.apple.com/ibeacon/Getting-Started-with-iBeacon.pdf. [Accessed: 26- Mar- 2015].
- ↑ 19.0 19.1 E. Mackensen, M. Lai, T. Wendt, Bluetooth low energy (ble) based wireless sensors,in: Sensors, 2012 IEEE, 2012, pp. 1-4.
- ↑ Radius Networks. (2015). RadBeacon Tag Specs. [Online]. Available:http://www.radiusnetworks.com/ibeacon/radbeacon/tag/specs.html. [Accessed:17- Apr- 2015].
- ↑ 21.0 21.1 BeaconStac. (2015). How Stadiums can use Beacons to Enhance Fans’ Experiences. [Online]. Available: http://blog.beaconstac.com/how-stadiums-can-use-beacons-to- enhance-fans/.
Cite error: Invalid
<ref>tag; name "ref29" defined multiple times with different content
Booth List (for internal use only)
This section is intended for the use of project teams. It contains the locations of each project booth in the Convention Centre.
- <project_01> (270,430)
- <project_04> (310,430)
- <project_05> (343,430)
- <project_06> (377,430)
- <project_09> (369,333)
- <project_10> (200,333)
- <project_11> (161,333)
- <project_12> (289,222)
- <project_15> (406,353)
- <project_16> (271,353)
- <project_17> (235,353)
- <project_18> (200,353)
- <project_21> (476,353)
- <project_22> (438,353)
- <project_25> (163,353)
- <project_26> (288,449)
- <project_28> (360,243)
- <project_31> (323,243)
- <project_32> (287,243)
- <project_40> (324,222)
- <project_42> (369,353)
- <project_46> (361,222)
- <project_50> (361,449)
- <project_61> (270,333)
- <project_70> (404,333)
- <project_71> (441,333)
- <project_72> (480,333)
- <project_73> (507,343)
