Projects:2015s2-203 Analysis of Heart Sound Signals using the Wavelet Transform
Contents
           1 Project Information
                       1.1 Introduction
                       1.2 Structure of heart
                       1.3 Analytical approach
                                   1.3.1 FFT
                                   1.3.2 STFT
                                   1.3.3 CWT
                                   1.3.4 HHT
                                   1.3.5 DWT
           2 conclusion
           3 future work
           4 Team
                       4.1 Group members
                       4.2 Supervisors
Project Information
1.1 Introduction
Heart sound signals are very important physical signals of human body. It react the information about the condition of heart valves movement and circulation system. By using stethoscope, heart sound can be heard in a quiet place, and it can be transformed by sound transducer into electrical signals and recorded as phonocardiogram. For the purpose of accurate analysis, visual analysis is also important in diagnosing. The phonocardiogram can be transformed and calculated to have a better time-frequency resolution for the analysis. The aim of this project is to apply mathematical techniques for the analysis of heart sounds for diagnostic assistance. Successful extraction of key features from such signals will help identify several different types of abnormalities.
1.2 Structure of heart
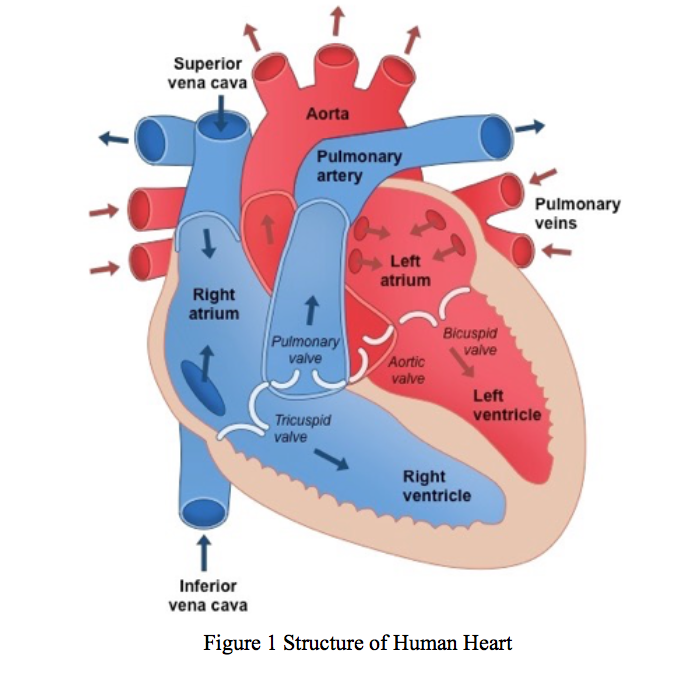
The human heart is a four-chambered muscular organ, shaped and sized roughly like a man's closed fist and sits in the chest cavity between two lungs. The purpose of the heart is to pump blood out though the whole body and renewing the oxygen content. The heart we can see from the figure below four chambers, which are right atrium (RA), right ventricle (RV), left atrium (LA) and left ventricle (LV).
1.3 Analytical approach
1.3.1 FFT
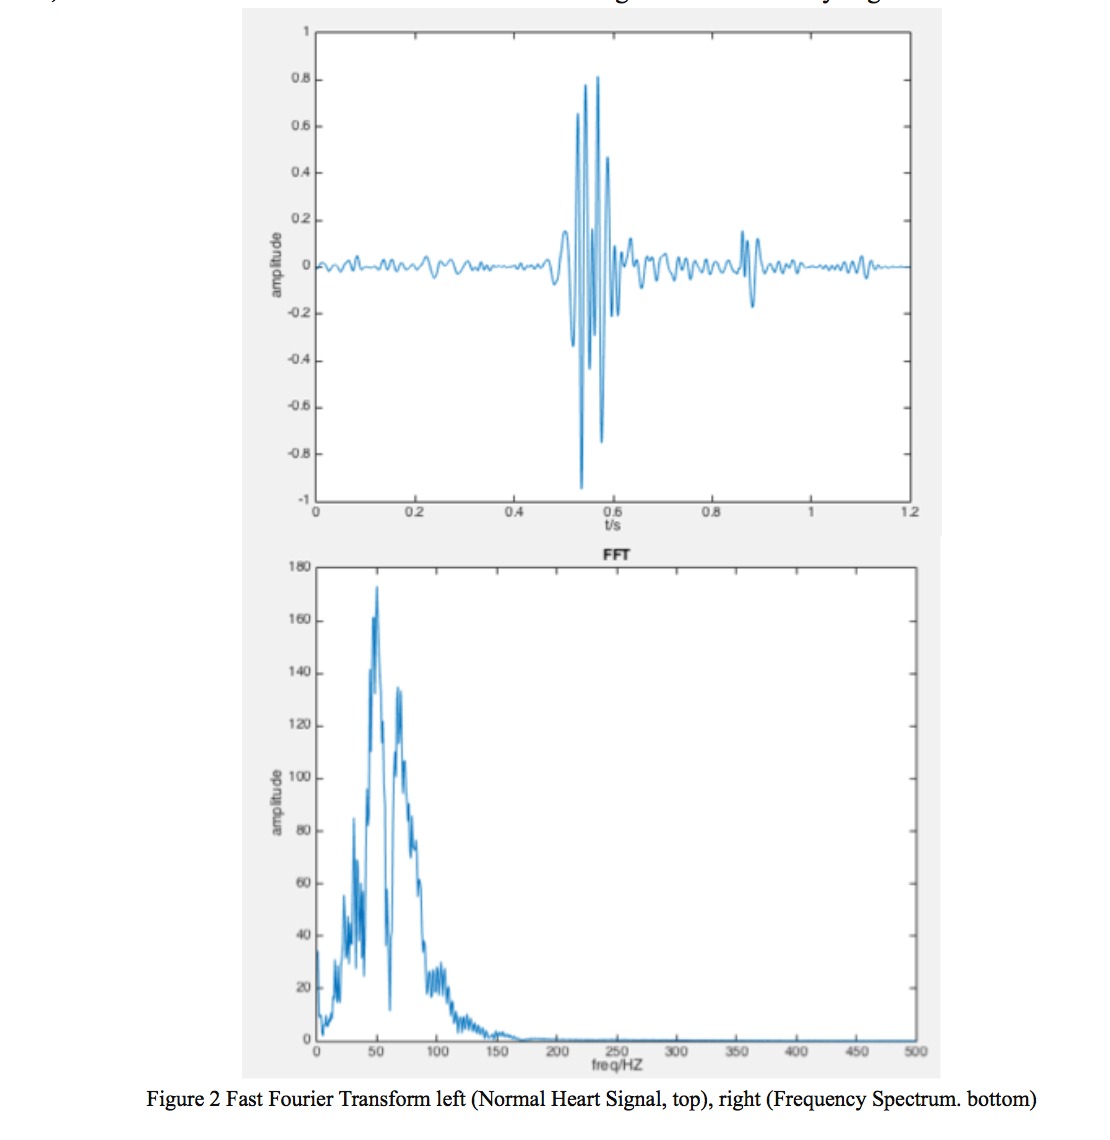
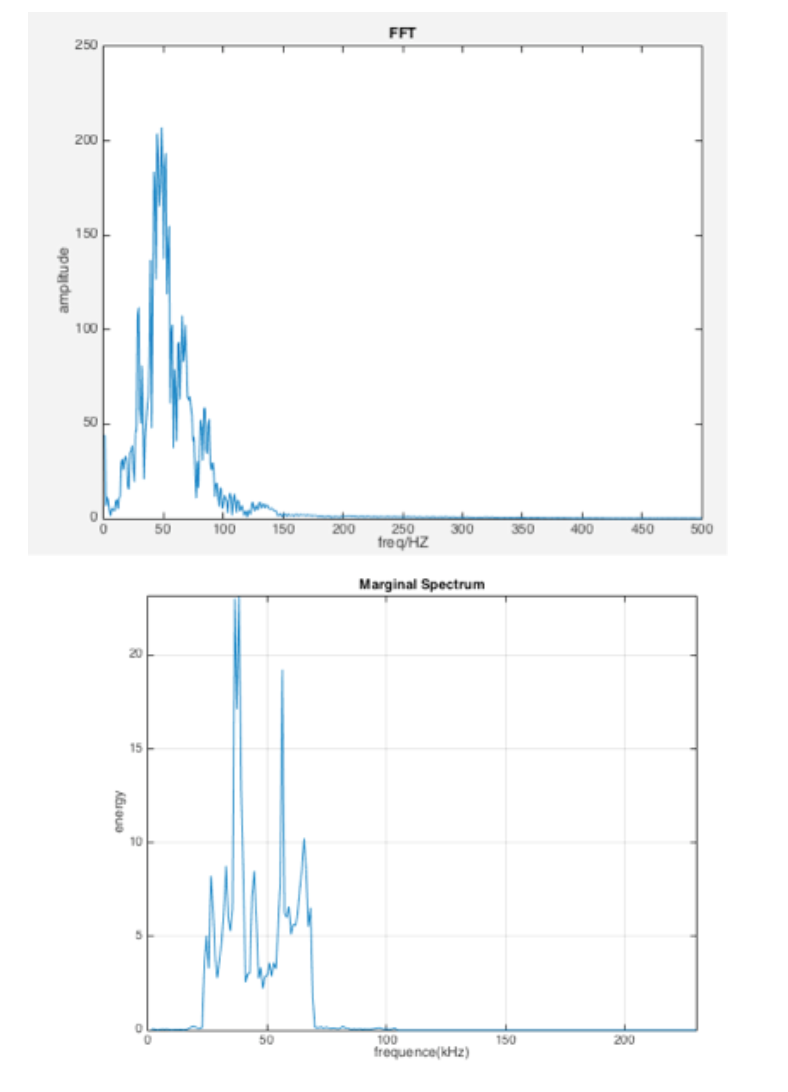
Fourier transform have great effect on transforming the signal from time-domain to frequency-domain, the spectrum shows a lot about frequency information of the PCG signals. However, the absence of the time-domain information is also significant in the analyzing.
1.3.2 STFT
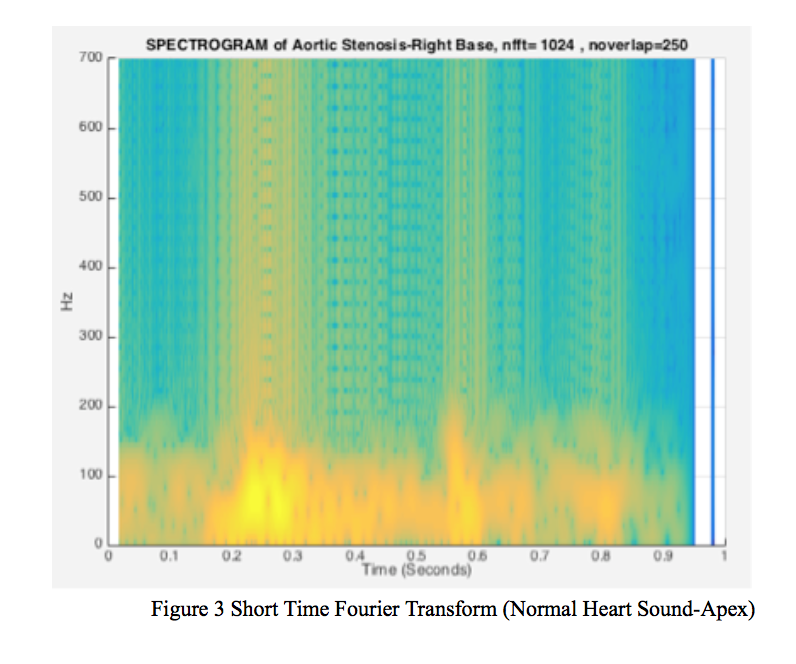
Heartbeat is a very complex dynamic process. Thus, the analysis of frequency of heart sound signal is the key point of the procedure. The time-frequency analysis is a highly efficient way to go through the non-stationary signals since the noise ratio is high enough. The Short-Time Fourier Transform is introduced, as it is a way of time-frequency analysis. The STFT is obtained from the usual FT by multiplying the time signal x(t) by an appropriate sliding time window w(t). It provides some information about time and frequencies that a signal event occurs. However, one can only obtain this information with limited precision, which is determined by the size of the window, also, it has strict limitations on time-frequency resolution.
1.3.3 CWT
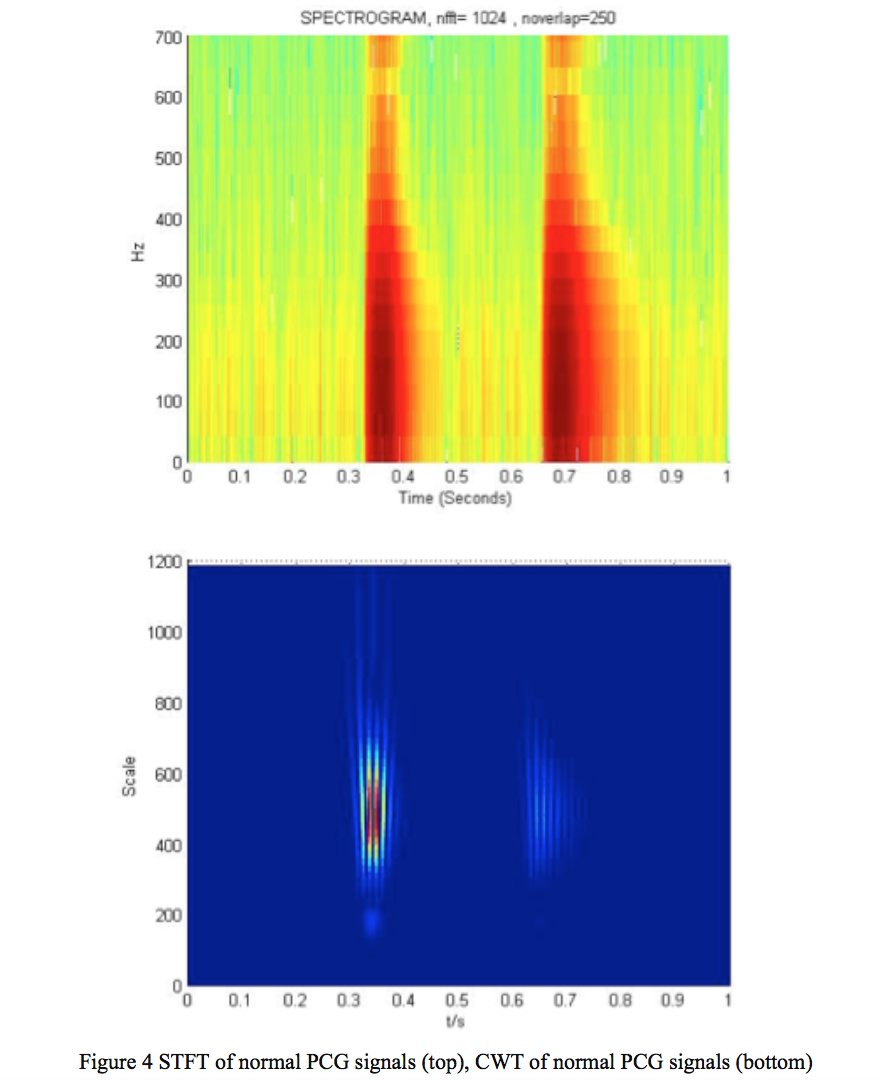
The wavelet transform is also used to analyze the heart sound in time and frequency domains. It decomposes signals into various scales (frequency) and shifts (in time). It uses narrow windows when observing the high frequency and automatically uses wide window when observing the low frequency. This particular property of wavelet generates good time resolution at high frequency and good frequency resolution at low frequency.
a) Comparison of STFT and CWT
The fact is both time and frequency features are important in the analysis. Therefore, the best resolution is desired. Continuous Wavelet Transform shows a clear boundary both in time and frequency while Short Time Fourier Transform does not.
b) Localization of heart sound In order to locate the heart sound, it is essential to smooth the plot, which means to turn the strips into blobs. Based on FFT spectrum, scale range from 1 to 1200 contains all the details in the heart sound.
[[File:屏幕快照 2016-06-30 上午9.51.03.png] ] Scalogram (a) is computed using CWT from a normal heart sound taken from apex area. Scalogram (b) shows a smoothed Scalogram that allows us to make key parameter measurements, such as the time between the first heart sound (S1) and the second heart sound (S2).
c) Comparison of normal sound and aortic stenosis sound
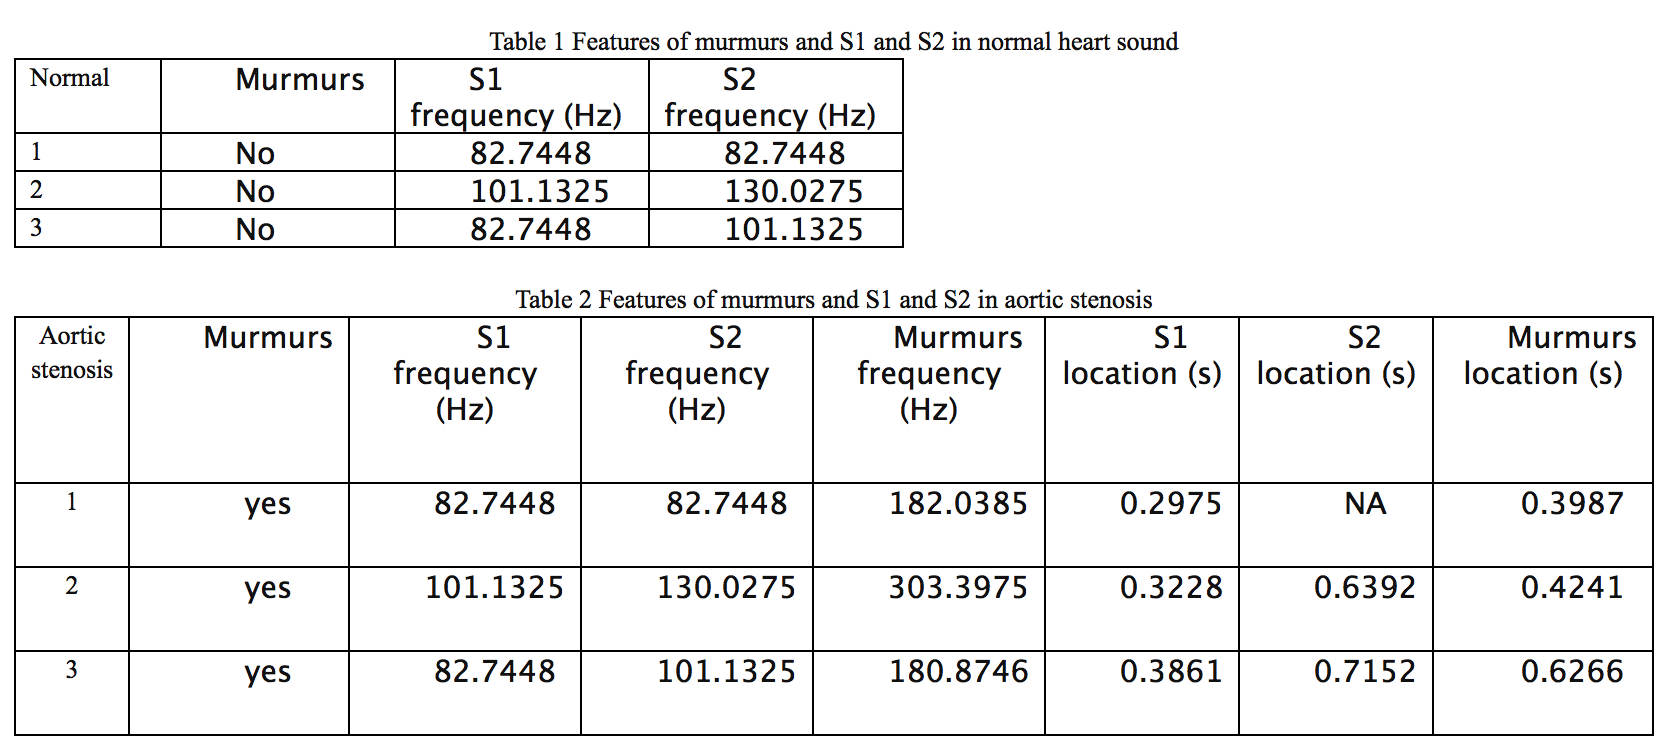
Murmurs are produced by turbulent flows. Thus the frequency of murmurs is always higher than that of S1 and S2. In order to detect murmurs, we look into high frequency area (100Hz more than S1 and S2), scale range from 1 to 240. According to the detected value, the frequency of murmurs is twice as that of S1 and S2.
1.3.4 HHT
Fourier methods are of limited of use, the absence of analysis of time domain and low efficient of non-stationary signal analysis are the key point comparing with the HHT, and the instantaneous frequency analysis in HHT is more precise in locating frequency generated by heart valves. The Hilbert-Huang Transform contains two main parts, which are EMD and Hilbert Transform. The main idea of the HHT is the EMD. The EMD method decomposes the signal into many levels of IMFs. This kind of method is similar to way Fourier Transform. In order to apply Hilbert Transform to a time series, the series of the signal must be symmetric about the local mean zero with no positive minima or negative maxima. EMD is a way of breaking down signals into various components (IMFs) in order to apply Hilbert transform. Marginal spectrum (MS) stands for the distribution of accumulated amplitude of each frequency point in the entire dataset. This MS comes from the first IMF. Comparing two spectrums, the clear frequency range and peaks of marginal spectrum is more precise to locate S1 and S2, which are mainly from 25Hz-50Hz (S1) and 50Hz-65Hz (S2) separately.
1.3.5 DWT
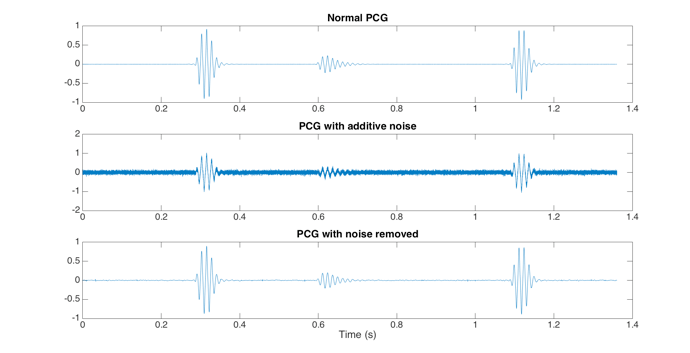
The PCG would be a very useful tool in terms of diagnose. When the PCG is contaminated by unwanted noise, the diagnose cannot be performed. The current study examines methods of eliminating the noise from PCG with wavelet analysis and averaging process. There is no way of determining what is the noise component from environment once the measurement has been recorded. Thus in every case and situation, the noise is different. Figure illustrates the principle of de-noising PCG signal
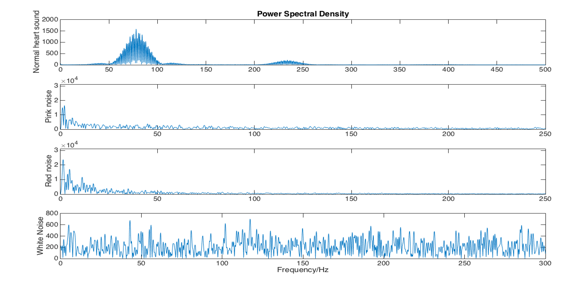
The character of noise is recognized as coloured instead of only white. Figure 3.1.2 proves that the power spectral densities of pink, red and white and a real PCG signal measurements are presents.
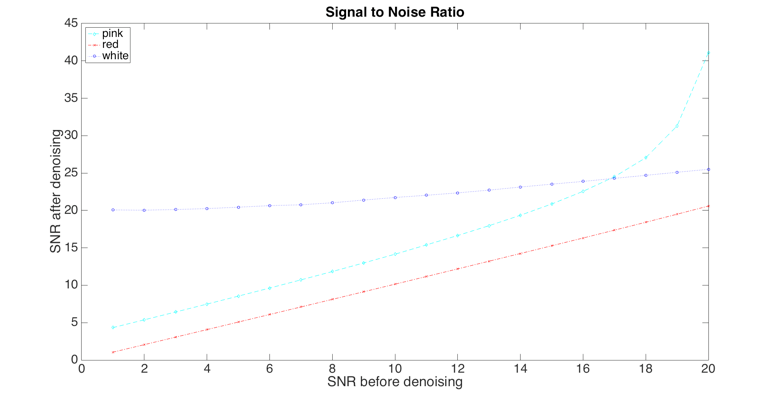
Using wavelet can perform de-noising process of a one-dimensional signals. Because the wavelet de-noising algorithm, performs similarly so that the colour of noise is regardless and pink noise is only considered in further part of this paper because de-noising pink noise has better performance in the SNR evaluation (shown in figure)
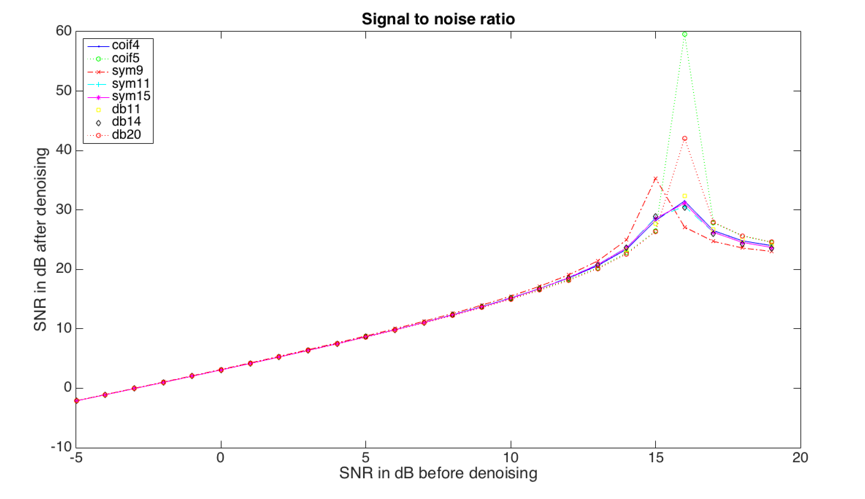
Wavelet basis function is decided to remove the noise accurately. Figure 3.1.9 presents the comparison of algorithm achievement for wavelet basis function that is Coif (4 and 5), Daubechies (11, 14 and 20), and Symlet (9, 11 and 14) wavelets. The level of decomposition is 10 and the threshold is the application of minimaxi threshold algorithm and mln rescaling function.
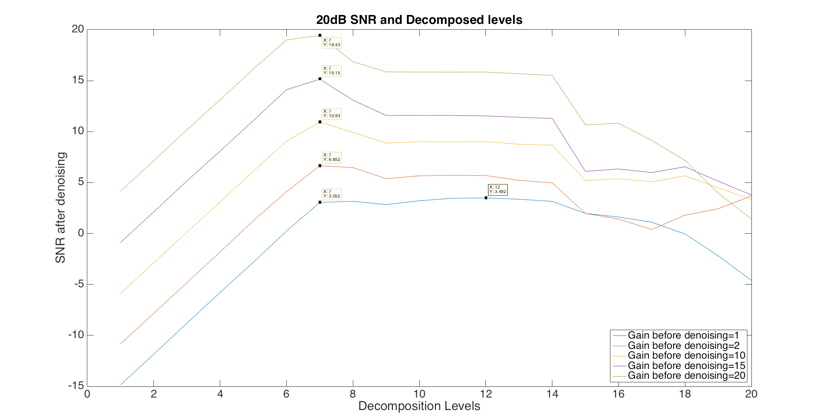
The next step is decision of the decomposition level. The signal-to-noise ratio is calculated to evaluate the signal contaminated by white noise of 1dB, 5dB, 10dB, 15dB and 20dB. Coif5 is performed for the DWT decomposition. Minimaxi threshold algorithm is selected for the threshold selection algorithm. Mln rescaling function is peaked for the rescaling function. Therefore, the suitable decomposition level is at 7th.
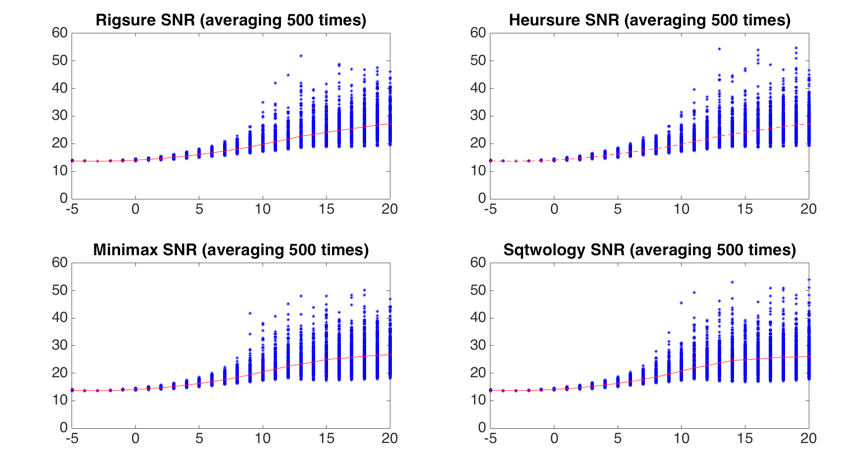
Figure shows the comparison of threshold selection algorithm combined with averaging process for wavelet de-noising.
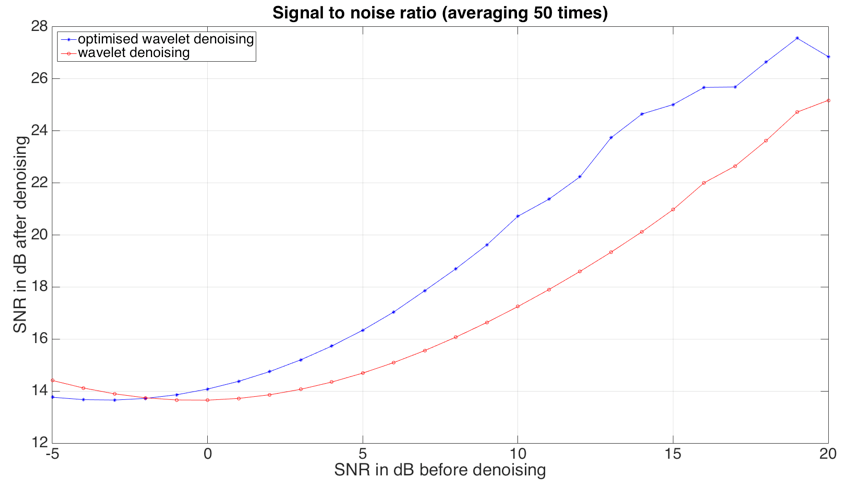
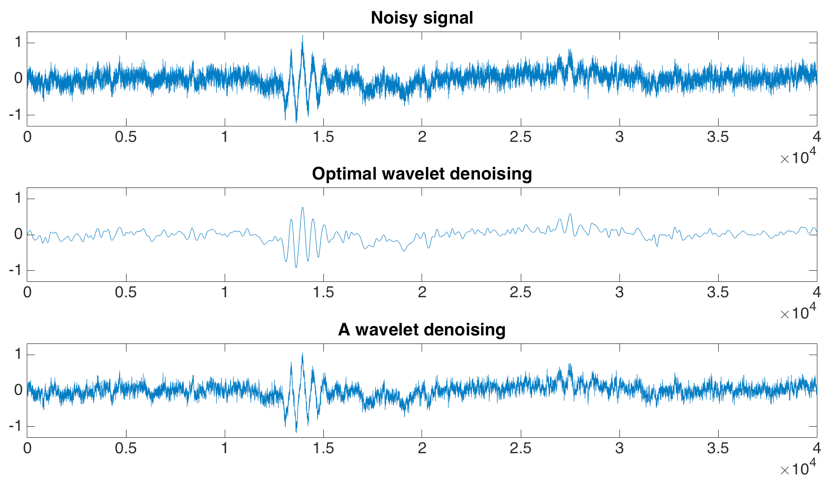
2. Conclusion To sum up, the optimal parameters of wavelet denoising on PCG signal with pink noise are sqtwology threshold selection algorithm, mln threshold rescaling function at level 7th. Figure 3.1.15 indicates the comparison between optimal wavelet denosing and wavelet denoising. Optimal wavelet denoising using the optimal parameters compared with the wavelet denoising using Rigrsure threshold selection algorithm and sln rescaling threshold function at level 4th. The mother wavelet is coif5 and using soft threshold. It can be observed that the performance of optimal wavelet denoising (blue), mean SNR = 19.3279dB, is more outstanding than the wavelet denoisng (red), mean SNR = 17.3488dB in SNR evaluation. After using different sized matrix, it shows matrix size of 1100*4 with 50% overlapping gives minimum time error between automatically and manually detected value. Scale range from 1 to 1200 contains all the detail of heart sounds. Scales set for murmurs detection normally depends on S1 and S2, frequency of murmurs is about twice as that of S1 and S2 as turbulent flow always has a high frequency. Scale range from 1 to 240 appears to be good for most murmurs detection. Hilbert-Huang transform can reveal the exact frequency generated by heart valves and with high time-frequency resolution.
3. Future work In the future, the analysis of marginal spectrum will be focused on the higher level of IMFs.
4. Team
4.1 Group Member
Chenyang Tang
Yinpu Wang
Zishuo Li
4.2 Supervisors
 Brian NG
 Jagan Mazumdar
