Projects:2015s2-210 Automated Classification of Heartbeats in Long-Term ECG
Contents
Project Group Details
Topic
- 2015s2 - UG Project 210 Automated classification of heartbeats in long-term ECG
Team Members
- Yunying Zuo and Siyuan Wen
Supervisors
- A/Prof Mathias Baumert
Introduction and Background
An Electrocardiogram (ECG) is a medical test that can detect electrical activity of the heart over a period of time using electrodes. These electrodes are placed on the arms, legs and chests of patients, which are used to detect the electrical changes on the skin [1]. Figure 1 is a diagram of the sinus rhythm for a human, which is made up of P wave, PR segment, QRS complex, ST segment and T wave. The sinus rhythm is defined as the normal rhythm of the heart set by the heart natural pacemaker. The QRS complex represents the heartbeat whose shape, amplitude and segment length can indicate the level of heart health, so this is a significant component in the ECG signal analysis. The ST segment, PR segment, QT interval and PR interval are essential parameters that can be used to compare with a sinus rhythm’s pattern. In that way, it can automatically classify normal and abnormal heartbeats. Nowadays, ECG signals can be transmitted wirelessly between computers and instruments and the analysis results can be achieved immediately. There are many useful systems had been produced and implemented into real life, like 12-lead off-line ECG analysis, Holter tape analysis and real-time patient monitoring [2].
A traditional ECG signal is usually a short-term ECG recording that contains a few minutes’ length of high–revolution ECG signal. The advantages are low noise, high efficiency and accuracy. The disadvantages are also significant where some intermittent cardiac abnormalities might not be detected with a short-term duration. It is consequence as promoting the development of Holter ECG signals that have 24 or 48 hours recording time. In a long-term detection, it involves a massive amount of noises caused by daily motion, electric devices interference and internal power lines, and it is unlikely to analyse all heartbeats visually. It already has some proposed algorithms and software tools that can analyse Holter ECG signals automatically with a high accuracy and sensitivity.
Project Aims
In this project, it is aiming at develop a software tool that is able to analyse long-term ECG signals quickly and accurately. The software tool shall be able to improve the reliability and accuracy of the outcomes comparing with manual diagnosis in the situation that the input ECG signal is the mixture of the signal and noises. The overall accuracy shall be comparable with proposed algorithm and software tool for analysis (90%), which includes QRS complex detection and classification’s accuracy represented by sensitivity and positive predictivity. In the interface aspect, it is required to be friendly to doctors, patients and the personnel from all age groups. The following functions should be realised and installed upon the software tool.
- ECG type file loading
- QRS complex automatic detection and classification
- Data manual modification
- Average waveform analysis
- Data preservation
Overview
Project Overview
This project aims at developing a software tool, which can well present and analyse long-term ECG (electrocardiogram) signals automatically. The project will be developed from two aspects, which are the interface and signal processing. In the interface section, it is supposed to demonstrate all the features that need to be achieved neatly and plot ECG waveform clearly. In the signal processing part, it will implement appropriate algorithms in Matlab to process the input ECG signals according to the commands that are sent from the interface, such as filtering noise, QRS complex detection, automated classification and so on. A long-term ECG signal usually has a 24 hours period, while the patient would have a lot of motions. Therefore, reducing noise and improving the accuracy become a big challenge in the development of the long-term ECG. That is also one of the most significant reasons that explains why the project is important. In the final project deliverable, it is expected to produce a user-friendly software tool that can analyse ECG signals efficiently and accurately. In the other word, it can reduce the influence of the noises at the maximum extent and precisely locate and classify the heartbeats.
Software Overview
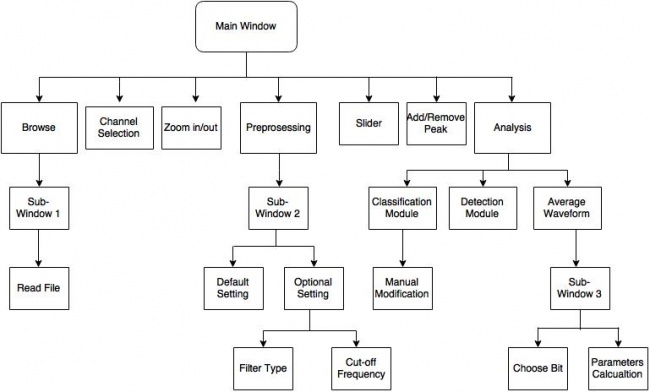
The flow chart demonstrates the structure of the interface. The main window contains browse, channel selection, zoom in, zoom out, pre-processing and analysis. The Browse is used for file reading, and user can choose which ECG file he wants the system to read. The channel selection is designed for diagram editing. There are three ECG signals displayed on the diagram region, expect channel selection of the three signals, user also can choose any one of them zoom in or zoom out and through slider to display the rest of diagram. The main job of pre-processing is filter out the noise in the data. The pre-processing also provides default setting and optional setting choices, user can through input cut-off frequency and select filter type to design a digital filter. Analysis is the most important part, which contains detection module, classification module and average waveform. The QRS detection section must be executed before the classification and average waveform, and the major role is that detect the QRS complex on the diagram. After determining the QRS complex location, users can remove or add a heartbeat if there is any obvious mis detection. Then the system is ready to run classification and averaging waveform. After classifying all heartbeats, it indicates the heartbeat type on the plotting area and generates a summary window to include the amount of each type. Also, users are able to change the type of a selected heartbeat by simple pressing keyboard. In the averaging waveform, it averages the selected signal interval and results as one-second interval. Additionally, it figures out the feature’s values of the averaged waveform on the calculation bar.
Project Outcomes
Operating Procedure
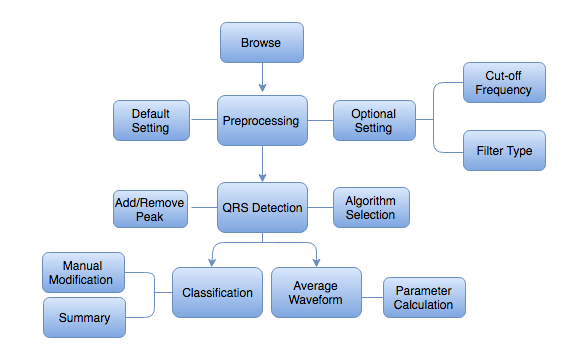
This is the general operating procedure shown in the flowchart. It always starts with loading an ECG signal into the interface. Then it applies the pre-processing function where it filters out noises with default setting. Otherwise, users could choose other filter types and cut-off frequencies. The QRS detection section must be executed before the classification and average waveform. After determining the QRS complex location, users can remove or add a heartbeat if there is any obvious misdetection. Then the system is ready to run classification and averaging waveform. After classifying all heartbeats, it indicates the heartbeat type on the plotting area and generates a summary window to include the amount of each type. Also, users are able to change the type of a selected heartbeat by simple pressing keyboard. In the averaging waveform, it averages the selected signal interval and results as one-second interval. Additionally, it figures out the feature’s values of the averaged waveform on the calculation bar.
User Interface
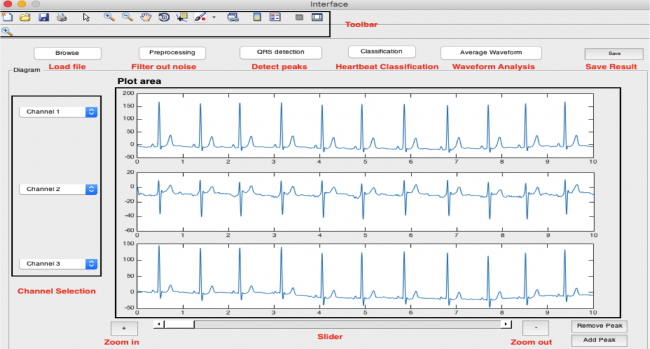
In the project, the build-up and programming of the user interfaces are based on the GUI. The following figure demonstrates the main window of the program, and there are 10 push buttons, which include Browse, Preprocessing, QRS detection, Classification, Average waveform, Save, Plus, Minus, Remove peak and Add peak, three pop-up menus that are used for the selection among three channels, and one slider that locates on the bottom of the window. In additional, there are a plotting area that contains three axes on the middle of the window and a tool bar on the top of the window.
Preprocessing
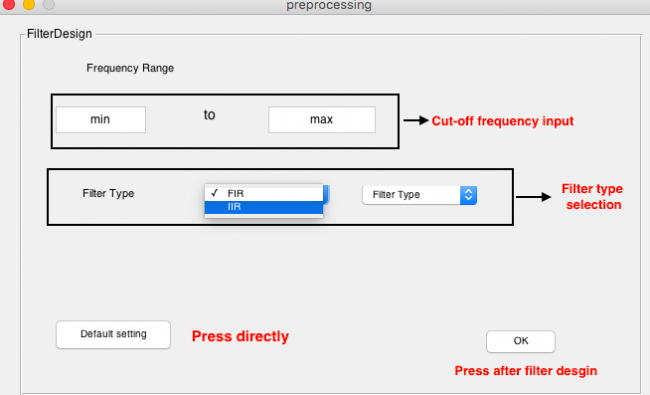
The aim of the pre-processing is that demonstrate the ECG signal without noise in the main window. There is a pop-up window after the pre-processing button had been pushed, which contains tow main part defaulting setting and optional setting.
In the default setting, a low pass filter that the normalised pass band frequency is 0.14, the stop band frequency is 0.2, the pass band ripple is 0.8 dB and the stop attenuation is 4 dB is used. The optional setting includes filter range set and filter type choice, is used for that the user can design a filter by own. There are two main filter types, FIR and IIR. IIR includes Bessel filter, Butterworth filter, Chebyshev type I filter, Chebyshev type II filter and Elliptic filter. The FIR design consists on different order, this program provides three different orders, includes 12, 34, and 48.
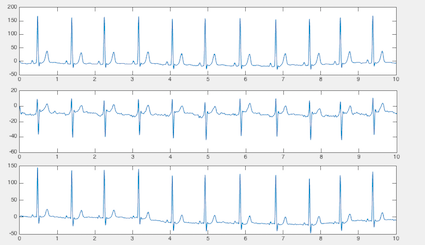
After the default setting push button has been pushed in the pre-processing window, the plotting area that located at the interface window can display the first 10s ECG signal without the disturbance.
QRS detection
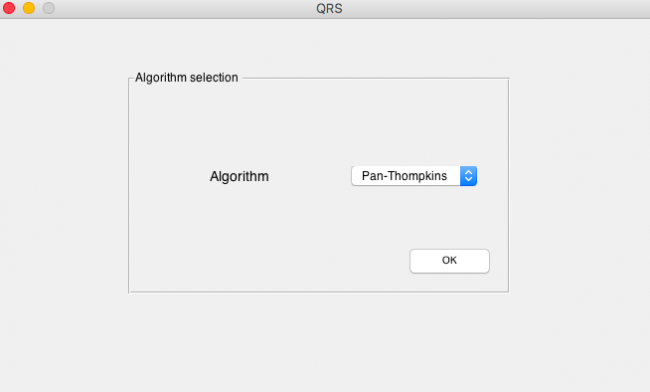
The purpose of this part is that detects the QRS complex of the ECG signal and labels it on the waveform diagram. QRS complex are the peaks of the ECG waveform. The following figure is the window of the QRS function, in this function, we choose the Pan-Tompkins algorithm [3] to find the location of the QRS point, and label the point in the axes of the main window.
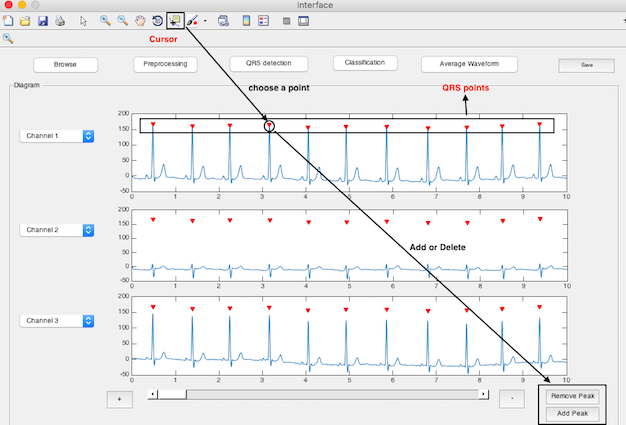
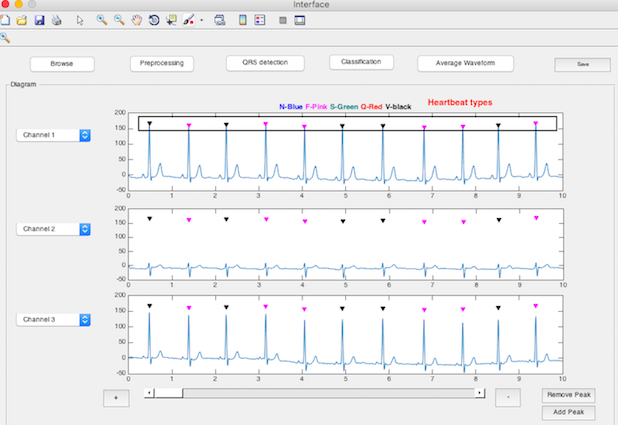
There are two buttons, remove peak and add peak at the right side bottom of the main window, which are used for delete the selected QRS point and add the red label to represent the QRS point in the specified location. In remove peak function, using cursor to select a QRS point, and return the coordination of the point. After press the Remove peak button, the location will be deleted from QRS location array and disappear on the diagram. In the add peak function, similarly, using cursor to get the coordination of the point where the use want to add a QRS point, then the coordination of the pint will be added to the QRS location array and plot a new red label in the location. The following figure shows the first 10s diagram of the QRS points and ECG waveform and introduces how to remove or add peak.
Classification
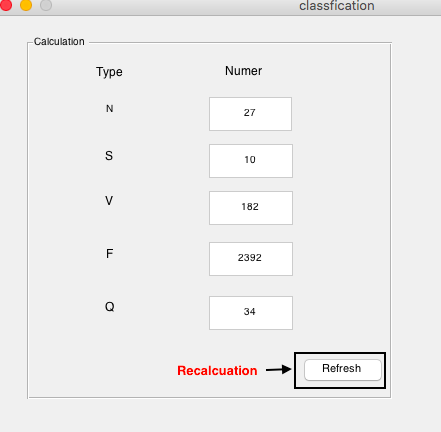
The classification push button is used to classify the heartbeat into five types and label them in the diagram with different colour, and this function is complied after the QRS detection. In additional, there is a pop-up window that calculates the number of the heartbeats of the five types and the heartbeat type can be modified through the keyboard. There are normal beat (N), which contains any heartbeat nor in the S, V, F, or Q classes, supra-ventricular ectopic beat (S), ventricular ectopic beat (V), fusion beat of ventricular and normal beat (F) and unknown beat (Q).
In the classification function, there are five different arrays to save the location of the heartbeats of the five types. The types can be labeled on the axes of the main window depend on the location array. Blue means the heartbeat is N type, pink represents F type, the colour of the S type is green, black means the heartbeat is V type and red represents Q type.
There is a Key press function in the Classification, which is used to change the type of the heartbeat manually through the keyboard. Using the cursor to find the location of the point, then press cursor again, and input the character of the type, the location of the point will move from the correspond type location array to the new location array and the colour of the point will changed to the correspond colour with the new type. If press the refresh button on the classification window, the calculation values will be recalculation
Modify the type procedures: Cursor-Select the point – Cursor – keyboard input
Average Waveform
There are two main parts in the average waveform, average waveform demonstration and waveform analysis.
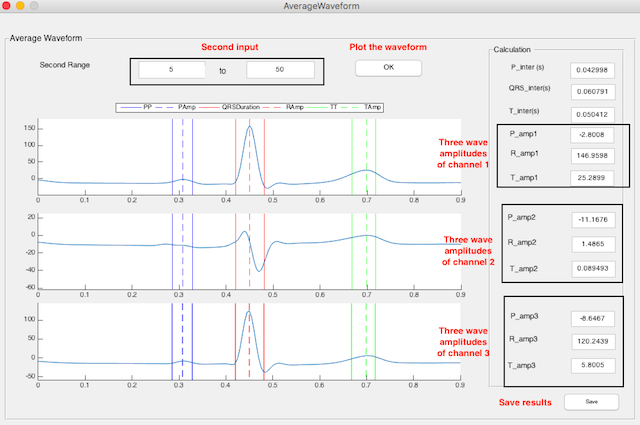
At top of the average waveform window, there is a second range input. The three axes will demonstrate the corresponding waveform according to the second input. The right side of the window is the calculation table summary, which displays the value of P wave interval, QRS complex, T wave interval of the three channel, and P wave amplitude, R wave amplitude and T wave amplitude of each channel. There are 9 draggable lines that assist to get the X and Y values of the selected point, and there are moving at same time for three axes. In additional, the values of the calculation refresh automatically with the moving lines.
The above figure is the average waveform window, we can see that the two blue real lines calculate the interval value and blue dotted line represent the amplitude of the P wave, two red real lines calculate the value of QRS complex and red dotted line represent the amplitude of the R point, and two green real lines calculate the value of the T wave and red dotted line represent the amplitude of the T wave.
The save button at the right bottom of the window is used to save the seconds input and all calculated values.
Team Management
Task Allocation
The entire project can be divided into two main components, which are interface and signal processing. Yunying Zuo is responsible for the interface part that includes the interface design and implementation. Siyuan Wen is in charge of the signal processing section. We would spend the most of time on these two tasks. For the rest of tasks, such as system optimization, entire system testing and a users’ manual construction, we are going to work together, because it will need the knowledge from both of the main sections.
To allocate tasks in this way, it ensures that each team member can undertake a similar amount of workload in this project. It also requires cooperation between each other’s, which can help developing this project efficiently.
Management Strategy
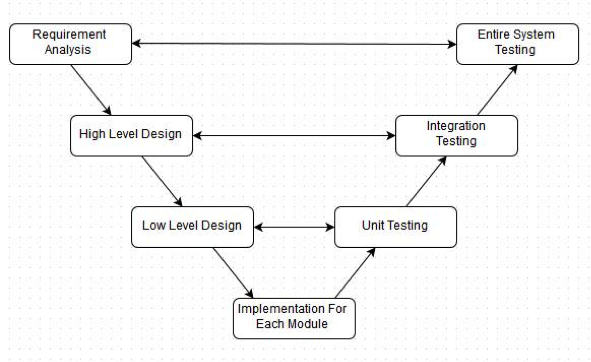
Generally, the entire project is divided into two main sections, such as interface and signal processing. And it breaks each section into small modules, which will be designed and constructed separately. Also, some unit test cases are supposed to be set up following each module. After finishing all of the modules, it will integrate the final system. At last, it will process the tests and optimization for the entire system. To consider this strategic approach, a V shaped model shown below is suitable in this project.
As shown in the figure above, it needs to analyse the requirements of this project at the first stage. It must clearly state the scopes that need to be achieved in this project and the features that should be realised in the final deliverable. Then all group members are supposed to work together and make high-level design for the entire system. This design will be presented, as forms of diagrams and words and it will be reviewed at the final stage of this project. Low-level design is the next event where group members will build their own module’s design individually. The corresponding low-level design should be followed as implementing each module and it can be adjusted slightly if there is any innovation during the implementation. After finishing each module, the module creator will do unit testing and verify whether the outcome is reasonable in terms of the related module design. In the other word, it will be applied evaluation mentioned in the Approaches section. The integration testing will be proceeded afterwards. In this stage, the project group will compare the results of integration with the high level design. The final stage is system testing. The entire system performance should be checked according to the requirements analysis section. The scopes identified previously must be realised.
To manage the project effectively, it sets up a weekly meeting that gives the project group an opportunity to meet with the project supervisor. For each meeting, the project group will prepare a meeting agenda that summary the work has been done during the last period. Any technical queries about this project should be raised up in the meeting, and it is a good chance to get feedback and support from the supervisor. After meeting, the meeting minutes will be generated, which contains meeting summary, actions in the following week and expectation from the supervisor.
Decisions and Justifications
Processing speed
The input ECG signals are long-term ECG, which usually have a 24 hours recording period. There are over 80 thousand heartbeats stored in the ECG signal files. Due to that fact, the project has to consider the running speed of each module. In the pre-processing module, all of the data were processed in one time currently. It took 4 seconds to pass all of the data through the filter, and then the filtered data has been stored in a new integer array. As plotting the waveform in the interface’s plotting area, it only plots the current displaying range rather than plotting the entire waveform. The time taken to plot the entire waveform is about 30 seconds, which is essentially inefficient. By using the current method to process and plot the ECG signal, the program is running smoothly with a slight waiting time.
In the QRS complex detection module, it is known that there are a series of operators. Especially in the selective operator, it contains 3 ‘for loop’, which dramatically increases the processing time. It takes around 5 minutes to complete. To optimize the processing speed, the project group decide to detect the QRS complex only if this time range of signals are displaying. Furthermore, the location of the detected QRS complex has been recorded in a global variable, which keeps being updated once new QRS complexes are found. It is supposed to be aware of that the data stored the location array should be in sequence from small values to large values. That needs sorting skills to address that problem. By applying this method, it would not take too much time to process signals and it would not repeat applying the QRS complex detection algorithm for the detected QRS complexes. Also, the QRS complex location information can be revised anytime. That would be helpful for the further data analysis, such as automated classification and waveform averaging.
As calculating the local average RR interval, it adds up a new RR interval and dismisses the oldest RR interval, so that it would essentially slow down the operating speed since there are approximate 90,000 heartbeats processed. To solve this problem, it creates 10 RR interval arrays. The first array is the original array that contains the RR intervals for the entire recording. Then it shifts the original array to the right by one bit to get the second array and repeats this until all of the 10 RR interval arrays are determined. After that, it fixes up empty bits by 0, sums up the 10 RR interval arrays and cuts out 10 bits at the beginning and end. Therefore, the local average RR intervals are known except for the local average RR interval of first five heartbeats and last five heartbeats, where the first five heartbeats have the same values and the last five heartbeats have the same values. That could be calculated independently. By using this strategy, it can avoid using ‘loop’, so that the operating time for local RR interval feature extraction is negligible.
Method adjustment
The original paper of Pan-Tompkins talks about the algorithm about detecting QRS complex for the real-time ECG signals. However, the input signals are pre-recorded in this project. In the selective operator, the project group made an adjustment to enable the algorithm being suitable for the pre-recorded ECG signals. Firstly, it was about the overall peaks detection for the integrated waveform, we didn’t find all of the peaks appeared during the entire period. Instead, we picked out the location ranges of the ladder shape peaks and found the peaks only in these ranges, which filtered out the majority of noise peaks. And then these peaks were applied by the thresholds to do further filtering. This reduced the possibility of missing signal peaks. Secondly, the coefficient in the formula that was used to determine the values of the thresholds has been modified. In the original paper, it said the coefficient is 0.2. The project group decided to change it to 0.35, because the lead 2 in the provided ECG signal has relatively high T peaks, which reach approximately 50% of the R peaks. Therefore, the coefficient of the threshold need to be adjusted to make sure that it can filter out the T peaks in lead 2.
The algorithm used to develop the classification feature has modified according to the demands of this project. In the original paper [10], it evaluates the performance of each classifier independently and pick out the one has the highest accuracy and the best sensitivity. Additionally, to have more classifiers options, it develops 4 more classifiers that are combination of multiple feature sets. Finally, it trusts the classification results of the optimum classifier. In our algorithm, it chooses to consider about all 8 classifiers’ classification results comprehensively for each heartbeat. It estimates all features of a heartbeat such as RR interval, heartbeat interval and morphology feature, where the results are more likely to be convincible than concluding the results on the basis of one or two features only. Although the performance of our algorithm e.g. accuracy, sensitivity and positive predictivity is as well as the algorithm introduced in the original paper, it has a better capability to deal with a variety of ECG signals like the noisy signals.
Project Results analysis
In this project, we have developed a user-friendly software tool that not only can be operated by professional medical personnel but also patients. Generally, all objectives specified in Section 3 including noise filtering, QRS complex detection, heartbeats classification and waveform averaging have been achieved with a high quality and these functions have been installed in the software tool.
The QRS complex detection and heartbeats classification are the major modules while the performance of these two modules are the key attributes considered to decide the quality of this software tool. The algorithm implemented in the QRS complex detection module is based on the Pan-Tompkins algorithm and it reaches the accuracy of 89.45%. There is a software tool called multifunction cardiogram [5] that has been proposed and tested already. This tool uses Applied Systems Engineering principals and it is able to achieve 92% accuracy as detecting heartbeats automatically. Therefore, the algorithm developed in this project is comparable with the existed method used in practice. As working on the QRS complex classification module, it adopts the Linear Discriminant Analysis function to construct classifiers in Matlab. The accuracy values of the four beat classes (N, S, V and F) are 77.60%, 93.36%, 96.23% and 83.73% in sequence, while the algorithm introduced in the reference paper [4] gains an overall accuracy of 86.20%. The sensitivity values of the class S, V and F are 67.45%, 80.72% and 86.60% against with 77.6%, 76.4% and 87.0% in the reference paper. Based on these comparisons between the algorithm used in this project and the algorithm being applied in practice, it could make a conclusion that the performance of the QRS complex detection algorithm is acceptable.
At this stage, the accuracy and sensitivity of the automatic analysis in this project are not as good as existed ECG automatic analysis software and proposed algorithm, but its interface is more likely to be simpler. And customers would be able to use it directly just by following a brief instruction. Furthermore, the software tool developed is able to work as a fundamental structure, where more functions could be developed and installed upon the software tool in the future.
References
[1] ECG test [online]. Available: http://www.betterhealth.vic.gov.au/bhcv2/bhcarticles.nsf/pages/Electrocardiogram?open.
[2] L. J. Acierno, “The history of cardiology: Men, ideas and contributions,” Informa Healthcare, 1994.
[3] J. Pan and W. Tompkins, 'A Real-Time QRS Detection Algorithm', IEEE Transactions on Biomedical Engineering, vol. -32, no. 3, pp. 230-236, 1985.
[4] P. Chazal, M. O’Dwyer, and R. Reilly, “Automatic Classification of Heartbeats Using ECG Morphology and Heartbeat Interval Features”, IEEE trans Biomend.Eng, July 2004, no. 7, vol. 51.
[5] "Multifunction cardiogram", wikipedia, 2015. [Online]. Available: https://en.wikipedia.org/wiki/Multifunction_cardiogram#Function.
