Projects:2016s1-102 Classifying Internet Applications and Detecting Malicious Traffic from Network Communications
Contents
Project Team
Karl Hornlund
Jason Trann
Supervisors
Assoc Prof Cheng Chew Lim
Dr Hong Gunn Chew
Dr Adriel Cheng (DSTG)
Introduction
The project aims to use machine learning to predict the application class of computer network traffic. In particular, we will explore the usefulness of graph based techniques to extract additional features and provide a simplified model for classification; and, evaluate the classification performance with respect to identifying malicious network traffic.
Objectives
- Implement a supervised machine learning system which utilises NetFlow data and spatial traffic statistics to classify network traffic, as described by Jin et al. [12] [18] [19].
- Achieve an appropriate level of accuracy when benchmarked against previous years’ iterations of the project and verify the results of Jin et al. [18].
- Evaluate the effectiveness of using spatial traffic statistics, in particular with respect to identifying malicious traffic.
- Explore improvements and extensions on the current method prescribed by Jin et al. [12] [18] [19].
Stage 1: Bootstrap
The bootstrap stage begins by constructing the edge level features to be used as inputs to the supervised machine learning system. Edge level features are built from the flow level features of the NetFlow data, as part of the process of building the Traffic Activity Graph (TAG).
1. Constructing the Traffic Activity Graph
The TAG is constructed as follows:
(1) Map each unique host in the network to a node in the TAG.
(2) For each flow in the network, create a directed edge between the respective nodes in the TAG, corresponding to the source and destination hosts of the flow. Assign the label of that flow as an edge attribute; do the same for duration, packets, and bytes.
(3) Calculate two additional edge attributes:
mean packet size = bytes/packets
mean packet rate = packets/duration
(4)For each set of edges with both nodes in common, perform the following simplification:
Assume x edges e_1,e_2,…,e_x =(u,v).
Create a new undirected edge e_(x+1),and assign it the following attributes:
label(u,v) ∶= the most common application class label among e_1,e_2,…,e_x.
minduration ≔ minimum duration among e_1,e_2,…,e_x.
minpacket size ∶= minimum mean packet size among e_1,e_2,…,e_x.
minpacket rate ∶= minimum mean packet rate among e_1,e_2,…,e_x.
maxduration ≔ maximum duration among e_1,e_2,…,e_x.
maxpacket size ∶= maximum mean packet size among e_1,e_2,…,e_x.
maxpacket rate ∶= maximum mean packet rate among e_1,e_2,…,e_x.
bytes_uv ≔ sum of bytes flowing from u to v.
bytes_vu ≔ sum of bytes flowing from v to u.
symmetry ∶= min((bytes_uv)/(bytes_vu ),(bytes_vu)/(bytes_uv ))
Remove edges e_1,e_2,…,e_x from the TAG.
(5) Remove any loops (edges which leave from, and enter the same node) from the TAG.
The following set of edge level features are used for bootstrap classification:
- Min Packet Size
- Max Packet Size
- Min Duration
- Max Duration
- Min Packet Rate
- Max Packet Rate
- Symmetry
2. Optimal Bootstrap Feature Selection
From the given edge level features above, to find the optimal set of features to be used within the bootstrap classifier, a brute force (trial and error) method was used. The method is outlined below:
1.Use all x available features in ML algorithm and record bootstrap results
2.Test and record all combinations of x-1 features
3.Evaluate bootstrap results from step 2 and compare which feature removal results in the largest decrease in accuracy
4.Repeat step 2 for x-2 combinations of features but retain the features that contribute the most to the final bootstrap accuracy and remove features that have little contribution to final accuracy
5.Repeat reduction in x feature combinations until accuracy results do not improve.
The resulting optimal set of edge features is:
- Min Packet Size
- Max Packet Size
- Min Packet Rate
- Max Packet Rate
- Symmetry
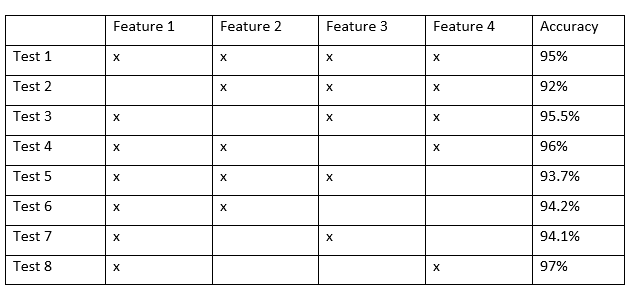
In the example above, from test 2-5, the accuracy shows that Feature 1 & 4 has a significant impact in the reduction of bootstrap accuracy, meaning that keeping the features are essential to a high accuracy. Thus in test 6-8, by retaining Feature 1 (which resulted in the largest decrease in accuracy), by testing different feature combinations with two features, the results verify that Features 1 & 4 are the most important features to generate the highest bootstrap accuracy.
3. Tree Based Classifier
The project will used a Random Forest Classifier in R, such that results can be directly compared to those form the 2014 project.
There are two main parameters to optimise the Random Forest algorithm:
ntree ≔ Number of decision trees to grow
nodesize ≔ Size of terminal node or the depth of the tree
The optimal nodesize was found by an iterative brute-force method.
Assume N features to be used.
Try nodesize = √N.
Then try nodesize = 2k√N, and nodesize = √N/(2k), k=1,2,3…
The value which led to the highest classification accuracy in the tests was chosen as the optimal parameter value.
To settle on a value for ntree, again an iterative process was used. By starting with an arbitrarily small value, and observing the out-of-bag error rate (OOB) as ntree is increased, a value for ntree was chosen as the point where the OOB plateaus. (Note that the out of bag error rate refers to the prediction error of ML algorithm.)
The parameter values to be used for the bootstrap classifier are as follows:
ntree = 20
nodesize = 10
Stage 2: Calibration
In the second stage of the system, a graph-based approach to extract spatial traffic statistics from the initial application label predictions will be used. These spatial traffic statistics will then be used as features in a second iteration of ML classification, effectively calibrating the initial classification.
1. Creating Vertex Histograms
In this step spatial traffic statistics are extracted, and the information stored in a histogram as a node attribute.
Assume N application classes. Number each class 1 to N.
Let deg_k(v) be the degree of a node v only counting edges with application class k, k ∈ [1,N].
Let deg(v) be the total degree of a node v.
Let deg ̂_k(v) be the normalised degree, deg ̂_k(v) = deg_k (v)/deg(v)
For each node v in the TAG:
Create a histogram h with N elements,such that h[k] = deg ̂_k (v)
Assign this histogram as a node attribute to v
2. Creating Spatial Traffic Statistics Features
The spatial traffic statistics to be used as features in the calibration stage are extracted from the vertex histograms as follows:
Assume N application classes.
For each edge e = (u,v) in the TAG:
Let h_u be the histogram of vertex u, h_v the histogram of vertex v
Assign edge attributes x_1, x_2,…, x_n, x_deg, y_1, y_2,…, y_n, y_deg to e such that:
x_k = h_u[k], y_k = h_v[k], k ∈ [1,N]
x_deg = deg(u), y_deg = deg(v)
For N application classes, this will result in 2*(N+1) features to be used for calibration classification.
3. Performing Calibration
A Random Forest classifier will also be used in the calibration stage. Using the same process as described in section 4.2.3 the following parameters are to be used for the calibration classifier:
ntree = 10
nodesize = 20
The output will be a set of calibrated edge application labels, which are a final estimate as to the application class responsible for the majority of the network traffic between two hosts in the network.
4. Mapping Edge Predictions to Flow Predictions
As the system classifies edges, it is of interest to know how accurately these predictions classify flows. The following 1..N mapping from edge labels to flow labels is used to determine this:
For each edge e = (u,v) in the TAG:
Let L_edge(e) be the application class prediction for edge e.
Let L_flow(f) be the application class prediction for flow f.
Assign L_flow(f) ← L_edge(e) ∀ f = (w,z) |[w∈{u,v} ⋀ z∈{u,v}]
Preliminary Investigation
This section aims to answer the question ‘how accurately can a single application class label represent the traffic between two hosts in a network?’.
1. Distribution Plots
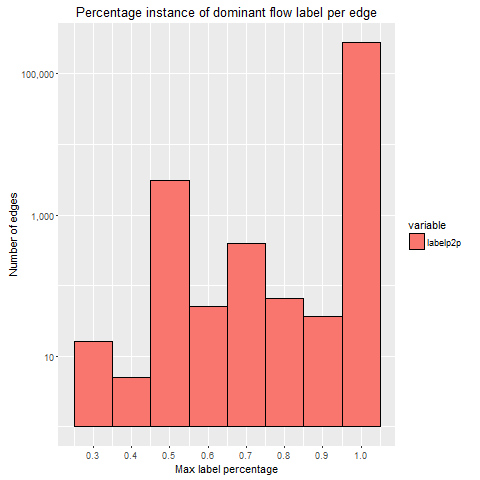
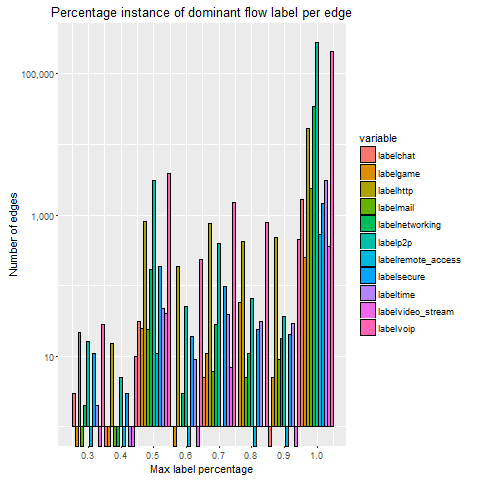
In order to represent the distribution plots of each dataset, several histograms are created. The histograms illustrate the majority (dominant) class type per edge for a particular dataset capture. The measures of the histogram are as follows:
- Independent variable is the percentage dominance of a class per edge.
- Dependent variable is the measure (occurrences) of a particular percentage dominant class type per edge.
These histograms are calculated by using the IP addresses from the NetFlow data for each dataset and also use the ground truth label for each individual flow. These histograms demonstrate the majority confidence for each edge as a result.
By observing the log scale graphs, there is an obvious concentration of flows in the 100% bin. The peak in the 50% is likely due to the fact that two application classes, which are both a 50% majority, could both be considered the ‘dominant’ class. This sparked interest into how often a 50/50 split among application classes would occur, which led to the following investigation into how many edges and flows belonged to this 50% majority category.
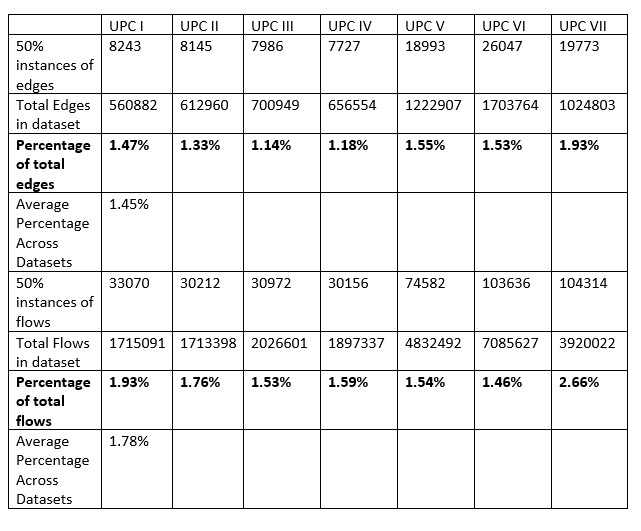
The table above represents the number of occurrences where there is a 50/50 ratio of classes per edge/flow. The 50/50 ratio per edge represents the number of instances where an edge consists of two application classes with the same number of flows along the edge, while the 50/50 ratio for flows is the total number of flows that occur within all 50% majority edges. Also included is the total number of edges and flows per capture. The number of instances of a 50% majority is then calculated as a percentage of total edges/flows.
The results from the graphs above, show that at least 90%+ of flows with an edge consists of 1 dominant class type. In particular, for 50% dominant instances per edge and per flow, instances are low for each dataset (1.45% of all edges and 1.78% for all flows).
2. Confusion Matrix
A second test supported the equivalency between flow labels and edge labels; it determines an upper bound for the accuracy achievable mapping edge labels to flow labels by emulating the scenario where the calibration stage produces an optimal set of edge labels.
An optimal set of edge labels was constructed as follows: for each edge, select the most commonly occurring ground truth label among the relevant flows as the edge label. Then, map the set of optimal edge labels back to the relevant flows to create a set of derived flow labels. By comparing the original ground truth labels to the derived flow labels in a confusion matrix, one can determine how often flows do not belong to the majority label for that edge.
These results support the statement that: by weighted average, 98.38% of flows between a given two hosts are of the same application class. The implication of this, is that there is on average an upper bound of 98.38% regarding the accuracy achievable using this method. Given that this project is benchmarked against results of approximately 92% accuracy [4] [19], the preliminary investigation suggests that it is possible to surpass this benchmark with the proposed method.
Results
System A surpassed benchmarking against both the 2014 results [4] and those reported by Jin et al. [19]. It did however, perform the worst of the four systems tried in terms of both flow and edge classification accuracy.
The advantage of System A is that it does not rely on information such as protocol or port numbers, while still achieving relatively high classification accuracy of both edges and flows. System A is the best example of the usefulness of the calibration stage, as average flow classification accuracy improved by 3.9%. Interestingly, the improvement to edge classification accuracy was only 1% following the calibration stage. This indicates that the edges re-classified by the calibration stage are flow dense, resulting in the inflated improvement for flows.
System B improved the flow classification accuracy for both stages 1 and 2. This indicates that flow level features such as ports and protocol can improve classification accuracy. Analysis of the calibration stage results is interesting however, as flow accuracy improves by approximately 1.2%, whereas edge classification accuracy is effectively unchanged. This indicates that while System B not does classify edges better than System A, the edges it does classify correctly tend to be more flow dense. The key outcome from System B is that by improving the classification accuracy in the bootstrap stage, a follow-on effect can be observed in the calibration stage leading to higher overall flow classification accuracy.
System C produced the best edge and flow classification accuracy. This is likely due to the broad feature set used in the bootstrap stage, which utilised both flow and edge level features. Unlike the other systems, the calibration stage for System C resulted in an average decrease in flow classification accuracy. This suggests there may be some upper bound as to the usefulness of spatial traffic statistics, beyond which their use degrades classification accuracy.
The key outcomes from System C is that edge and flow level features have respective benefits for classifying particular classes, and therefore by using both sets of features, higher classification accuracy can be achieved; and, there may be an upper bound to the usefulness of spatial traffic statistics.
System D performed slightly better than Systems A and B, but worse than System C. Given the increased complexity introduced by running two bootstrap classifiers, and the subpar performance when compared to System C, there is seemingly no reason to recommend the use of System D.
Conclusion
We make the following recommendations:
- Network traffic can be modelled as a simple graph without considerable information loss.
- To maximise classification accuracy (of flows or edges), a combination of flow and edge level features should be used.
- Spatial traffic statistics and the calibration stage can be used to improve on initially poor predictions in the range of 80-94% accuracy. This, for example, allows for high classification accuracy to be achieved without the use of port numbers.
- Spatial traffic statistics should not be used to classify rare classes – or more specifically, classes which are susceptible to the effect of smoothing.
References
[1] P. Casas, J. Mazel, and P. Owezarski. MINETRAC: Mining Flows for Unsupervised Analysis & Semi-Supervised Classification. 2011. pp. 87-94.
[2] L. He, C. Xu, and Y. Luo. vTC: Machine Learning Based Traffic Classification as a Virtual Network Function. University of Massachusetts Lowell, 2016.
[3] RStudio. [Online] [Cited: 20 10 2016.] https://www.rstudio.com/.
[4] B McAleer, V. Cao, T. Moschou, G. Cullity. Development of Machine Learning Techniques for Analysing Network Communications. University of Adelaide, 2014.
[5] Y. Lu, J. Wang, T. Pham, J. Raoux. Detecting Cyber Malicious Command-Control (C2) Network Traffic Communications. University of Adelaide, 2015.
[6] The R Project for Statistical Computing. [Online] [Cited: 20 10 2016.] https://www.r-project.org/.
[7] J. Kurose and K. Ross. Computer Networking: A Top-Down Approach. Pearson, 2013.
[8] Cisco. IOS NetFlow. [Online] Cisco. [Cited: 18 04 2016.] http://www.cisco.com/c/en/us/products/ios-nx-os-software/ios-netflow/index.html.
[9] Internet Engineering Task Force. IPFIX Charter. Internet Engineering Task Force, 2001.
[10] M. Joshi, R. Agarwal, and V. Kumar. Mining needle in a haystack: classifying rare classes via two-phase rule induction. 2, ACM SIGMOD, 2001, Vol. 30, pp. 91-102.
[11] I. Witten, and E. Frank. Data Mining: Practical Machine Learning Tools and Techniques. 2. Morgan Kaufmann, 2005.
[12] Y. Jin, E. Sharafuddin, and Z. Zhang. Unveiling Core Network-Wide Communication Patterns through Application Traffic Activity Graph Decomposition. University of Minnesota, 2009.
[13] S. Theodoridis and K. Koutroumbas. Pattern Recognition. Academic Press, 2009.
[14] S. Garcia, M. Grill, J. Stiborek, and A. Zunino. An empirical comparison of botnet detection methods. Czech Technical University in Prague, 2014.
[15] V. Carela-Español, P. Barlet-Ros, A. Cabellos-Aparicio, J. Solé-Pareta. Analysis of the impact of sampling on NetFlow traffic classification. Universitat Politècnica de Catalunya, 2010.
[16] T. Bujlow, V. Carela-Español, and P. Barlet-Ros. Independent comparison of popular DPI tools for traffic. Universitat Politécnica de Catalunya, 2014.
[17] K. McCarthy, B. Zabar, and G. Weiss. Does Cost-Sensitive Learning Beat Sampling for Classifying Rare Classes? New York : UBDM '05 Proceedings of the 1st international workshop on Utility-based data mining, 2005. pp. 69-77.
[18] Y. Jin, J. Erman, N. Duffield, P. Haffner, S. Sen, Z. Zhang. A Modular Machine Learning System for Flow-Level Traffic Classification in Large Networks. 1, ACM Transactions on Knowledge Discovery from Data, 2012, Vol. 6.
[19] Y. Jin, N. Duffield, P. Haffner, S. Sen, Z. Zhang. Inferring Applications at the Network Layer using Collective Traffic Statistics. University of Minnesota, 2010.
[20] M. Iliofoto, H. Kim, M. Faloutsos, M. Mitzenmacher, P. Pappu, G. Varghese. Graph-based P2P Traffic Classification at the Internet Backbone. University of California, Riverside, 2009.
[21] P. Siska, M. Stoecklin, A. Kind, and T. Braun. A Flow Trace Generator using Graph-based Traffic Classification Techniques. University of Bern, 2010.
[22] W. Turkett, E. Fulp, C. Lever, E. Allan. Graph Mining of Motif Profiles For Computer Network Activity Inference. Wake Forest University, 2011.
[23] R. Milo, S. Itzkovitz, N. Kashtan, S. Shen-Orr, U. Alon. Network Motifs: Simple Building Blocks of Complex Networks. 298, Science, 2002, pp. 824-827.
[24] L. Bilge, D. Balzarotti, W. Robertson, E. Kirda, C. Kruegel. DISCLOSURE: Detecting Botnet Command and Control Servers Through Large-Scale NetFlow Analysis. 28th Annual Computer Security Applications Conference, 2012.
[25] B. Stone-Gross, C. Kruegel, K. Almeroth, A. Moser, E. Kirda. FIRE: FInding Rogue nEtworks. '09 Annual Computer Security Applications Conference, 2009, pp. 231 - 240.
[26] Google. Google Transparency Report. Google. [Online] [Cited: 19 04 2016.] https://www.google.com/transparencyreport/safebrowsing/diagnostic/.
[27] Alexa. [Online] [Cited: 19 04 2016.] http://www.alexa.com/topsites/.
[28] igraph. [Online] [Cited: 20 04 2016.] http://igraph.org/.


