Projects:2016s1-175 Environment Exploring Based on Inertia Measurement Unit and Computer Vision
Content 1.Introduction
  1.1 Team Members
  1.2 Supervisors
  1.3 Tech advisors
  1.4 Project description
2.Hardware Overview 3.Software Overview
Contents
1. Introduction
1.1 Team Members
     Junyu Zhou
     Dongli Cao
1.2 Supervisors
     Prof Peng Shi
     A/Prof Cheng-Chew Lim
1.3 Tech Advisers
     Dr. Hongjun Yu
     Dr. Zongrui Hu
1.4 Background:
An inertial navigation system INS is a navigation approach using computer console, motion sensors (accelerometers) and rotation sensors (gyroscopes) to continuously calculate via dead reckoning the position, orientation, and velocity of a moving object without the need for external references. [1] According to their outputs, being based on Earth gravity and movements of objects, they are adamant robust control method being used in marine, land even aerospace areas. This technology merely applies to military equipment and expensive applications like rockets from the 1960s. However, with the development of micro-electro-mechanical systems (MEMS), a current inertial measurement unit (IMU) is shaped subtle and cost very cheap nowadays. Therefore, it has been applied for civil use wildly. On the other hand, on account of the cost shortage of making an IMU, it presents bigger errors, which need be considered separately, commonly knowing as integration drift or accumulation errors. For this reason, it is necessary to combine this technology with other location technique such as computer vision(CV)and global positioning system (GPS). And for a robot system, it is usually to design them with inertial navigation technology and computer vision technology. It just likes animal who combines some of their sensors modalities like vision and balance motion system inner ears. [2] After all, this fusion method could lead to an error free estimation of the objects’ actual positions and velocities. This project was proposed to start our studies into inertial navigation system from designing a simple automatic guide robot with methods using computer vision and inertial navigation theories.
1.5 Project Scope:
As mentioned above, the inertial navigation technology is very popular currently. Particularly,the development of drone and automatic drive system promotes the demand of inertial navigation. This project follows this trend that it was aimed at designing a practical robot system by combination the technologies of CV and inertial navigation. This two-dimensional navigation system can be used to test and analysis common errors from different results. More specified targets of the project were: a) Constructing a robot plane with the ability to automatically arrive target; b) Designing a simple image process program to locate the robot position and attitude under supervision of camera; c) Developing a movement algorithm to enable the robot move diplomaticaly toward destinations; d) Establishing information communications among different equipment; e) Designing a specified navigation analysis algorithm to transfer the digital outputs into a 2D map figure; f) Designing a simply graphical user interface (GUI) for future control and test; g) Using effective project recording and management.
2. Methodology
This project constructed fundamental experimental facilities for the study of inertial navigation with a combination of hardware which reflects real situations of practical movement case. First of all, we did the simulation on Matlab based on a mathematical model of our future motor system. After that, we design several algorithms which can control the robot arriving specified targets. Before involving inertial measurement units, all information capturing are based on image process. Last but not least, introducing inertial navigation system enable us to compare these two results.
2.1 Simulation:
This section details the simulation we constructed on the Matlab. It is significant for the feasibility analysis that we can test different sample rates, motor speeds and practical errors through this simulation process.
2.1.1 Mathematical Model:
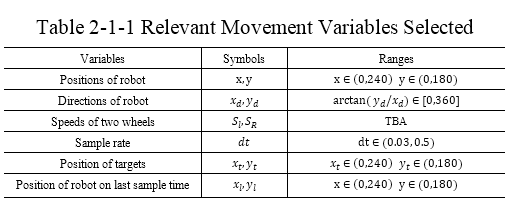
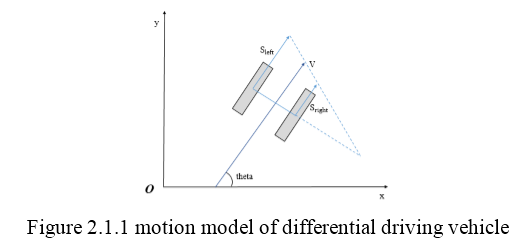
As this is a classical dual wheels motor system, we developed our mathematical model on account of experiences of ‘traditional’ approaches [3], which present a relationship between the deviation and angular velocity of the robot’s two wheels. Then we derived the final dynamic configuration. As the following table shows, we considered all relevant movement variables, which could be present as numbers and presupposed in ranges. Besides, these values are not all necessary for our rough simulation. Therefore, we had attempted to wipe out them as much as we can.
The positions of the robot can be obtained by image processing. They are stable and accurate enough. However, we cannot estimate the speeds of two wheels. Although the motors on the robot are controlled by Pulse-width Modulation (PWM), the mechanical outputs might still be inaccurate because of the force of friction existing inside the motor or on the surface. Therefore we could figure out the position and direction of next time according to the known current position of robot and accumulated speed of two wheels which including random errors.
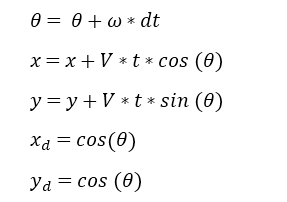
By analysis this mathematical model, we got the conclusion that the update variables equal to:
The sample rate is the most significant values that we need test through this simulation. Normally, the speed of image delivery between camera and computer can achieve 30 frames per second. But owing to the image process and algorithm calculation, we shall make sure the movement algorithm can still work under a lower sample rate. This part was discussed in section 2.3. And the mechanical outputs errors presented there as well.
2.1.2 Movement Strategy and Algorithm:
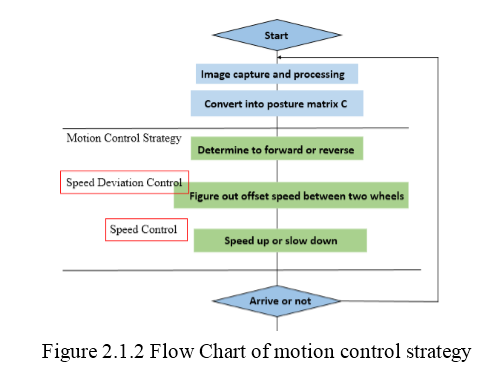
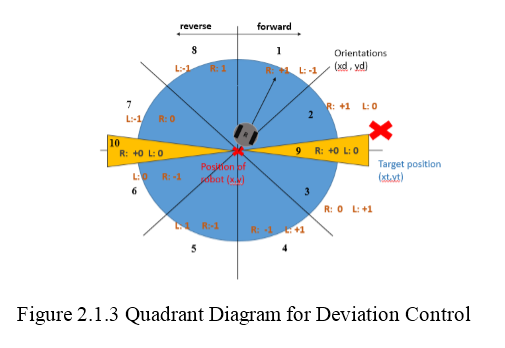
In this section, we were meant to design an algorithm to let the robot arrive destination by changing the speeds of two wheels. The ideal outputs are depending on current position, speeds of two wheels and target location. The algorithm uses robot position and target location as input to calculate how much that our robot needs to change. Moreover, the changing speed contains two parts. The first part, named speed control, use the distances changed and the distances between robot and destination to determine whether our robot needs to speed up or slow down. And the second part, named deviation control, which desires to control the speed difference between two wheels. These two parts are marked in the red box in following flow diagram. PS: the posture matrix C explained in section 2.2.
To be more precisely, the deviation control is based on the angle between robot’s orientation and the direction towards target position. The bigger the angle is, the bigger deviation our robot needs. Mathematically, we developed it into following diagram in which we set the robot’s orientation as a positive x axis. Then analyse the target position in 10 areas as below.
2.2 Matlab Simulation:
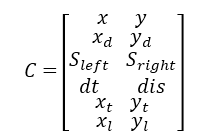
Within the Matlab software, we defined certain posture matrix C for simulation as follow:
Repeatedly, the meanings of these values, explained in section 2.1.1, are: a) (x,y)is the current coordinate of robot position; b) (x_d,y_d) is the direction vector of the robot, these two will obtained thought image processing; c) (S_left,S_right) are speeds of two wheels, which will not be directly used in the calculation but for reference; d) (x_t,y_t) is the coordinate of target position coming from direct input from the user by clicking on the screen; e) (x_l,y_l) represent the coordinate of a robot in last time (discrete). Basing on our algorithm and equation for the motion model of differential driving vehicle we could draw a series of trajectories map on the Matlab (code in an appendix). Here is an example of simulation. The big blue point there represents a target located at(125,130). The small circles with a line passing by its’ origin represent
2.3 Feasible Test:
According to our simulation program, we did a huge number of test on different starting points, destinations, random errors, load, image qualities and sample rate.
2.3.1 Sample Rate Test:
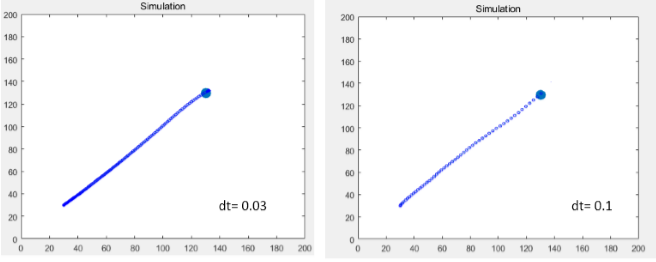
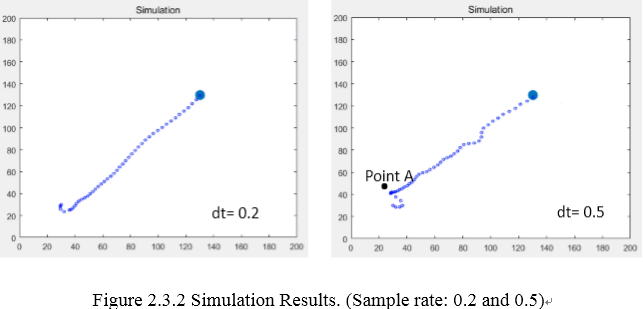
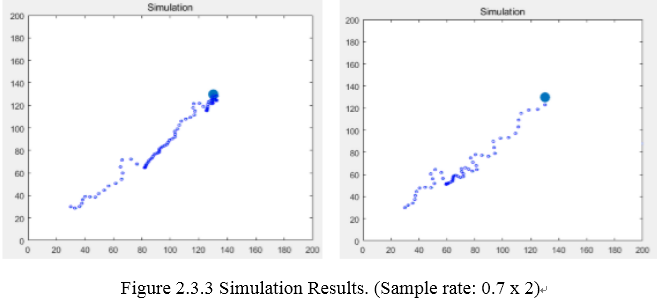
As the sample rate represents the frame number of our camera, it is the most significant one which will determine the performance of our system. Although our camera can provide 30 frames per second, our computer cannot deal with them that quickly. Therefore, we test a series number of sample rate in our simulation as the blow.
In this picture, the sample rates are set as 0.03 and 0.1, corresponding to 30 FPS (frame per second) and 10 FPS. Under this situation, the trajectories are very smooth without any bias. Because it can rectify the bias 30 times per second.
These two examples were running under sample rate at 0.2 and 0.5 separately. Case one is still good enough, but case two present a mistake curve in the beginning. Because when the robot just starts off, the vehicle speed is not big enough corresponding to the angular velocity brought by speed difference between two wheels. This big angular velocity leads hypercorrection at point A.
This two example shows two extreme situations which present a lot of hypercorrection. Above all, from the simulation, we verified our algorithm under an ideal environment. And the results indicate that the sample rate or image capture rate should no less than 0.5. However, there are some interference factors exist. Thus we should consider sample rate no less than 0.3 depending on practical test.
2.3.2 Load Test:
Apart from above sample rate test, we also tested the ability of robot motor. The result is not satisfied that the motor actually output nothing when the robot is expected to run in a low speed. The reason why is the motor need to overcome the frictional force, which it bigger than the rolling friction force, from a stationary state to motion state. For knowing this, we tested the robot with different speeds to see the minimum value it start to move. The value of motor speed is digitally distribute from -255 to +255. When the robot has no load, it start to move from +/- 50. When it equip a Wi-Fi board and a cover, it start to move from +/-70. Considering of this characteristic, we add another speed control program that will keep the robot start its motor output from 70.
2.3.3 Image Quality Test:
This test is actually progressed in a final section of project. The reason for doing so is that we find our program running too slow to support a good performance. One possible causes might be the operational capability of PC console we used (1.8GHZ) is not good enough to running our crude program which lack of optimization. Another cause might be the image quality we used in the beginning is too high, which is not that necessary. So, we count the time of process the image in the program. The result is the program provide more than 10FPS 760*480 process results without present any image output in the Graphical User Interface we designed. However, we prefer to present the real image our camera captured. So we reduced the image quality into 240*180 which permitting approximately 10 FPS, even if there are images present in the GUI.
3. System Structure
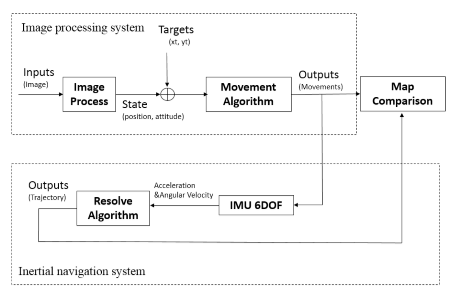
Our robot system consists of three parts. The motor part contributes to the robot movement basing on the origin functions provided by Arduino robot. The control part including the image process and movement algorithm manipulated by program compiling on computer software. As a transfer block diagram (figure 3.1) shows blow, the only input is a series of images captured by a camera. After image process, the image shall provide current position and attitude data which will contribute to movement decision-making combing with targets inputs set by a user. Under the control block diagram, there is a block flow indicate the IMU resolving.
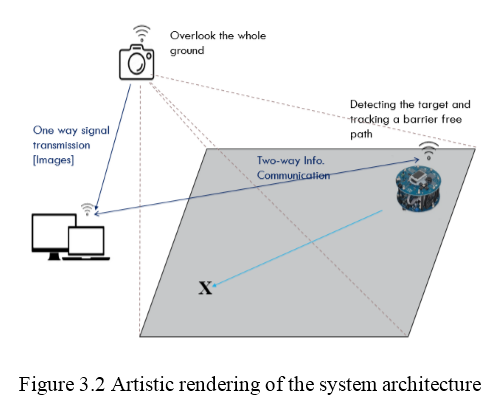
The communication part used for data delivery among web camera, motor system, and computer. Following is a sketch map to indicate how the system works corporately. There are two communication channels working in the system. According to above design, we determined our system architecture. We use a 1.5 square meter plane to simulate the unknown environment. The robot is expected to follow the command and go to the specified destination given by computer within this area. To support this function, we set a camera on the top to supervise this area. The image captured would be used to locate the robot’s position and attitude on the map. Moreover, during this process, an on-board IMU chip will feedback the movement data as well. Last but not least, the results will be compared and analysed.
3.1 Hardware:
This section details four main equipment we used to make our design into realistic. Mostly, this hardware are developed from prototypes integrated by the Arduino Company. And we choose other equipment from our daily using accessories. By doing so, we save project budget.
3.1.1 Arduino Robot:
Arduino is an open-source project that created microcontroller-based kits for building digital devices and interactive objects that can sense and control physical devices.[4] Their products are the most popular electrical devices to lead software engineers or students into a hardware area. Popularity is such a significant thing for us since we can find solutions and ideas from web forum when bugs and knots appear. However, the Arduino robot we inherited from the previous project is not that satisfied. First of all, the robot has two processors, one on each of its two boards. The Motor Board controls the motors, and the Control Board reads sensors and decides how to operate. Each of the boards is a full Arduino board programmable using the Arduino IDE.[4] It’s system sometimes halted when we were compiling a relative program, especially when we introducing float values. Its’ motor system cannot provide stable, accurate outputs simply corresponding to particular voltage inputs. Meanwhile, it outputs nothing under a low speed operation mode, which discussed in previous section.
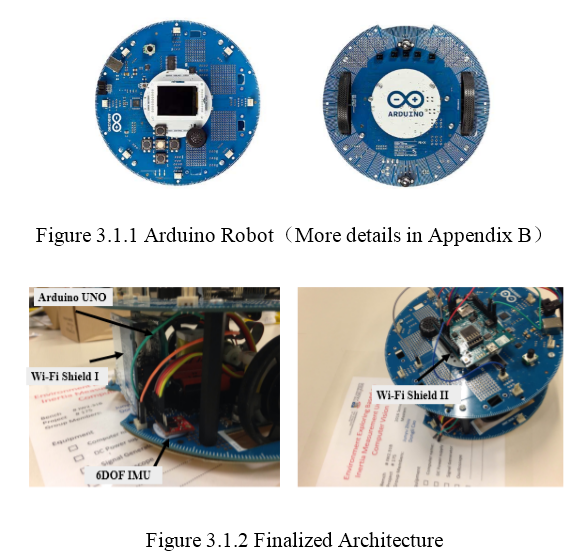
Figure 3.1.2 presents the final architecture of our robot. The left one view the back side of the robot where we set a 6 DOF IMU chip and another Arduino UNO and Wi-Fi shield to support it. The right picture view the robot from top where we can see a Wi-Fi shield place there to connect robot and our PC console.
4. System Structure
In this section, we develop two communication approaches to deliver our commands from PC console to Arduino robot and receive IMU outputs on software.
4.1 Movement Commands Delivery:
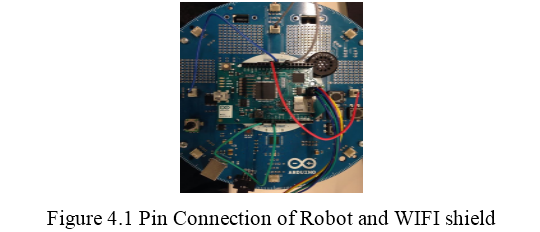
The on board Wi-Fi shield connected to the robot by the DuPont Lines. The connection details are shown below.
We compiling the program on the robot’s control board where it receives the data through User Datagram Protocol (UDP) from WIFI shield to specified pin. (PS: the program library needs to be changed depending on connection). Under this protocol, it provides checksums for data integrity and port numbers for addressing different functions at the source and destination of the datagram. It has no handshaking dialogues, and thus exposes the user's program to any unreliability of the underlying network and so there is no guarantee of delivery, ordering, or duplicate protection. The commands are compiled into two digital characters standing for different commands. And the program will recognize these two characters and transfer them into two values that wheels need to change. Besides, the frequency of receiving characters would equal to the frequency we process the images.
4.2 IMU Feedback Receiving:
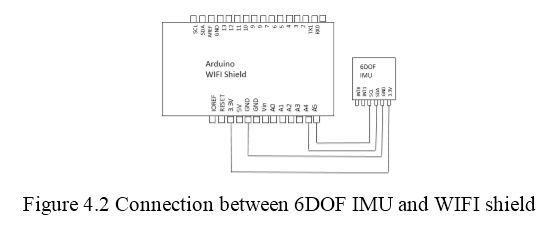
The 6DOF IMU was connect to the WIFI shield like following pin map.
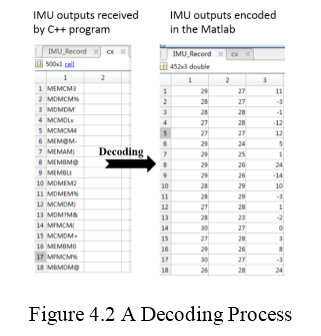
The IMU outputs communication is slightly complex than the former one. It uses UDP as well. However, the origin outputs of IMU are six 16bit integers which cannot be delivered through our WIFI shield. To solve this, we design a specified encode method to transfer these integers into characters. According to the demand of our 2D navigation system, which discussed in section 5, we merely need three raw numbers of IMU outputs. Moreover, our robot was not expected to run too fast. In another word, there is a smaller numerical range of IMU outputs on our robot. After testing, -4000 to +4000, which is more likely three 12bit integers, is enough to express all speed and velocity of our robot. Finally, we design a 90s decimal convert method to transfer these integers into two digital characters. The compiling method written in the Arduino program recorded in C++ Program Appendix. The decoding program is written in the Matlab program Appendix.
Originally, we were using the Matlab to directly receive the IMU outputs. But it performs badly with frequent package loss and delay. We cannot figure this out on the Matlab. So we edited another program based on C++, which can receive and save the IMU outputs in a text file. After this procedure, we can use a Matlab program read this file and plot the trajectory we need. The following figure indicate an example we received.
5. Principle Analysis
This section details the core technologies we used for navigation. Especially image process and inertial navigation. Although they are both very simple version of applications. It can still represent the core theory related.
5.1 Image Process:
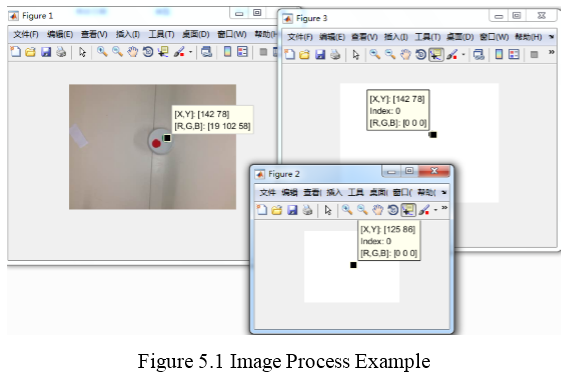
The expected outputs of image processing are a series accurate position and orientation statement of Arduino robot in vision. The continuous video inputs provide a high quality and a large number of the image. However, the frequency of image deliver is not stable enough. Thus the first thing we need to deal with is that we need to reduce the resolution of the image and decrease the frequency of image receiving to let them working steadily. We figured this problem out by using the Matlab code (recorded in Appendix).
About the vision environment, there are several things we need consider. First of all, the recognition sign of robot. A simple solution we can image is that we used a totally white surface plan. Then marked our robot by two coloured spots. Practically, a red one and a green one, which shall be disturbed by shadow and light seldom. Using our image process program, the image will be viewed as a matrix who was containing all of the pixels in This section details the core technologies we used for navigation. Especially image process and inertial navigation. Although they are both very simple version of applications. It can still represent the core theory related.
5.2 Inertial Navigation:
We presented a simulation approach for inertial navigation in an early stage. In this approach, we establish the mathematical model of the navigation system with considering the numerical outputs of IMU. In a practical inertial navigation system, the IMU outputs six values relevant to the movement states of a system according to the object’s movement. We reverse this process by defining a movement of the object and therefore calculate the outputs of IMU. This process is very complex but helpful for learning inertial navigation theory. To fit the traditional inertial navigation notation, a 3x3 state matrix as follow involved for movement define.
[■(phi&theta& psi@u&v&w@x&y&z)] (5.2.1)
Where the first row includes three velocity angles. The second row contains three accelerations along with three axes. Last row stores the position information. Overall, one complete matrix like this can present any movement state and attitude. Additionally, each value has their variation range, which is depending on the frames they set in separately. For different navigation tasks, we need to consider different types of frame that object should be located. However, our robot system is a very simple one which only needs consider a 2D Frame consist of three value.This system simplified process was progressed by another project participant Dongli. The discussion of this part will be detailed in his report. Especially section 2 and section 4.5 where addressing a lot of mathematical explanation of coordinate transformation. This section 4.5 has attached in Appendix as well.
6. Data Analysis
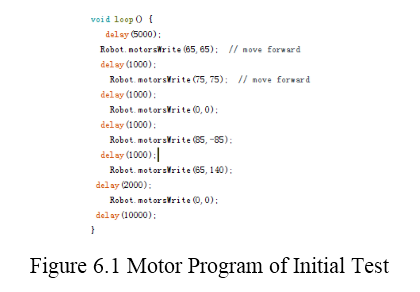
In this section, we design number of experiment to test our system. First of all, we did an initial test for the IMU. By setting a series of known movement, we attempted to correspond a practical movement to a numerical trend expressed on IMU as follow. Step 1. We set the motor as known movement program as following code.
It means the robot speed up to a speed at digital numerical values at 65 after 5 sec motionless. A slight continuous speed up to 75 and keep this speed for 1sec. Then, the robot stops for 1sec and rotate by itself and move along with curve. Step 2. We receive the output of IMU. After decoding and simple noise filtering, we got the following plots.
The sample rate we used for IMU receiving is 20 times per sec. The x-axis of above figure might be 20times of real time. Therefore, 5sec equals to 120 in the diagram (plus starting time). Combining above movements, we found that the acceleration on X and Y axes changed and vibrated around that time. However, the difference between these values is not obvious enough to analysis its mathematical relationship. Additionally, the velocity data is ideal to indicate that there is a fast rotation happened around 180 and kept rotating by a different direction after that for around 2sec.
7. Conclusion
This project successfully designs a robot plan to start a primary exploration of inertial navigation applied on vehicle system. However, due to the limitation of hardware and time, the trajectories from inertial navigation has not come out yet. The reason has been clearly discussed in section 6. Even though these system is valuable on contributing later research work. Since this project system contains too many details which can hardly delivery to next group. We will keep our work until most of the work and software finished. It contains system optimization and experiments design.
Reference
1. "Basic Principles of Inertial Navigation Seminar on inertial navigation systems." (PDF). AeroStudents.com. Tampere University of Technology, page 5. Retrieved22 January 2015.
2. Corke, P, Lobo, J & Dias, J 2007, "An Introduction to Inertial and Visual Sensing", in , The International Journal of Robotics Research, vol. 26, no. 6, pp. 519-535.
3. Y Ren, R Dan, M Pan, 1997, "Mathematical Modelling of Control System of AGV and Its Application", in, Journal of National University of Defence Technology, vol. 19, pp. 42.
4. Arduino 2016, viewed 20 October 2016, <https://en.wikipedia.org/wiki/Arduino#cite_note-1>.wifi connection
