Projects:2017s2-235 An On-line 10 kHz to 1 MHz Impedance Analyser
Group members
Xiaohui Pan, Xinkai Liu
Supervisor
Keith Kikkert
Contents
Introduction
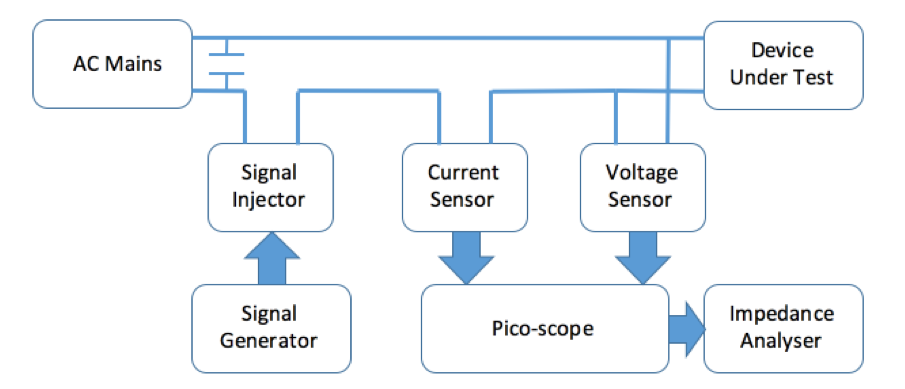
The project aims to utilise power line communication (PLC) technology to send PLC signals onto the transmission lines and thus calculate the impedance of the load from the voltage and current signals at the receiving end. Powerline communication uses the existing power lines as a medium to transmit both electric power and data simultaneously.
The focus of the project is the design of the signal injector and the current sensor used for injecting and extracting the PLC signal. High pass filters are also designed in order to reject the 50Hz mains signal from the PLC signal injector and the sensors. As a result, the impedance analyser should be able to cover the frequency range of 10kHz to 1MHz and provide a reliable impedance measurement, which can be done with the assistance of the pico-scope and LabVIEW software.
Objective
This project aims to design an on-line impedance analyser using current transformer coupling at PLC frequency. The frequency covers a range from 10kHz to 1MHz. The impedance analysis is implemented with both current signal and voltage signal injected to a Pico scope before sent to a computer for impedance analysis. For the current transformer, the number of cores and number of windings will be selected to acquire the best frequency response from 10kHz to 1MHz, appropriate airgaps length would be used to reduce the magnetic saturation for better coupling efficiency. High-pass filters are required to reject the mains frequency and protect the testing devices. The current sensor and voltage sensor are required to measure the current flow through the load and the voltage across the load. Before the impedance measurement, calibration of the hardware is necessary to improve the measurement accuracy.
Current Transformer Design
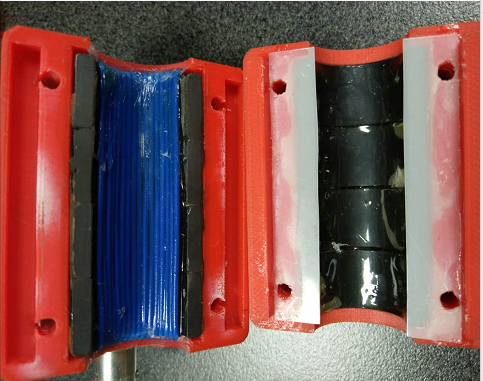
The current transformer is based on the toroid, which is cut in half to add airgap. Four toroid cores are connected in parallel to increase the effective area, epoxy is used between cores for connection, cores are well coupled to coupling efficiency. Two 0.3mm Mylar film are placed on each side of the cross-section area to reduce the effect of magnetic saturation. There are 16 turns secondary winding and one turn winding on each set of toroid core, which transfer the current from primary side to secondary by a factor of 1/16. The surface of the transformer applied with a layer of epoxy to increase the strength. The graph below is the final design of current transformer, the current transformer could be clamp on a power line easily.
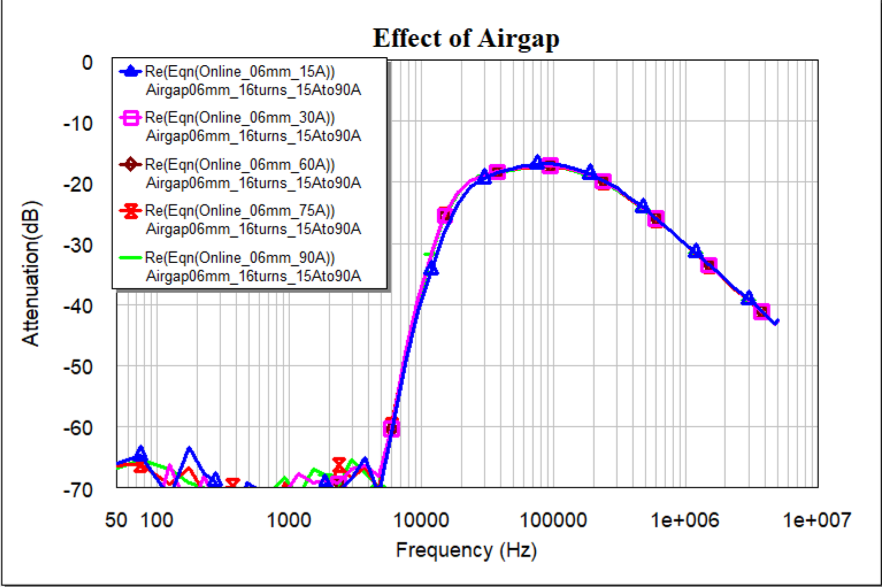
The graph above is the frequency response when the current increased from 15A to 90A. The 0.6mm airgap satisfies the design requirement, which shows no attenuation when the current increases. The frequency response also covers the whole range from 10kHz to 1MHz.
High Pass Filter
The high pass filter in the system is used both in the PLC signal injection and the current sensor to reject the 50Hz mains signal. For the PLC signal injection, the high pass filter prevents the mains current from entering the injection circuit and damage the signal generator. While for the current sensor, the high pass filter provides isolation against 50Hz signal to ensure an accurate current measurement.

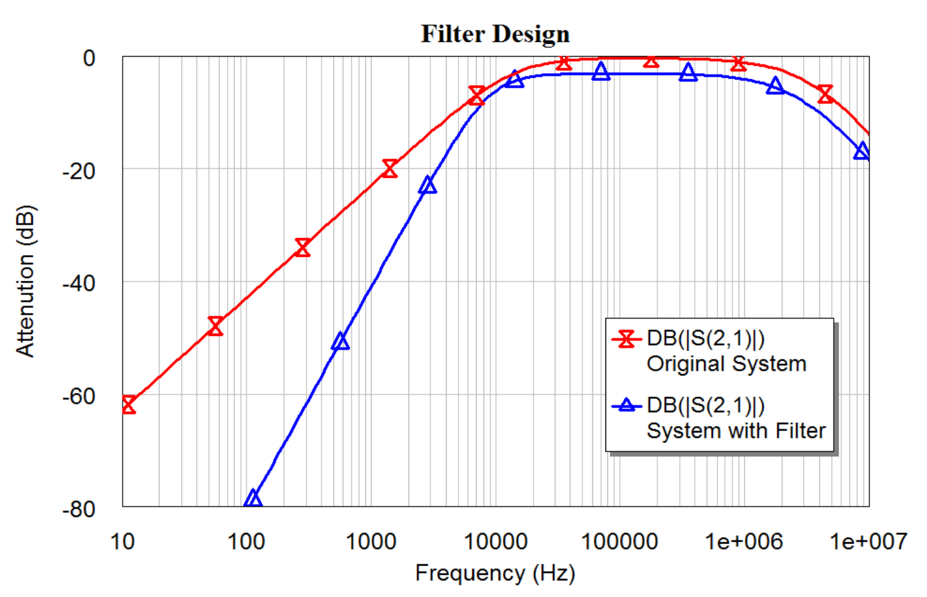
The simulation on the effect of the high pass filter is performed using AWR software and the result is shown below. The frequency response of the system with the high pass filter reaches -80dB of attenuation at the frequency of 100Hz. While at the frequency range of 10kHz to 1MHz, the system does not show much attenuation.
Voltage Sensor
The voltage sensor is designed to measure the voltage across appliance under measurement. In order to get the actual voltage value across the appliance, the measured voltage is required to be the same as actual value.
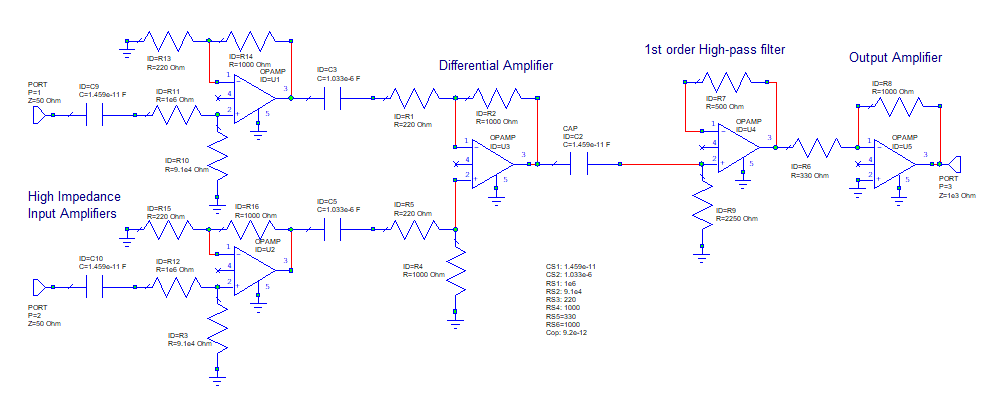
The figure above is the circuit diagram of the current sensor. There are three ports in the circuit, voltage signal injected into the circuit from the port 1 and port 2 before output a certain voltage value through the circuit and go out of the circuit from the port 3. The left part is high impedance input amplifiers, which reduce the amplitude of high voltage signal to a low voltage signal. The series capacitance C9 and C10 is used to reduce the 50Hz mains signal. AD 8045 are used for high impedance input amplifiers.After the signal is reduced, the signal going through a capacitor to further reduce the effect of 50Hz component. The second part is a differential amplifier where the voltage difference between two inputs are calculated. The third part of the voltage circuit is a first-order high-pass filter, which is used for eliminating the mains frequency component. The high-pass filter consists of a 14.6pF capacitor and a 2250ohm resistor.
Offline Measurement Results
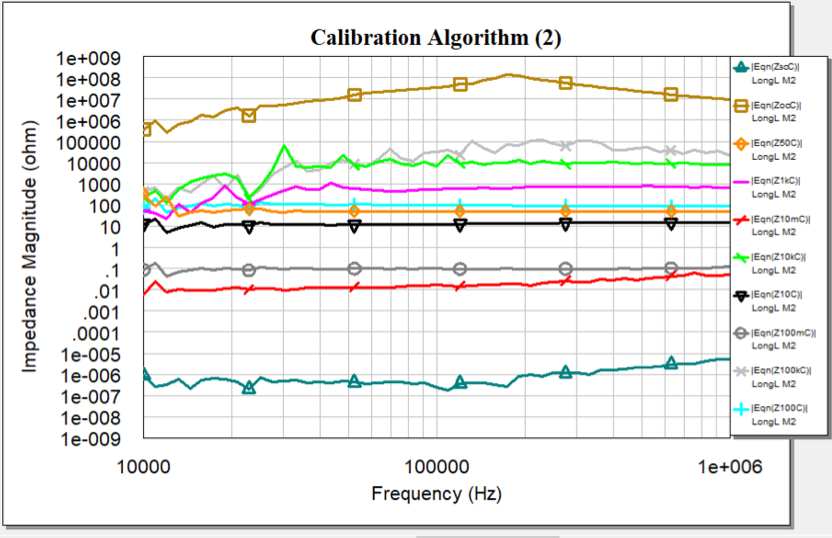
The raw impedance measurement data is imported to the calibration algorithm to perform calibration. The calibrated impedance values are shown below. From the results, it can be seen that the impedance analyser is able to measure impedance from 0.1Ohm to 10kOhm. Compared with the normal multimeter, the impedance analyser is able to measure smaller impedance such as . Within the desired frequency range of 10kHz to 1MHz, the impedance values measured are relatively stable without much fluctuation.
Online Impedance Measurement
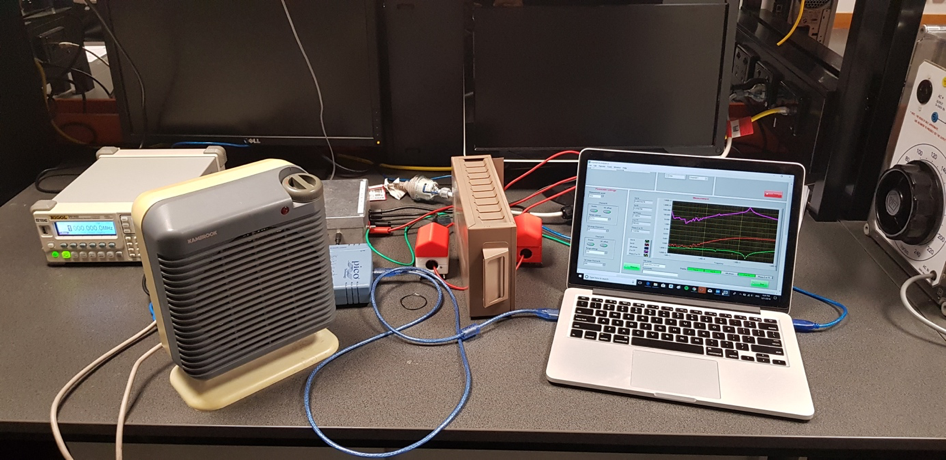
The online impedance measuring setup is shown below The device under test is a heater rated at 240V, 50Hz, 1800W. A metal plate is placed between the two current transformers to avoid the interference between the two magnetic fields. The capacitor box is directly plugged to the mains power outlet and the heater is connected to the capacitor box through the GPO. The two current transformers are clamped onto the power line which is connected to the two active terminals on the capacitor box. And the voltage across the heater is measured by the voltage sensor connected to between the active and neutral terminals on the capacitor box.
The heater that is tested has three settings: a maximum, a medium, and a minimum one. The three settings are tested individually using the setup and the result for the maximum heater setting, for example, is shown below.
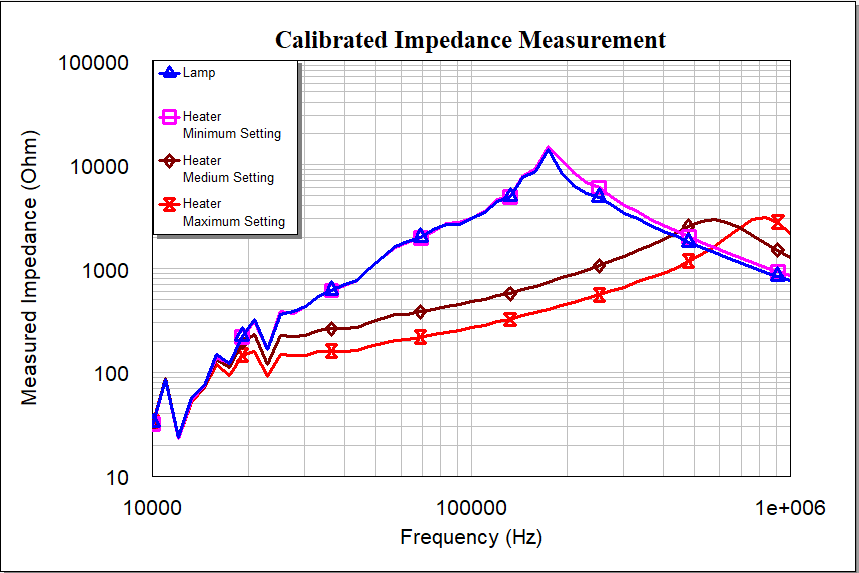
The results shown in below are the calibrated impedance values for the fluorescent light and the heater including the three settings. Since the heater contains the wounded coil inside, its impedance should vary with the change in frequency. From the results of the medium and maximum settings, it can be seen that the impedance gradually increases with increasing frequency. The rated power output for the medium setting is about half of that of the maximum setting for the heater. The results show that the impedance is almost doubled when switching from the medium setting to the maximum setting, which matches the assumption.
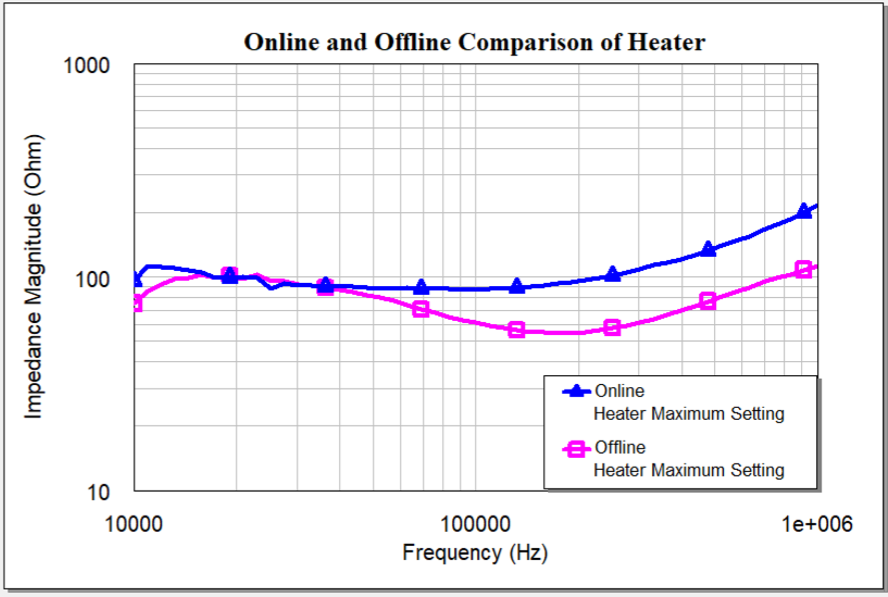
The offline impedance of the heater at its maximum setting is measured, calibrated and plotted in Fig 6.11 along with its online impedance at maximum setting. From the frequency responses, it can be observed that its offline impedance differs to the online impedance. The cause of this phenomenon is the change in temperature in the heater resistor when it is operating online. When connected online, the impedance of the heater components changes with the increasing temperature. While the impedance of the resistor and other components in the heater circuit should not change with the temperature rising under the offline condition.
Conclusion
The impedance analyser is able to perform online impedance measurements within the frequency range of 10kHz to 1MHz. For the current signal sensing, the current transformers constructed using ferrite toroid are capable of measuring 90A of current without saturation. And the high pass filters designed to reject the 50Hz mains component works well. In terms of the voltage across the device under test, the impedance measurement box containing the voltage sensor provides reliable measurements and is able to operate at 240V mains voltage. As a result, the device provides accurate impedance measuring for impedance values from to and could be further calibrated to cover a wider impedance range.
Future Work
Upon the project outcomes presented in the thesis, there are two aspects that require future work. First, the calibration algorithm has not been successfully incorporated into the LabVIEW program. At the current stage, the raw impedance measurement data has to be imported to the AWR software to perform calibration. Thus it could be complicated for those who are not familiar with the calibration procedures to obtain accurate impedance measurements. The other issue with the project is that the accurate impedance measuring can only be achieved in a limited impedance range. Beyond this range, the measurement results are not accurate due to the losses in the current sensors. There are F14 ferrite toroid cores with different dimensions available in the market which are thicker and easier to be cut to insert airgaps. Since the effective area of magnetic path is larger than the ones used in the project, the other F14 cores are more difficult to saturate and more robust in construction. Future projects could be built upon the current one to achieve a wider impedance measuring range and easier calibration process using the LabVIEW software.
