Projects:2018s1-102 HF Radio Automated Link Establishment (ALE) Model
Contents
Project Team
Students
Surbhi Ahuja
Sandul Fernando
Blake Luetkens
Supervisors
Prof. Lang White
Paul Hirschausen
Objectives
The aims for each section in terms of project deliverables to Codan are itemised below.
2G ALE Radio Network Simulator
- Study, sufficiently optimise and critically evaluate the simulation model and accompanying engineering documents delivered by the previous project team.
- Integrate HF wave propagation prediction data by using an aggregated Signal to Noise Ratio (SNR) value for fixed radio geographic positions to accurately determine linking probabilities and channel requirements of the radio network.
- Develop a design to enable radio mobility modelling functionality for a given starting coordinate and mobility region. Part of this design is to present an intuitive visual representation of the results to demonstrate to Codan customers.
Impedance Switching using a Re-purposed ATU
- Develop microcontroller code with functions capable of turning on specified relays that switch in reactances
- Confirm switched in reactances per enabled relay
- Create program on host computer that can switch on relays via a TTL - RS232 COM port connection
2G ALE Radio Network Simulator
Introduction
The industry sponsor for this project, Codan - Radio Communications Division, referenced as Codan from this point, are a supplier of HF radio communication solutions to customers types such as hobbyists, humanitarian organisations and Australian military operations. HF communication enables communication between a transmitter and receiver unit by taking advantage of HF wave propagation characteristics, particularly the wave reflection with ionised layers in the ionosphere to enable over the horizon communication - this is called skywave propagation.
The 2018 group undertaking this project name will be continuing the work done on a 2G-ALE simulator that was delivered by a 2017 group under the same project name and sponsor. Our group aims to incorporate ionospheric prediction data and transmitting radio mobility into the 2G ALE simulator to provide Codan with quality of service statistics and indicators regarding achievable connection links and channel requirements.
The wiki of the 2017 group can be found here at 2017 HF Radio Automated Link Establishment (ALE) Model.
Background
HF radio is still actively used and protocols (such as the new 4G ALE) that use HF communication continue to be actively developed. HF radio communication is critical for use in geographic locations without established communication infrastructure that are occupied by military personal or being aided by humanitarian groups. Protocols such as ALE ensure that no expert training is required for the operation of HF radios or knowledge of ionospheric conditions or effects on HF wave propagation.
The ionosphere is a layer of the atmosphere that contains electrically charged (ionised) particles and is located 60km - 1000km above the Earths surface. The ionosphere can be separated into multiple layers, each classified by density of these ionised particle, each layer has a different effect on wave energy absorption and reflection. The state of the ionosphere plays a key role in the propagation of HF waves. The ionisation in the ionosphere varies greatly depending on various factors such as the time of day, season, sun spot numbers and space weather conditions. All effect the ionospheric properties and the perversity of particular layers. For example the D layer at the ionosphere is typically no longer present during night time, and the F layer is distinct enough that is can be considered at 2 different layers, F1 and F2. The higher the frequency of a wave, the higher it's penetration capabilities through the ionosphere and thus the further it can travel in the ionosphere before it is reflected. Lower frequency waves are often attenuated heavily or absorbed completely in the lower layers. Higher energy waves that can travel through these layers and reflect off the higher F layers result in the highest propagation distances. It is possible that the energy is high enough in the wave such that the wave escapes the ionosphere, or low enough such that the wave is completely absorbed in the ionosphere. These 2 extremes outline the wide range of reflection possibilities.
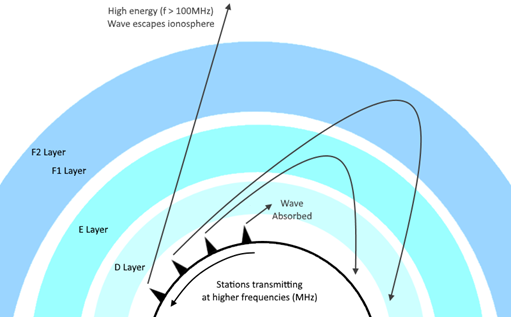
As discussed the ionosphere effects the available reflection paths between radio stations, another key component to the path available is the geographical location and distance between these 2 stations. Relative ionospheric effects vary depending on location on the Earths surface, and the distance between two stations in part define the number of available paths available between two stations for known frequencies and ionospheric effects. Figure 1 shows potential HF wave communication paths as a function of distance.
Figure 1. Skywave propagation paths for transmitting radios. As the frequency increases, the penetration potential for the HF wave through the ionosphere also increases. This can lead to complete absorption of the wave or even escape to outer layers of the Earth’s atmosphere.
Ionospheric Prediction Software
Several ionospheric prediction software tools were considered for use in this project.
It was ultimately decided that the group would proceed with VOACAP due to it's command line interface with configuration file functionality and frequency input specifications.
Extracting Ionospheric Data
The approach to including ionospheric communication prediction data is through the application of freely available HF propagation prediction tools, specifically VOACAP. VOACAP is able to output predicted SNR data sets for specified geographical locations, frequencies and hourly segments for a given list of months. The ionospheric conditions and HF wave propagation path viability is encapsulated in this SNR value and it will be one of the variables used to determine the probability of any given call being established.
To extract data from VOACAP in an efficent way, a parser was developed in C++. This parser accepted the transmitter and receiver coordinates, a mobility region and desired step size and generated hourly, and monthly per frequency SNR statistics.
Figure 2. Driver program flow diagram showing each step in the standalone VOACAP program as each point in the mobility region is considered. SNRs are still separated by Months, Hours and Frequencies.
Due to the relatively small coverage area that we will be considering, and the inherent inaccuracy already present in prediction tools, it was agreed upon to use a spherical earth model to determine latitude and longitude coordinates. By simplifying the spherical law of cosines for use with a spherical Earth model, and substituting an angle of 1 radian and the radius of the Earth R. Equations were found that linked the change in latitude and longitude (in degrees) to distance in kilometres, shown in Equations X and X.
Graphing SNR
Due to the dependence SNR would have on the linking probability and channel requirements, and based on the project requirement to visually represent the linking probability in terms of a mobility region. The group decided at this stage to determine the approach to graphing the data.
Matlab offers a C++ API that enables calls to be made from within the same central C++ codebase, it also was fast enough to manage millions of lines of data.
Our parsed data from VOACAP can be conceptually split into the following structure.
Month
       Hour
             Mobility Region
             (Changing RX Lat, RX Long coordinates)
                       Frequency and SNR pairs
Thus the result is (# of Frequencies * 24 Hours * # of Months) graphs. The output files were hundreds of thousands to millions of lines long and a graphing strategy had to be decided upon. As the mobility region could be represented as a grid, where each grid corresponded to some SNR at a known frequency, hour and month. The best fit was a heat map graph. An animation of the heat map going through the various states visually represented how the SNR at a particular frequency varied with the time of day and seasons.
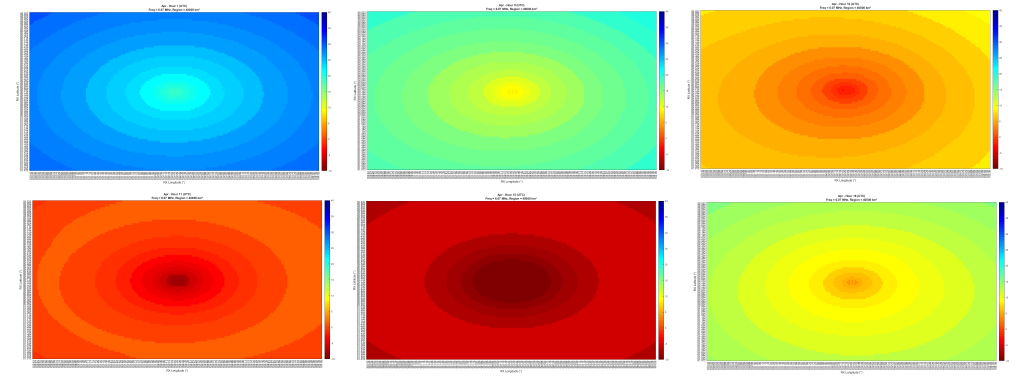
By setting a fixed colour map axis, we can visually see how the SNR varies depending on location, time of day and month. Figure 3 shows how the SNR varies throughout the day for a frequency of 6.07 MHz. The output graph automatically cycles through the hours of the days, and months to visually demonstrate the variation throughout the day and year for any specified frequency.
Figure 3. Heat map graphs of the VOACAP parser output. The RX radio remains fixed in the centre of the region, with the TX radio being sampled at points all about the region. Graphs show results for the Month of April, at the hours (UTC) of 1, 9, 10, 15 and 18 from left to right, top to bottom and a mobility region of 40,000km2. SNR colour scale is fixed at (40, -10) dB.
The very centre of the mobility region has a poorer SNR as the propagation path is a direct path straight up into the ionosphere, and back down to the RX radio. The angle of transmission has not been discussed until this point so briefly, there is a critical angle corresponding to a wave at a particular frequency, transmitting power and ionospheric conditions where transmission angles that are greater than this critical angle will result in the wave penetrating the ionosphere and going to outer space. The result of this is called a skip zone, a region of space between two radios where communication is not possible.
Lookup Table
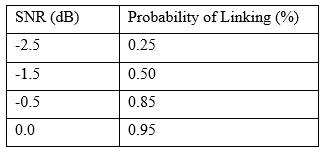
To directly correlate these two parameters, a lookup table (LUT) is used. The linking probability to SNR table used is from the MIL-STD-188-141B, a technical standards document which contains the desired table for a 2G ALE system operating under strict specifications of the 2G ALE preamble stage, transmitted signal characteristics and channel parameters, which are omitted from our simulation.
Table 1. SNR to linking probability lookup table
Due to the range of output VOACAP SNRs and VOACAP circuit options, and to provide the option to customise the table the lookup table was programmed as an input to the simulator. The functions that perform the mapping were programmed to work with any provided CSV lookup table. It is apparent that 25% as a minimum linking probability for SNRs indicating that no path is reasonably viable (ie. -30 dB) is too high, so additional rows needed to added between the linking probabilities of 25% and 0%. The LUT can be expanded to any number of SNRs for any desired linking probability by using a linear approximation, which is reasonable as the coefficient of determination for a linear trendline was calculated to be 0.9932.
Link Quality Analysis
The 2G ALE protocol has a feature called LQA. LQA is implemented as a table in the radio’s software that maintains link quality information and is looked up during the preamble period of a radio call attempt. If multiple suitable links have been successfully established previously, the LQA table will return the channel with the highest link quality information, such as the measured SNR. For a radio network with a fixed number of channels and stations that have been in operation for some time, each radio will have developed a steady state LQA table with link quality information for communication with other radios on the channels available.
To improve the accuracy of the generated statistics, and as a set of data required to implement LQA functionality was available, a basic LQA implementation was integrated into the simulator.
A data structure was created that stored the addresses to the probability list outputs of the lookup table conversion along with TX and RX radio ID identifiers. The VOACAP parser ensures that the parsed SNRs are output in ascending order of frequencies, this inherent way of referencing what frequency maps to which linking probability is lost when it is sorted. To resolve this, another set of lists that only store the corresponding channel IDs are created with the same size. A bubble sort that simultaneously sorts both lists resolves this issue.
Figure 4. Shows independent linking probability lists for communication with every other radio in the network. The subset bounded by the red dashed lines indicate the linking probabilities used when the simulator is operating at that particular hour and month. There are N radios in the network.
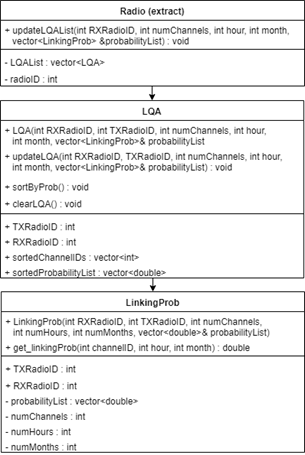
Figure 5. UML diagram showing the hierarchy of the LQA implementation.
The radio object contains a list of LQA objects and a method to update them given a probability list output from the LUT conversion. Each LQA object in the LQA list has the ordered channel preferences and linking probabilities for each possible radio link.
Mobility Modelling
An all-point mobility model is implemented, QoS statistics for mobile radios are calculated for each point. Each new location for a mobile radio is simulated independently and a new set of data resulting in average linking probabilities per hour is given. The linking probability is now represented as a heatmap similar to Figure 3. With this output and known input network characteristics, channel requirements can be inferred.
A random Walk model also implemented, but lacks overall representation of region and was of questionable use in characterising a customers requirements.
Results
- Robust input options and network specification options available to the user.
- Channel availability and linking probability implies more higher or lower frequency channels required.
- Generation of animated mobile & stationary radio graphs that vary due to hourly ionospheric data.
Overall simulator flow.
Figure 6. Process flow for the simulator program.
Figure 7. Linking probability vs time graphs for stationary radios.
Impedance Switching using a Re-purposed ATU
Developing a Regression Testing System
Introduction
A mini project (stage 2) which is independent to the 2G-ALE simulator was also introduced to the group this year. Stage 2 of this project is to use an existing impedance matching box to develop a regression testing system which allows automatic selection of impedances and other parameters (Voltage, Temperature) for regression testing for Codan’s systems. There are a number of inductors & capacitors inside the impedance matching box which are all connected to relays. The microcontroller code controls what the relays are and the positioning of the relays. Aim of stage 2 is to rewrite the microcontroller code to give direct access to the impedance elements (minimum requirement). In addition, it would be ideal to develop a full regression testing system which incorporates various other test equipment (Power supply, Temperature Chamber Control).
Background Information
3040 Automatic Whip Antenna
The Automatic Whip Antenna is designed to provide continuous tuning for antennas that scan multiple frequencies. The 3040 is designed for full compatibility with all modes of operation including receiver scanning, Automatic Link Establishment (ALE) and data. When tuning, the antenna seeks the optimum tuning point, ensuring the best communications possible are achieved. The 3040 Whip Antenna has a 125W power handling capability which is used for voice and data operations over the full 2 – 30 MHz frequency band (HF range). This is built to resist severe conditions that are often experienced in HF radio deployments. Inside the Whip Antenna, there are a number of inductors and capacitors which are connected to relays. Relays are switches that open and close circuits electromechanically or electronically. The microcontroller inside the unit controls what the relays are and the positioning of the relays.
Impedance Matching
In antenna tuning units, impedance matching networks are designed for radio antenna transmission systems. These systems transmit maximum power to the antenna in order to achieve maximum transmission efficiency. Typically, the antenna impedance is a complex function of the antenna placement, frequency operation and environmental factors. Therefore, the impedance matching network must be an adjustable one, with acceptable matching capacity. This impedance matching process is performed by controlling the network parameters adaptively.
Microcontroller Programming
The microcontroller that will be reprogrammed is the ATMEGA64-16AU. It is a high-performing, low-power Atmel AVR® 8-bit microcontroller. During this project, the reprogramming of the microcontroller will be done in ATMEL Studio 7. It is an Integrated Development Environment (IDE) which is used to develop and debug all AVR® microcontrollers. Atmel studio provides an easy to use environment to write, build and debug applications written in C/C++ or assembly code. For this project, the code will be written in C. Attached below is the pin configuration of the ATMEGA64.
Each digital I/O port of the microcontroller is associated with three registers.
Data Direction Register (DDRx) DDRx is an 8-bit register. It stores configuration information for the pins of Portx. (i.e: Pin numbers 35-42 in Figure 2 are the 8 pins in port C) To make a specific pin an input, a ‘1’ can be written to the required pin location in the DDRx Similarly, to make a specific pin an output pin, a ‘0’ can be written.
PINx–Port X Input Pins Register - PINx is an 8-bit register. Stores the logic value and the current state of the pins. Values on the pins of Portx can be read by its PIN register.
PORTx – Port X data register - PORTx is an 8-bit register. Stores the logic values currently being outputted on the pins of Portx.
Emulator
During stage two, JTAGICE3 will be used for emulating. JTAGEICE3 is an on-chip emulator which is used for emulating and programming of AVR® ATMEGA microcontrollers. It runs the code written in ATMEL Studio on the microcontroller in real time. This gives the user complete access to the internal resources of the microcontroller and to control the execution in the device.


