Projects:2018s1-135 A Low Cost Impedance and Transfer Function Analyser Part 2
Contents
Introduction
During 2017 a successful project was run to develop a low cost Impedance Analyser and transfer function analyser up to 1 MHz for University Laboratory Use. The impedance analyser uses 22 computer controlled switched resistors “R” in a potentiometer circuit, as shown in the figure below. The impedance Z to be measured, is: Z=R V_2/(V_1-V_2 )
Abstract
During the 2017 project, a basic LabView program was written controlling the signal generator and the digital oscilloscope, to read V1 and V2 , and calculating the resulting impedance. That software is does not yet allow for the required calibration procedures to be performed. A PCB was produced for the hardware. However that PCB had some errors and excessive track lengths resulted in a reduced high frequency accuracy. The aim of this project is to bring the hardware and software to a stage, so that it can be used by undergraduate students during Lab sessions. This involves 1) Completing the Labview software to include calibration techniques and be very user friendly, including built in help. 2) Redo the PCB to be error free, have very low inductance and capacitance to ground in the signal part and be suitable for low cost medium scale production.
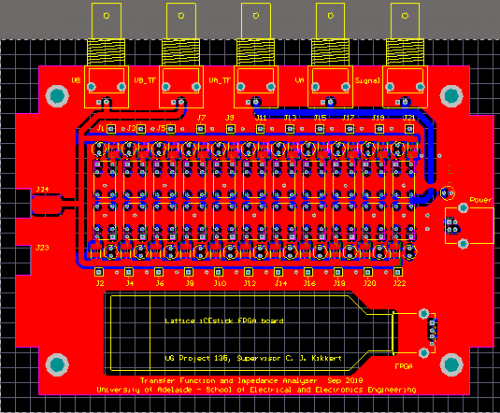
PCB Design
The following graph shows the PCB design of the device.
Calibarion Model
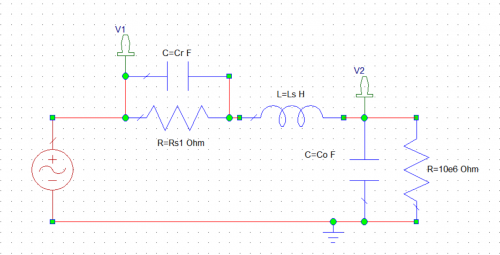
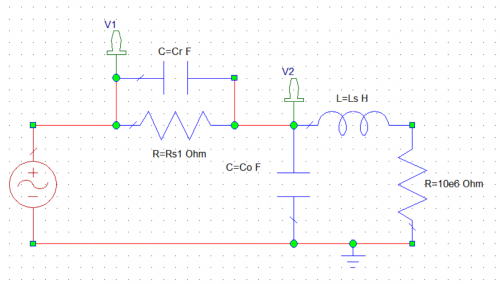
Simulating two different models in AWR software to find appropriate calibration model.
The impedance analyzer measure Cf//Zdut in model 1
The impedance analyzer measure Cf//(Ls+Zdut)
Model 2 simulation result matches with measurement result from LabVIEW, therefore model 2 was choose for calibration function.
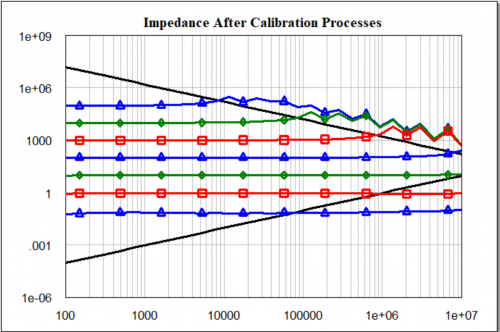
Impedance before and after calibration processes
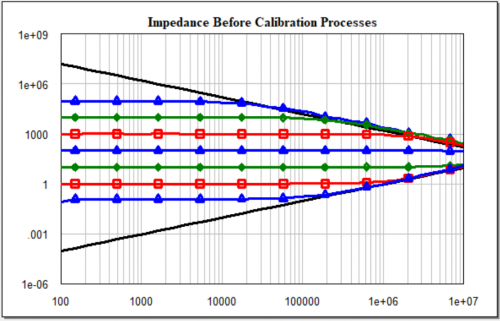
Before Calibration
The drop in high value impedances at high frequency are due to the existing inductance in hardware, and similarly the rise low value ones are caused by the stray capacitance before applying calibration processes.
After Calibration
The better accuracy of the measured impedance above 100 kHz shows the calibration processes is successful in reducing errors and provide better accuracy.
Frequency Calibration
Due to a difference in common crystal oscillator circuit, the signals from the AFG and oscilloscope, a frequency discrepancy occurs.
- Zero Crossing
- The approximation of zero crossing with linear interpolation is a methodology based on signal processing, with strives to calculate one frequency sinusoid. This principle is based on frequency detection, which is altered to apply a multiple point linear interpolation at a single zero crossing
For this process to be conducted the sinusoidal wave were passed through loops for discovering the timestamps of the zero crossings, also known as the rising edge for a square wave. Upon finding the timestamp, it is added to an array. The final procedure is a loop that calculates the difference in time from the prior zero crossing to the following rising edge. A threshold 1D array is built to search for the final timestamp of the sine wave zero crossings, which are present prior to the repeating rising edge. These two values are resultantly subtracted from each other for the zero crossing.
- Phase Delay Correction Error
- There should ideally be an overlap of measured phase of two whole cycle wavelength across a signal of finite length. This is unfortunately not the practical response due to the introduction of crystal oscillators between the signal generator and the Oscilloscope, and a profound delay occurs, which can be estimated by recording a multiple cycle signal.
The phase delay can be measured by applying one sinusoidal signal on two channels. Resultantly tone detection is used to calculate the phase delay. The phase delay was then somewhat evened out by the use of fast Fourier transforms, as a built in function in labview.
Input Voltage Average
The VISA resource name is opened and passed through the VISA reference to communicate with the opened device. The voltage is measured and recorded in text file This information is recorded and the program is retriggered to issue another set of voltages, and the process is repeated the number of time the user prompted. These recorded voltages are taken into arrays and then each row of the array is divided by the number of times the voltage was recorded by the user, and recorded in a new .txt file. This procedure took a significant amount of time, hence was tested and deleted from the program.
Members
- Han Wan
- Pragyan Choudhury
- Yen Hoang
Supervisors
- Keith Kikkert
- Wen Soong
References
[1] C. J. Kikkert, “An On-Line PLC Frequency Impedance Analyzer,” in IEEE SmartGridComm 2013 Symposium – Smart Grid Standards – Co-simulations, Test-beds, and Field Trials, 2013.
[2] C. J. Kikkert, S. Zhu and N. Ertugrul, “Software for Control and Calibration of an Inductive Shunt On-line Impedance Analyzer,” 2015 IEEE International Symposium on Power Line Communications and its Applications, pp. 53-58, 2015.
