Projects:2019s2-25502 Dynamic Modelling of a System with High Levels of Wind and Solar PV Sources
Contents
Abstract
This page touches on the preliminary studies of the project determining the stability issues of bulk power system when higher asynchronous generation connected into the system. The project target is to simulate an inter-area model in PSCAD and PSSE to evaluate the transient or dynamic stability issues after a contingency disturbance occurred. It recorded the steady-state modelling of the bench-marked (Single Machine Infinite Bus)SMIB, model in PSCAD and PSS/E, the detailed studies in bench-marking the synchronous machine models in both software, the detailed investigation in WT-4 model in PSS/E and the preliminary stability studies involving renewable energies. The project is based on the trending situation that wind / solar energy contributing more generation into the system. However, such high contribution brings challenges for the present operational strategies which based on conventional synchronous generation. It could cause high frequency changing rate, difficult to detect network faults, hard to maintain voltages and more. Some sub-transient oscillation would happen after contingencies. The ultimate objectives are determining those affects and propose solutions. At this stage, the project initialized the SMIB model in PSCAD. It has approximately close values as they were in PSS/E solution. It discovered some mechanism of the PSCAD synchronous machine model. The bench-marking results shows that the PSCAD model responding the same with the PSS/E model when some criteria met. The benchmark has also studied the WT-4 model (WT4G1/WT4E1) in PSS/E. A preliminary work about two-area oscillation model has been working and needs further studies. Further works may cover the synchronous machine model responses studies, the other variation of the wind turbine models, bench-marking them in PSCAD and the more detailed studies of two area oscillation models with high penetration ratios.
Introduction
Solar PV is a significant contributor in supplying power, and its usage is expected to increase with the new trend of shifting to a clean source of power generation. Recently as per studies, solar PV has had a sharp growth in its installations almost doubling the capacity when compared to wind turbines which happens to be the second largest area for renewable power generation [1]. Solar PV happens to be the primary source of renewable energy power generation contributing to a total renewable power of 55%. The remaining portions are contributed by wind (29%) and hydro power (11%) [1]. Up to few years, the power generation from wind turbines and solar PV used to be quite small, but due to large scale integration of renewable resources that are asynchronously connected in the grid introduce instability issues. The renewable do not get connected directly into the grid, instead they are connected by using inverters and controllers. As long as they occupy only a minor fraction of the load and the penetration of wind and solar is less, they have less impact on the dynamic behavior of the system. With this increasing trend of integrating renewable into the grid, when a disturbance such a fault occurs in the system, these generators get disconnected from the grid because they do not control the voltage and frequency levels. This may cause operational and stability problems to the grid and may also possibly lead to a blackout [2]. In case when the penetrations are low, spinning reserves that are left in power plants can be used to bring the system back online. It therefore gets important to research about the problems caused by increasing penetration levels of renewable sources in the grid. The main aim of the thesis is to gain some insight on the impacts of transient stability of the system when it gets subjected to faults. This project designed a simplified network of the South Australian grid which is modeled by using both renewable and synchronous generators. The dynamics of this network are studied using PSS/E. The original intention was to study the dynamics using PSCAD and PSS/E. But due to limited availability of PSCAD, the findings were only possible by using PSS/E.
Project team
Project students
- Jingzhe Xu
- Guancheng Lyu
- Mohammed Sufyan Contractor
Supervisors
- Mr. David Vowels
- A/Prof. Wen Soong
Objectives
The objective of this project is to develop a simplified model of a power grid which resembles the South Australian grid. This model consists of both the synchronous and asynchronous sources as shown in figure 1 which are to be modeled in PSS/E. For the purpose of this project, the models which are available in the standard model library PSS/E are used which further assures the reader about the results being accurate. The first objective is to understand challenges and opportunities being brought by higher penetration ratio of variable renewable sources especially in terms of stability issues.
The second objective is to establish SMIB model in PSCAD and get satisfactory results against the benchmark responses in PSS/E and do detailed research in learning these two software behaviors. The third object is to modelling large scale of asynchronous generations in an inter-area model and determine stability issues. Since the project focuses on the transient stability performance of the power grid. This is during the initial 30 seconds of the system response during a fault. Since 30 seconds is a short time, wind speed and solar radiance are considered as constants during faults. Hence, maximum power point tracking scheme of asynchronous generator and the contribution of harmonic control and filter arrangement to transient stabilities are beyond the scope of this project.
Background
Renewable energy penetration is becoming increasingly significant in modern power grid. Renewable sources have uncertain power generation which is further dependent on the weather conditions of the surrounding areas. Conventional sources use synchronous generators as they are more dispatch able can easily change their power outputs in order to meet the changes in the demand. As the penetration of renewable energy increases, many factors are required to be taken into consideration to achieve a greater grid flexibility in order to accommodate the changes in generation. One of which being the issue of inadequate system inertia. Thus, reducing the uncertainties associated with renewable energy generation further enables a more efficient utilization of the entire power system which includes the conventional generators, batteries and the transmission line infrastructure. Renewable energy technology is interfaced with the grid using power electronic inverters. These power electronic inverters convert the DC electricity into grid compatible AC power. These power electronic inverters also manage the flow of energy by controlling the fast switching times. In comparison with that of a synchronous generator, power electronic inverters do not have any mechanical part or a rotor attached on it. Instead it is purely an electronic device. These inverters are most widely used in Type-3 and Type-4 wind turbine systems and PV systems. In case of a DFIG the rotor windings are connected to the grid via slip rings and power electronic inverters. Whereas PV generate DC electricity and this must be converted to equivalent AC to deliver this power to the grid using this inverter. Discussion about power electronic inverters can be found in references [4-6]. As more generators get replaced by renewable energy sources, the inverters will need to impersonate the characteristics of a synchronous generator and be able to provide “synthetic inertia” type of a response [7]. Since inverters have no moving parts, their response only depends on the control strategy. They are often described as systems that have zero inertia. Kroposki in his paper has predicted how the future grid would completely be dominated by inverters as shown figure 2.1. Also in the paper he has described about the issues such as loss of system inertia, frequency instability in a grid that could possibly be faced in an inverter dominated grid. Further on wind and solar will also need to maintain the stability at higher penetration levels. Up to a certain level of penetration, issues related with intermittency do not pose a significant amount of challenge for the grid operators. With the increasing numbers, when these sources get disconnected from the grid problems with voltage, frequency and loss of inertia come into picture. However, a ‘spinning-reserve’ can be used to bring the power back online to off-set the voltage sags or to meet the load demand which is connected to the system.
Synchronous generator SMIB
The purposes of this benchmark include modelling SMIB in two software packages with the same behaviors, understanding PSCAD elements by manipulating parameters, validating results by manual calculation. Limited to the PSCAD license at this stage, elements such as transmission lines, transformers are aggregated as per dashed line indicated. The synchronous machine represents machine BPS in the simplified fourteen-generator system introduced in page 480 of [3]. The machine model is GENROE. The exciter model is IEEE Type ST1A Excitation System (ESST1A). The stabilizer model is 1981 IEEE power system stabilizer model (IEEEST). The SMIB system model designed is as shown in figure 2.
PSS/E power flow solution
Methodology for solving a power flow network applies following procedures: 1. Identify bus types in PV bus with defined active power flow and voltage level, PQ bus with defined active and reactive power flow, and VA bus with defined bus voltage and angle. PV buses connect with generators, PQ buses link with loads and a VA bus represents the one and only source bus which defined the reference angle of the system. 2. Create the admittance network of the system. 3. Create the equations for VI, PV, PQ, VA and form the matrix 4. Apply Newton-Rapson method to solve the network by applying proper initial condition. There is a chance of divergency in dynamic simulations, it is generally caused by the improper initial condition, which mostly means the state variables have a none zero initial value. Detailed instruction of power flow solution methodology could be found in [19] and [20]. The power flow solver may change its parameters as per “Acceleration factor (ACCN) = 0.300” and “Iteration limit (ITMXN) = 100” under “Power Flow” – “Solution” – “Parameter” – “Newton” tab. Such changes would improve the solver’s robustness. It then proceeds the solve the system by “Solve” option with default settings. The table shows the power flow solution obtained in PSS/E.
| Bus | Bus ID | Voltage p.u. | Angle Degrees | Gen | Bus ID | PG/MW | QG MVAR |
|---|---|---|---|---|---|---|---|
| 201 | 1.000 | 30.7476 | 201 | 2800.0 | 634.083 | ||
| 206 | 1.05087 | 14.1033 | 9999 | -730.565 | 125.428 | ||
| 210 | 1.05167 | 3.8433 | 210 | 2000.0 | 500.0 | ||
| 9998 | 1.05347 | 1.1214 | 210 | 0 | -442.4 | ||
| 9999 | 1.05000 | 0.0 | 210 | 0 | -442.4 |
PSCAD Synchronous machine model benchmarking
PSCAD is a real-time EMTDC, Electromagnetic Transients including DC, simulator. It simulates differential equations representing electromagnetic and electromechanical in time domain with fixed time step [4]. It is observed that the model and response is very sensitive to solver time step. This process is to evaluate and benchmark the PSCAD synchronous machine model. It has three steps, internal data integrity check, inter-simulator model comparison and generator parameter conversion investigation. The internal data integrity check is to derive internal data from the block and calculate the error from derived data sets and fetched data sets. Inter-simulator comparison is to benchmarks the objective PSCAD model with the observable model in Matlab. The conversion investigation aims to find the background logic on how PSCAD is handling the process, due to some inconsistency conversion being discovered yet on generator operational parameters to the equivalent circuit. The benchmark model constructs as per Figure 3 and Table 9.
Simplified SMIB Benchmark Results in Matlab versus in PSCAD
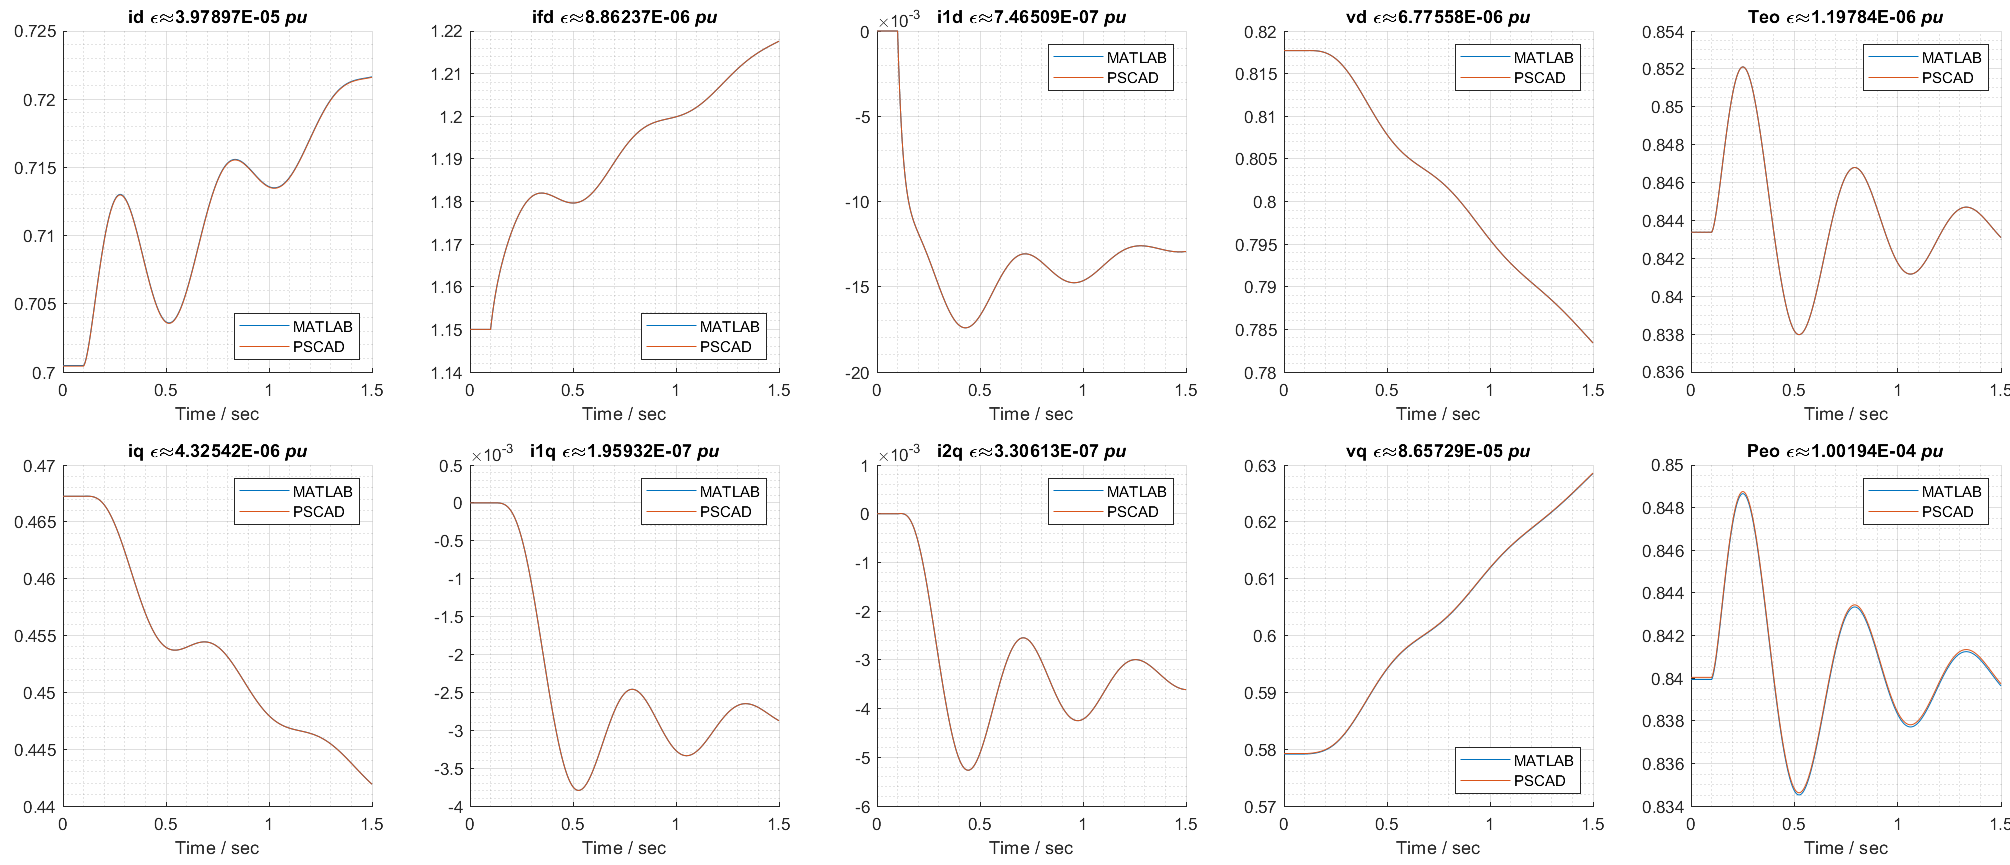
With the identical system and test conditions applied previously as per Figure 12, Table 9 and Table 10, the tests applied this time in two identical parameterised models in Matlab and PSCAD. By comparing two record sets, it could conclude if two machine models are identical. The machine block applied “Synchronous Machine p.u. Fundamental” under Specialized Power System in Simulink, Matlab. It masks flux linkage, voltage, and shaft equations described in Section 2.1.2. However, it does not include the magnetising losses. That represents by an external resistive shunt. Figure 14 presents comparison results of the monitoring quantities with absolute error value in per unit. Although the relatively larger error order (102) in electrical power output brought awareness, which mainly caused by the algorithm losses in reversal dq0 transformation, the results could conclude the PSCAD block behaves identical with the Matlab one. The observation of the Matlab block found it applies the flux linkage and voltage as per Equation 3, shaft equations as per Equation 5. Combined with findings in the previous section, it then could safely conclude the nature of PSCAD S.M. block that applied the same equation sets.
Benchmark Synchronous Model in PSS/E, PSCAD
The benchmark results show that PSCAD model will have the approximately same responses with PSS/E ones with several critical conditions:
1. PSCAD machine model applies classically defined circuit parameters, not the generator form. It should use fixed mechanical power, rather than fixed mechanical torque if the governor not modelled.
2. PSS/E model applies the magnetising resistance as a shunt on the machine bus and have this power consumptions included in the mechanical power output.
3. PSCAD applies detailed initial values from exported PSS/E steady-state records. Other network parameters, especially the internal resistance of the infinite bus, should match with each other.
Type 4 wind turbine model description in PSS/E WT4E1 and WT4G1
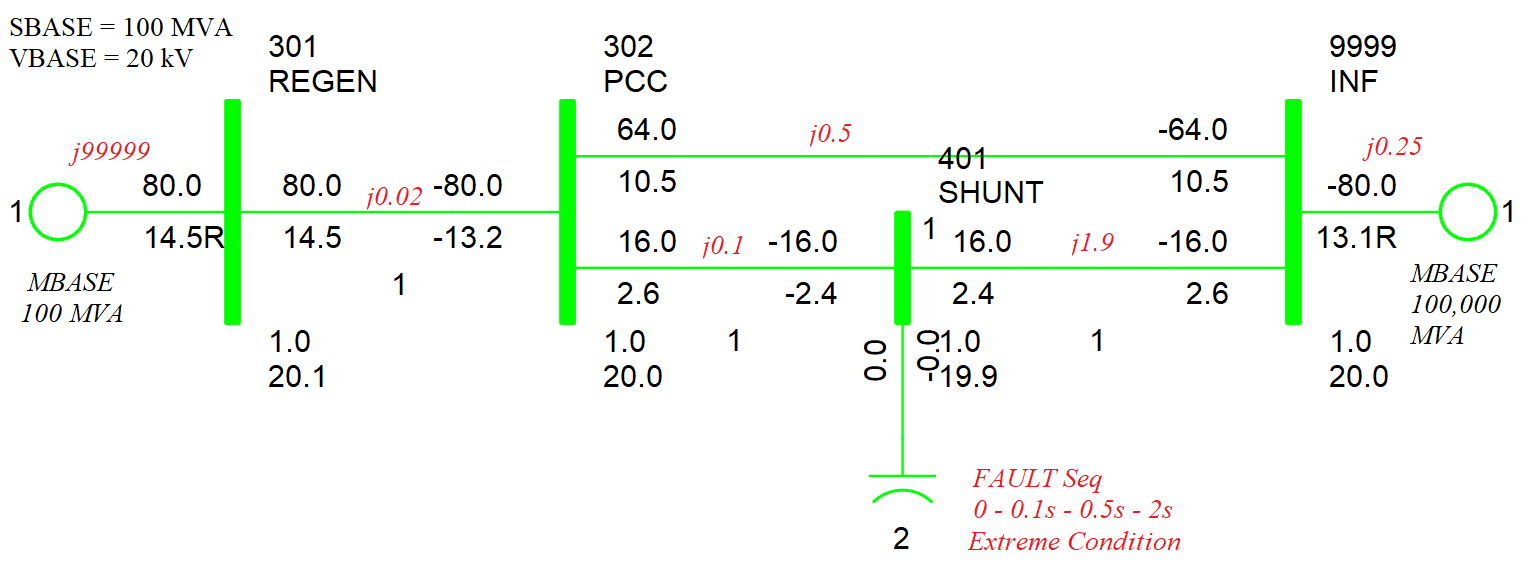
The electric control block and the generator block which is used to by power system engineers to model a solar PV has some similarities to a wind turbine. One must note that the developers at PSS/E had decided to use the same electric and generator control block for the wind and solar. These models in reality are not similar and have their own differences. The simulation represents just a hypothetical test condition and does not represent an actual test condition. The purpose of benchmarking for type-4 full rate converting wind turbine is to investigate the functional features of the block behavior during the fault situation. Unlike the synchronous machine, involved converter decoupled the machine and the network. Therefore, the transient response of the turbine differs from the conventional machines. The significant differences are in two aspects, firstly, due to the limitation of semi-conductor based converter, the short-time over-current is strictly limited, and secondly, the electronic based control logic could actively apply proper strategies to face different scenarios. The investigation is based on the 1st generation genetic type-4 wind turbine model in PSS/E with default parameters. ESIG [29] has detailed description on the model. Noted that there are options in WT4E1 model to determine its behavior property. The active function selections are “Remote Bus ID: 301”, “PF fast control disabled (PFAFLG:=0)”, “Q order (Qord) is provided by WindVar (VARFLG:=1)” and “Q Priority (PQLFAG:=1)”. Following block diagram will present the active path for the selected functional path. From ESIG’s description, the WT-4 model presentations are same both in the PSS/E simulator by Siemens and PSFL by General Electric. [29] Figure 4 presents the single line diagram for WT-4 wind turbine SMIB benchmark model.
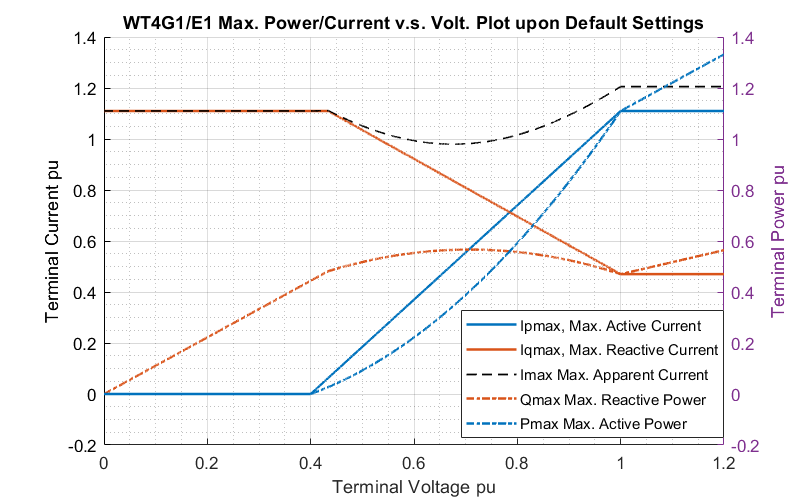
Figure 5 illustrates the maximum currents and power outputs versus the terminal voltage based on those settings.
Table 27 presents the network configuration of the benchmark model. Figure 36 presents the impedance network for fault configuration and post-fault situation. By varying the shunt capacity, it could control the bus voltage dropping.
Benchmark Test for WT4G1/WT4E1 Model in PSSE
Test conditions:
Fault On Time = 0.10s; Fault Off Time = 0.40s; Solver Time Step (DELT) = 0.0001s
Fault Level: 50, 500, 800, 2E10 MVAR on 20kV; Fault Location: Shunt on Bus 401
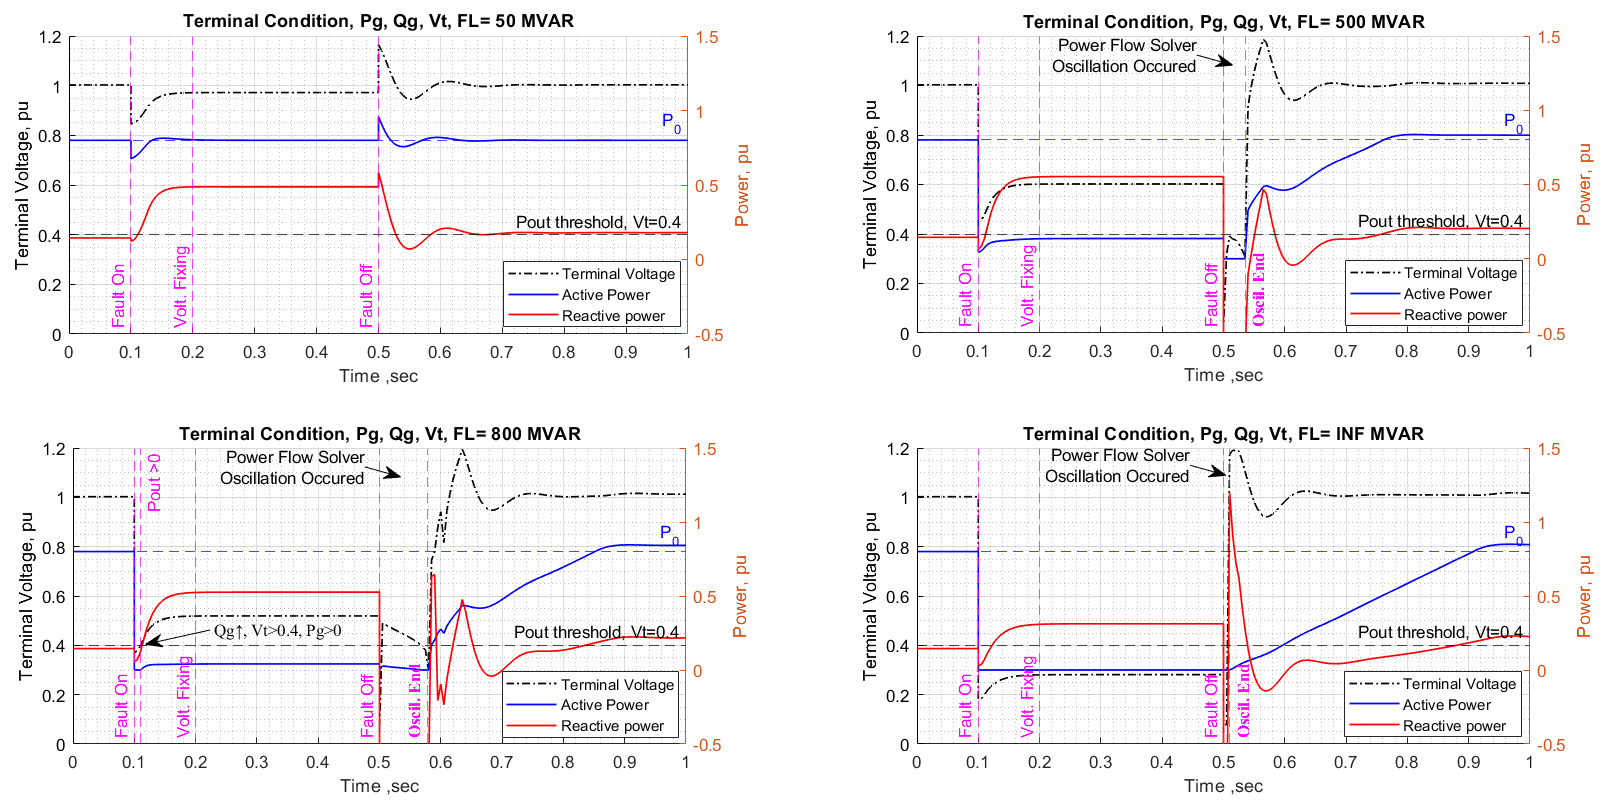
It needs to emphasize that all tests are based on default settings. The responses are for illustrative purposes. It is not necessary to represent the actual vendor supplied machines. ESIG has parameterized the model against GE 2.5 MW full converting wind turbine in different settings. Figure 6 presents four typical responses on fault ride through at the level of 50, 500, 800 and infinitive MVars.
The first plot, FL = 50 MVar case, represents that the turbine rides through the fault at the half of its capacity. In the fault period, the voltage (V_t) dropped below 0.9 pu for about 20 milliseconds. Due to the reactive power (Q_g) pumping, V_t recovered back to 0.97 pu and the Q_g at its upper limits on 0.487 pu till the fault removed, and the active power (P_g) kept at pre-fault rates. In the post-fault period, P_g,Q_g outputs and V_t experienced overshooting then settled down. Since the shunt and the faulty line removed, the Thevenin impedance on the turbine bus (301) increased compared with the pre-fault situation. The setting requires the turbine to track on PCC bus (302), it restored to a higher value at 1.0033 pu.
The second plot, FL = 500 MVar case, represents that the turbine rides through the fault at its five times of its capacity. During the fault, V_t dropped at 0.60 pu after V_t experiencing a dip at 0.45 pu. Since the voltage dip is higher than the 0.4 pu threshold, P_g continued pumping out, whereas the Q_g output hit its upper limit at this voltage. This response is expected since the setting flagged Q_g in priority. The simulation shows that V_t collapsed for 40 ms and Q_g dropped to consumption zone when the fault cleared. The third plot, FL = 800 MVar case, has some difference compared with the previous one. When the fault applied, V_t dropped below 0.4 pu at first, then it recovered above the threshold. P_g output paused for a bit then resumed pumping out.
The last plot, FL = INF MVar case, represents a three-phase bolted fault. V_t dropped below the threshold but recovered to some level, and P_g stopped pumping. When the fault and faulty line remove, the system experienced a voltage overshooting due to high initial level of Q_g. P_g then ramped up approximate linearly to a steady state at 1 second. It has noticed that the active power output exceeded the pre-fault level after its ramp climbing shown in the last three cases. The post-fault responses for the second and third plots are suspicious. A voltage overshooting is expected when the fault cleared. A detailed channel data analysis will apply on the third and fourth scenarios from monitored state variables.
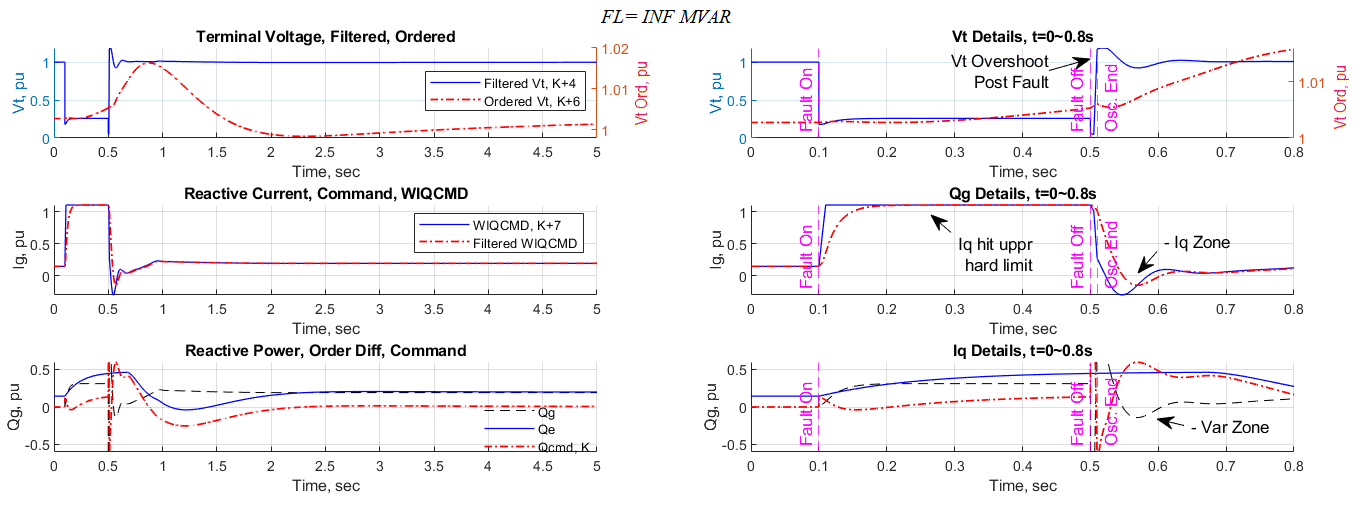
Figure 7 presents the terminal voltage, reactive current and reactive power responses including some state and arbitrary variables under the test condition with an infinitive reactive shunt placed.
The reactive power plots limited to show the region from – 0.6 pu to 0.6 pu. Outbound values deemed invalid due to the power limitation. The voltage has an expected overshoot when the fault removed if disregarding the solver oscillation zone. The voltage order (K+6) always keeps around 1.0 pu. The reactive current does not occur a step change after the fault cleared due to the initial value stored in the state variable K+1 in the generator model (WT4G1). It then declines gradually, due to the lag, and oscillate to align with the voltage command and post-fault Thevenin impedance. The reactive power command (Q_cmd) is the consequence of the voltage error PI controller (K+1, K+8). It stays in a high level before declining due to the initial value and lag of the integrators (K, K+8) at the time of fault removal.
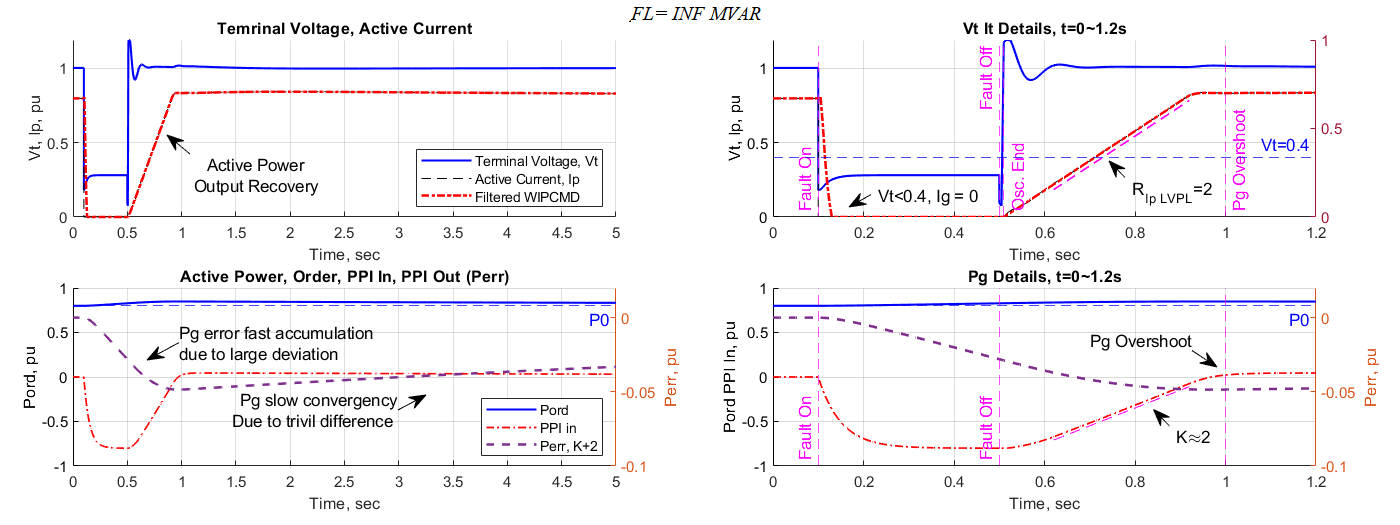
Figure 8 presents the terminal voltage, active current and active power responses including some states and arbitrary variables under the test condition with a three phase ground fault on the Shunt Bus (401).
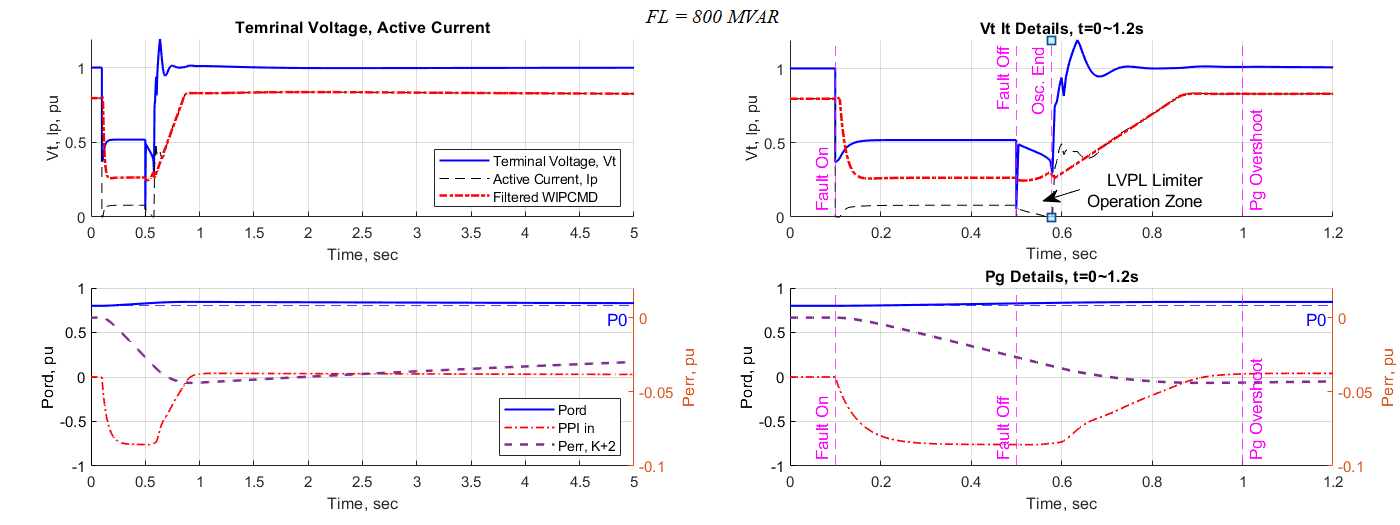
As mentioned before, the active current stopped pumping during the fault. It increased at the rate of 2 pu / sec due to the rate limiter setting R_(IP_LVPL)=2.0 . During the climbing period, the power error (K+2) increased at the similar rate since the voltage stabilised at 1.0 pu. The PI state variable (K+2) starts to accumulate the error at a high rate due to a large deviation from the power order to the command when the fault applied till the power output regained above the initial value (P0). It then decreased slowly due to small deviation of the power output. Consequently, the power has a slow pace (K_ip=0.1) recovery back to normal after the overshoot. There was not a mechanism to reset the state variable when the power regained back normal.
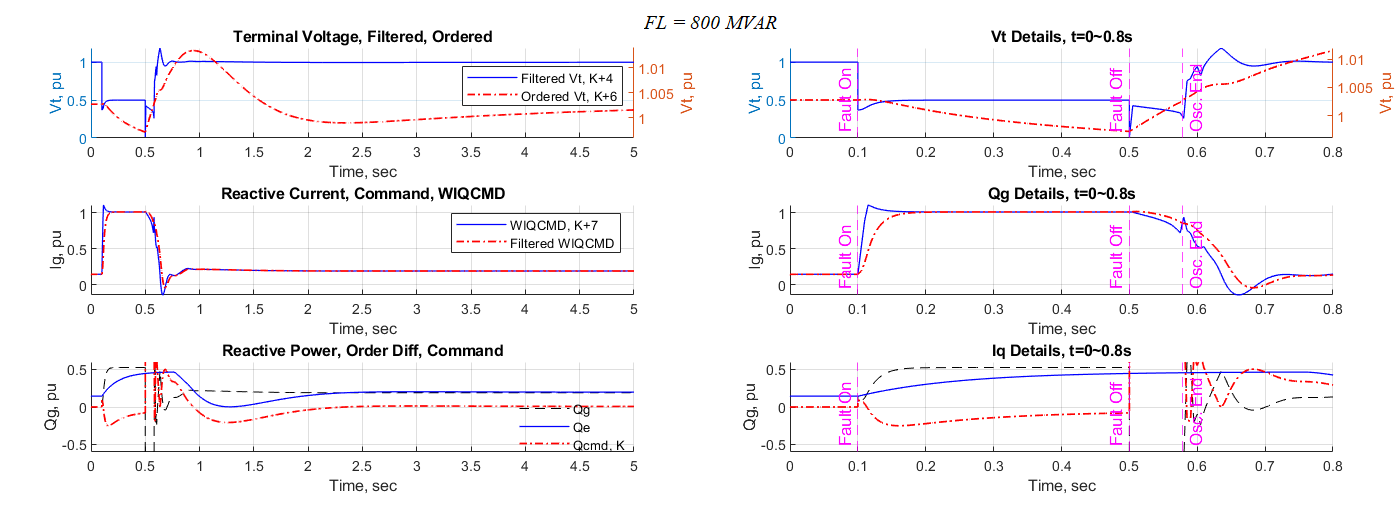
Figure 9 and Figure 10 presents the reactive power and active power related plots, respectively under the fault condition of 800 MVAR.
The plot features are similar to those plots in the infinitive case. The difference is a longer solver oscillation period being found. During this time, the voltage collapsed and soon recovered at 0.5 second, but it kept going low until moving out of the oscillation zone after the fault cleared. The low voltage power limiter activated during this period which enforced the active current fell to ground at about 0.56 second. Voltage overshooting magnitude is similar due to the maximum reactive current being supplied at the time when the fault is cleared.
Two area modelling
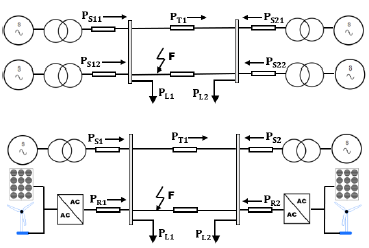
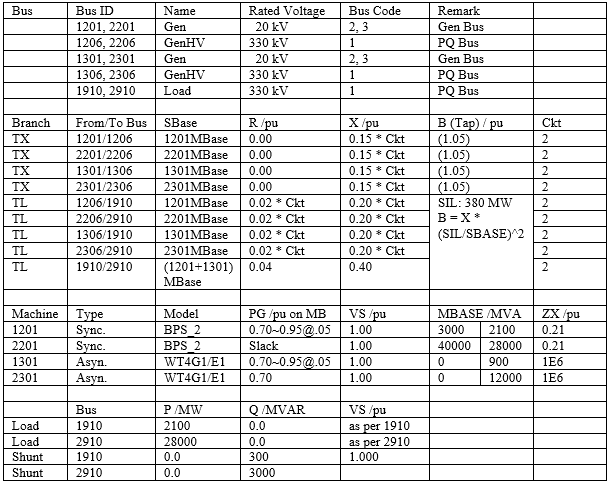
This section mainly tries to discover the two-area oscillation model with increased penetration ratio of converter based renewable energy generation as shown in Figure 2. Finding the oscillation modes is a mandatory requirement by the National Electricity Rules [30] [31]. The direct method to find the modes is to model every elements of the network into differential and algebraic equations and do the small signal analysis. The eigenvalues of the state variable matrix will demonstrate the oscillation modes. However, it is not practicable to create DAEs for the designated network at this stage. The question then turns out if it is possible to determine the course of the oscillation from simulation observations and, furthermore, what kind of oscillation will happen when the converter-based sources participates the generation, then if it is possible to determine the source of oscillation based on pervious findings through synchronous machine and type-4 wind turbine models. Figure 11 and 12 present the two-area benchmark configuration.
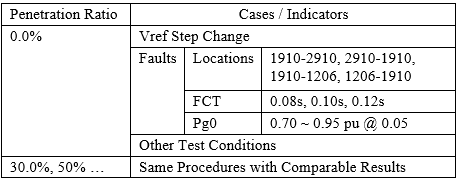
Though there are many variables affecting the oscillation modes, we try to limit them into a controllable scope and investigate the causes. Foremost, we only apply models that has been studies previously, the synchronous model applies BPS_2 with its exciter and stabiliser and the type 4 wind turbine WT4G1 and WT4E1 with given parameters. Then, we discover two penetration ratio 0%, 30% scenarios. Thirdly, we do a reference voltage step change on synchronous machine 1201 to see the exciter / stabiliser interacting with the synchronism system. Fourthly, we do fault tests depending on various initial generation power (Pg0), fault locations (FL) and tripped lines, fault clearance time (FCT) for difference cases. Although from the Power System Dynamics course [30], the impedance is a major factor to the modes, we did not consider about it yet at current stage. Figure 13 illustrates the mentioned hierarchical investigation paths.
Indicators in the following explorations are the terminal voltage and rotor speed deviations for the synchronous machine and WIPCMD, WIQCMD, Vord for the wind turbine. Other variables, such as rotor angle, frequency, active power flow are algebraic variables from these base quantities.
2 area benchmark with synchronous generators only
The first raised question is what the reasons cause the oscillation. The assumption is that the synchronous system interacts with the machine’s circuit, the exciter and the stabilizer. The system provides a feedback affecting the machine’s rotor angle. [7] [30]
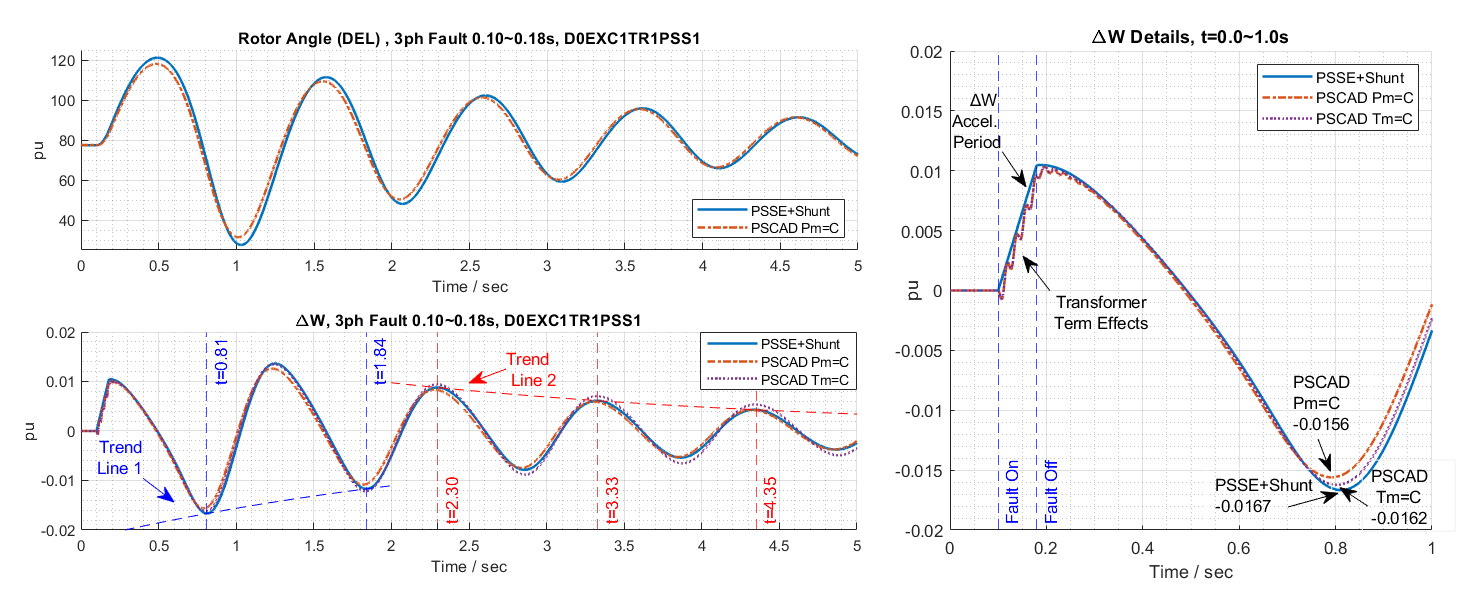
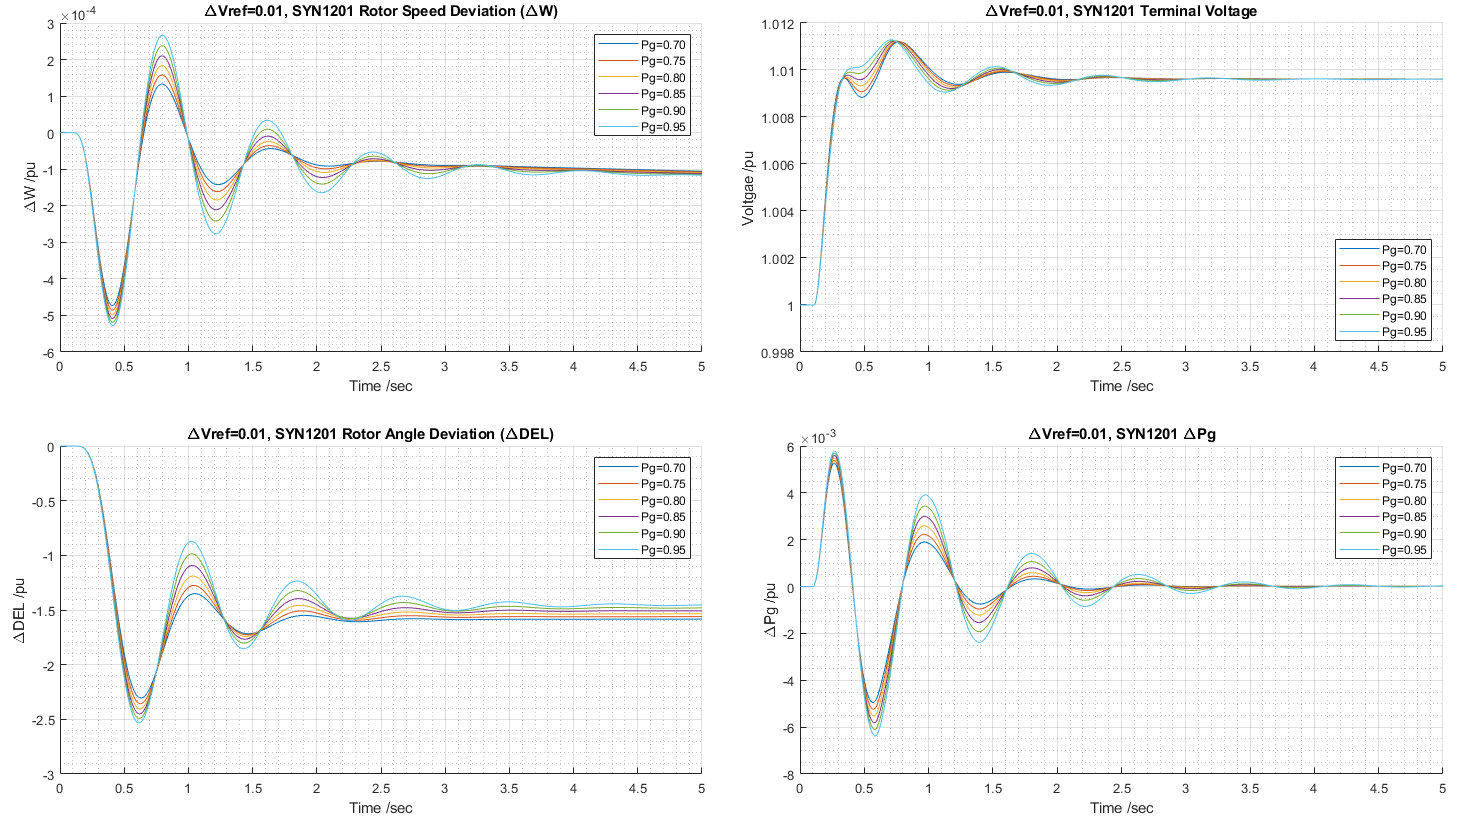
Figure 14 shows the responses of the said test in rotor speed deviation, rotor angle deviation as well as the terminal voltage and active power.
The oscillation in these four plots are at about T = 0.85 sec. With the initial generation ratio increasing the period is decreasing. However, this decrease is a negligible minor factor. The increased voltage pushes the network voltage raises, consequently, the load bus voltages increase. Then the load power increased due to configured impedance nature. The total generation increased 1.74 MW from the summarized generator outputs. Therefore, the rotor speed should decrease in accordance with the swing Equation 5 since the mechanic power has no change.
Time snaps gives in the form of FCT (dip 1 time, dip 2 time) after 2.0 sec:
Left: 0.08 (2.561, 3.476); 0.10 (2.656, 3.571); 0.12 (2.876, 3.786), 0.125 (3.201, 4.111)
Right: 0.08 (2.419, 3.326); 0.10 (2.451, 3.359); 0.12 (2.499, 3.406), 0.125 (3.021, 3.926)
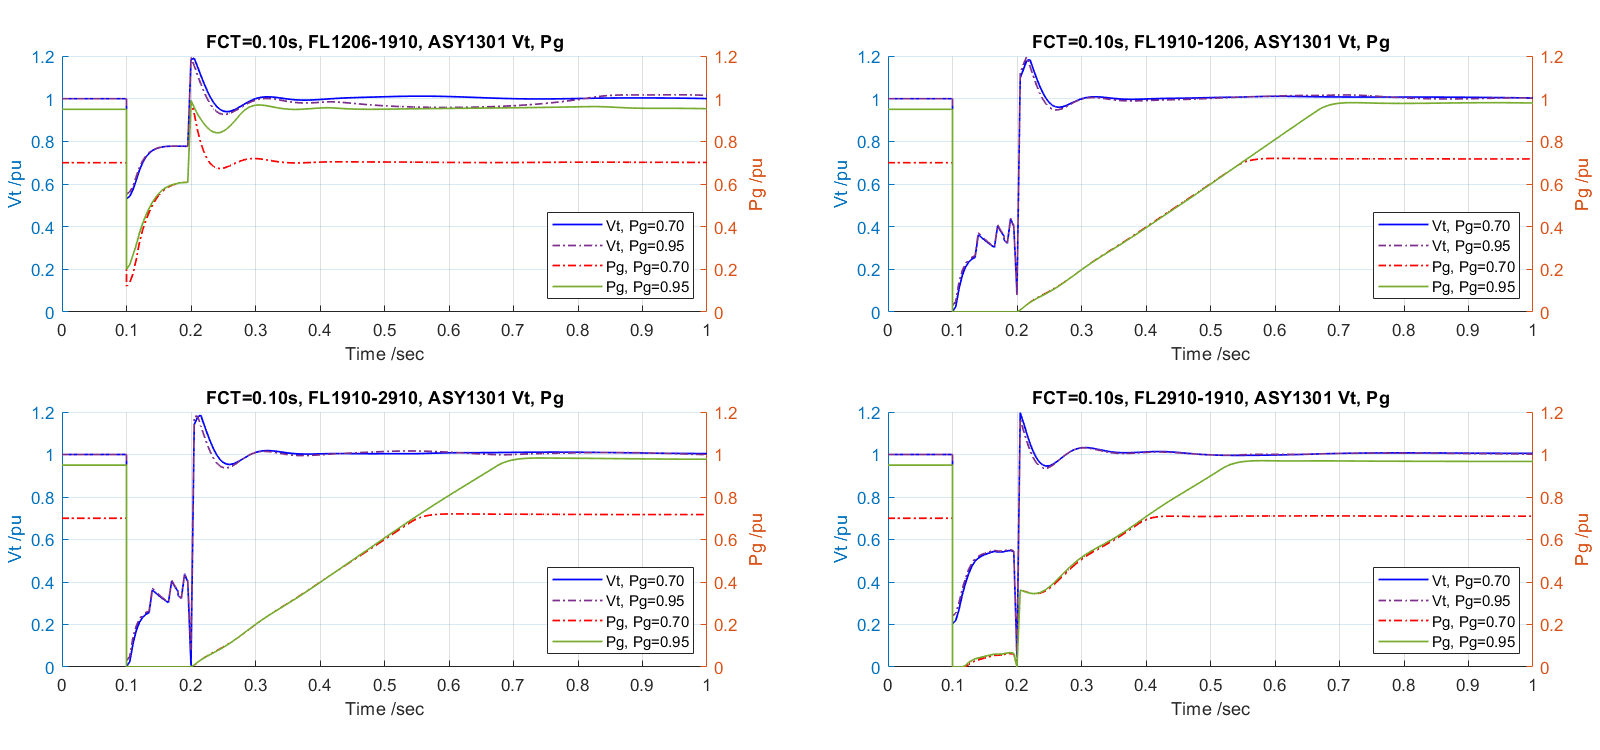
The third comparison is to check the fault location effects in the left zone. Figure 48 show the speed deviation plots comparing the effects when FCT=0.10s and the initial power is 0.70 and 0.95 per unit, respectively. Basically, with further location of the fault, the magnitudes are smaller, and the period are relatively longer. The last case in the left plot where the fault located at bus 2910 in area two, the furthest case, show the instability scenario when the fault cleared. The stabilizer brought the system back to synchronism. The first case in the left plot where the fault located at the HV side of the SYN1201 shows loss synchronism case.
Figure 15 Two Area SYN=1.0, ASY=0.0 Model SYN1201 Fault Location Affection Responses based on FCT=0.10s, Pg =0.70 & 0.95 pu
The equal-area criteria analysis should apply here, following data listed with software calculated equivalent impedance based on the machine base during the fault. Due to limited of time, the insightful analysis does not perform yet.
2 area benchmark with 70% synchronous generation
The benchmark network configuration is as per Figure 42 and Table 28. The machine base of SYN1201 decreased to 70% or 2700 MVA, and the machine base of ASY1301 increased to 30%, or 900 MVA. The right-side machines make the same portion of adjustment. The configuration presents one instance of 30% of renewable energy penetration situation. From previous studies, the WT4 model does not directly have network frequency related blocks. The interface transfers active and reactive currents into the currents aligned with the network synchronous frame. At this stage, there is no clue if the applied model could form the network frequency. The proper stability indicators would be the terminal voltage and the active power.
Fault application findings
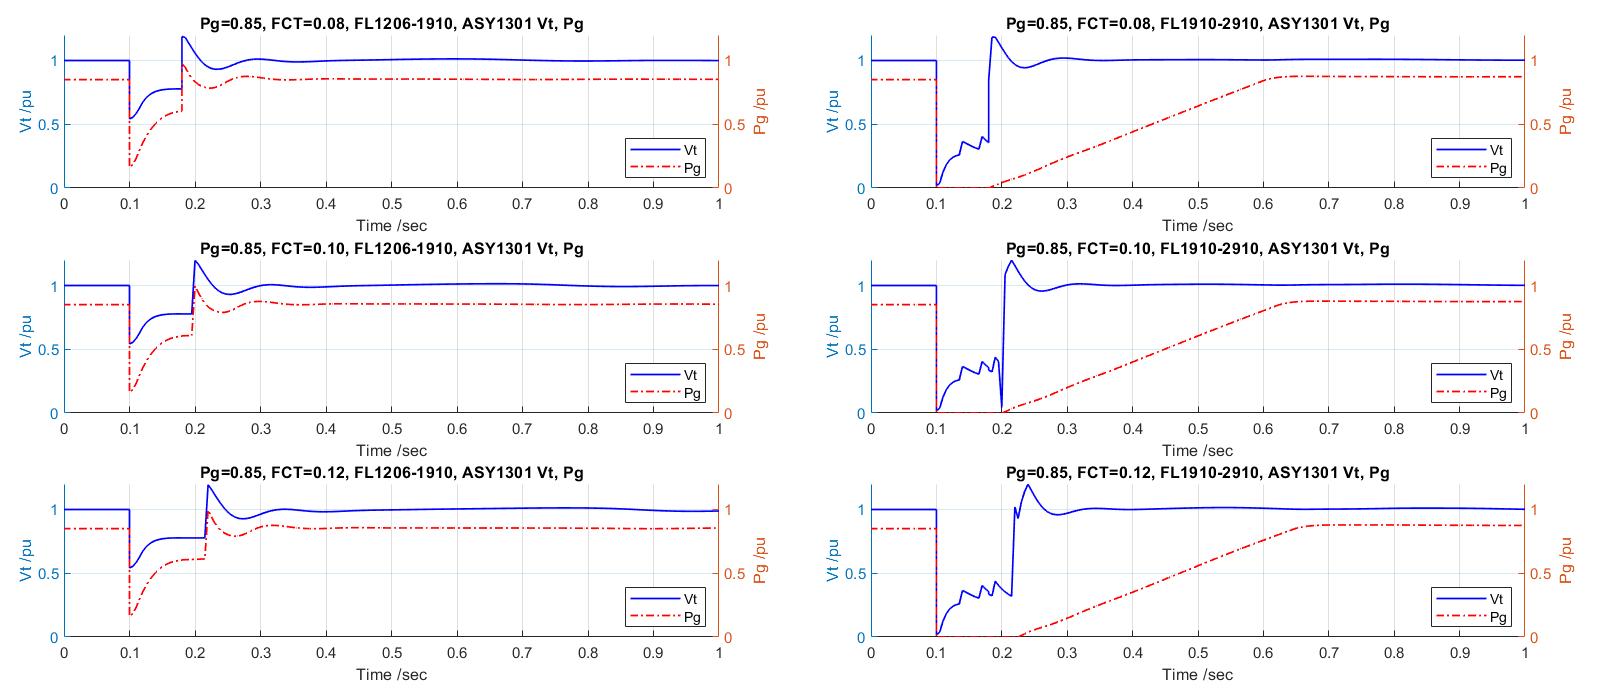
With the same methodologies applied in the study of full synchronous generation situation. Three cases have been indicated. Some detailed investigation and comparison from two penetration scenarios worth future develop. Limited to the time, these results do not reflect above works. The faulty condition on the location of FL1910-1306, FL1306-1910 will cause the simulator divergences continuously. Figure 16 and Figure 17 present the fault clearing time affection responses of SYN1201, ASY1301 at 0.9 pu of initial power output on the fault location FL1206-1910, FL1910-2910, respectively.
Compared with Figure 15, the oscillation period keeps minor changes, but the magnitude has visible decreases in both two subplots. Figure 17 shows the turbine has less affection when the fault is away from it. It indicates the turbine supporting voltage stability in a range of 0.15 sec post-fault. The model seems to have a hurdle of the Thevenin impedance deviation between the pre-fault and post-fault situations. Larger change of the deviation will result in the instability situation.
Figure 18 and Figure 19 present the machine responses compared to the different fault locations. Compared with Figure 15, both oscillation magnitudes and period decrease minorly in two cases. The turbine shows its ability in these cases, and the initial power output does not affect the voltage responses, since they are through two independent control paths. Fault Cases for FL1910-1306, FL1306-1910 vary Pg = 0.70, Pg = 0.95 are not converged. So, the plot does not include them.
Conclusion
The synchronous machine model studies investigated two types of machine models, one defined in classically defined operational parameters (OP) applied in GENROU/GENROE in PSS/E, and the other defined in equivalent circuits (Cct). The paper found only when the PSCAD applies the classically defined equivalent circuits will it have the same responses with the PSS/E models given that both models applied identical impedance elements. PSCAD converts the OP to Cct through two different methods, depending on if the exact short-circuit time constants could be found. The excitation system models have also been studied. The mechanism and importance of the stabiliser is appreciated. The WT-4 wind turbine model representation in PSS/E has been researched. It shows strong support in voltages but is highly sensitive to the fault level and impedance deviations. The simulator configuration affects the results greatly. Some oscillations of the results have been discovered. The two-area oscillation model, as the initial trial in studying the effects of high penetration of the renewable energy, has been developed. With the single variable control methodologies, the oscillation modes and causes have been found majorly from the system impedance topologies and the fault clearing time. WT-4 model shows its strong capacity in supporting the terminal voltage and the power output. However, further investigation is of utmost importance if that is the actual case.
References
[1] "Renewables 2018 Global Status Report (REN21)," ENERGIA INTERNATIONAL NETWORK ON GENDER & SUSTAINABLE ENERGY, 2018.
[2] E. G.-L. P. M.-V. Andrés Honrubia-EscribanoaF. Javier Ramirez, "Influence of solar technology in the economic performance of PV power plants in Europe. A comprehensive analysis," Renewable and Sustainable Energy Reviews, vol. 82, no. 1, pp. 488-501, 2018.
[3] M. J. Gibbard, P. Pourbeik and D. J. Vowles, Small-signal Stability, Control and Dynamic Performance of Power Systems /, Adelaide: University of Adelaide Press, 2015
[4] Manitoba HVDC Research Centre, “EMTDC v4.6.0 Users Guide,” 2018. [Online]. Available: https://www.pscad.com/uploads/ck/files/EMTDC%20Users%20Guide%20V4_6_0.pdf. [Accessed 06 2020].
[1] Clean Energy Council, “Clean Energy Australia Report 2018,” 2018. [Online]. Available: https://assets.cleanenergycouncil.org.au/documents/resources/reports/clean-energy-australia/clean-energy-australia-report-2018.pdf.
[2] W.-K. Wong, Renewable Energy Integration: Concepts, Trends & Challenges, Adelaide, 2019.
[3] H. Bevrani, Robust Power System Frequency Control, Springer US, Boston, MA, 2009.
[4] D. Vowles, Electric Power System Lectures, Adelaide, 2018.
[5] B. Kroposki, B. Johnson, Y. Zhang, V. Gevorgian, P. Denholm, B.-M. Hodge and B. Hannegan, “Achieving a 100% Renewable Grid: Operating Electric Power Systems with Extremely High Levels of Variable Renewable Energy.,” IEEE Power and Energy Magazine, vol. 15, no. 2, pp. 61 - 73, 2017.
[6] IEEE PES Task Force on Microgrid Stability Analys;, “Microgrid Stability Definitions, Analysis, and Modeling,” IEEE PES Power System Dynamic Performance Committee, 2018.
[7] M. L. P. Kundur, Power System Stability and Control, New York: McGraw-Hill, 1994.
[8] O. Anaya-Lara, Wind energy generation : modelling and control, Chichester, UK: John Wiley & Sons, 2009.
[9] J. Slootweg and Kling, “The impact of large scale wind power generation on power system oscillations,” Electric Power Systems Research, vol. 67, no. 1, pp. 9 - 20, 2003.
[10] G. Lalor, A. Mullane and M. O'Malley, “Frequency control and wind turbine technologies,” IEEE Transactions on Power Systems, vol. 20, no. 4, pp. 1905 - 1913, 2005.
[11] C. Liu, X. Tian, K. Chen, Y. Su and Y. Li, “Effect of PLL on transient performance of wind turbines generator under voltage phase jump,” The Journal of Engineering, vol. 2019, no. 16, pp. 967 - 971, 2019.
[12] P. W. Sauer and M. A. Pai, Power System Dynamics and Stability, Urbana: The University of Illinois at Urbana-Champaign, 2007.
[13] M. J. Gibbard, P. Pourbeik and D. J. Vowles, Small-signal Stability, Control and Dynamic Performance of Power Systems /, Adelaide: University of Adelaide Press, 2015.
[14] IEEE, “IEEE Guide for Synchronous Generator Modeling Practices and Parameter Verification with Applications in Power System Stability Analyses,” IEEE Std 1110-2019 (Revision of IEEE Std 1110-2002), no. 10.1109/IEEESTD.2020.9020274, pp. 1-92, 2 March 2020.
[15] IEEE, “IEEE Guide for Test Procedures for Synchronous Machines Including Acceptance and Performance Testing and Parameter Determination for Dynamic Analysis,” IEEE Std 115-2019 (Revision of IEEE Std 115-2009), no. 10.1109/IEEESTD.2020.9050934, pp. 1-246, 27 March 2020.
[16] S. Umans, J. Mallick and G. Wilson, “Modeling of Solid Rotor Turbogenerators,” IEEE Transactions on Power Apparatus and Systems, 1978.
[17] Festo Didactic Ltée, Principles of Doubly-Fed Induction Generators (DFIG), Quebec, 2015.
[18] Siemens Industry, Inc., “PSSE 34.2.0 Model Library,” Schenectady, NY, 2017.
[19] J. D. Glover, M. S. Sarma and T. J. Overbye, Power system analysis and design, Toronto: Thomson, 2008.
