Projects:2018s1-102 HF Radio Automated Link Establishment (ALE) Model
Contents
Project Team
Students
Surbhi Ahuja
Sandul Fernando
Blake Luetkens
Supervisors
Prof. Lang White
Paul Hirschausen
Introduction
The industry sponsor for this project, Codan - Radio Communications Division are a supplier of HF radio communication solutions to customers types such as hobbyists, humanitarian organisations and Australian military operations. HF communication enables communication between a transmitter and receiver unit by taking advantage of HF wave propagation characteristics, particularly the wave reflection with ionospheric layers in the ionosphere to enable over the horizon propagation - this is called Skywave propagation.
The 2018 group undertaking this project name will be continuing the work of work done on a 2G-ALE simulator that was delivered by a 2017 group under the same project name and sponsor. Our group aims to incorporate ionospheric prediction data and receiver station mobility into the 2G ALE simulator to provide Codan with quality of service statistics and indicators regarding achievable connection links and channel requirements.
The wiki of the 2017 group can be found here at 2017 HF Radio Automated Link Establishment (ALE) Model.
A mini project (stage 2) which is independent to the 2G-ALE simulator was also introduced to the group this year. Stage 2 of this project is to use an existing impedance matching box to develop a regression testing system which allows automatic selection of impedances and other parameters (Voltage, Temperature) for regression testing for Codan’s systems. There are a number of inductors & capacitors inside the impedance matching box which are all connected to relays. The microcontroller code controls what the relays are and the positioning of the relays. Aim of stage 2 is to rewrite the microcontroller code to give direct access to the impedance elements (minimum requirement). In addition, it would be ideal to develop a full regression testing system which incorporates various other test equipment (Power supply, Temperature Chamber Control).
Background
HF radio is still actively used and protocols (such as the new 4G ALE) that use HF communication continue to be actively developed. HF radio communication is critical for use in geographic locations without established communication infrastructure that are occupied by military personal or being aided by humanitarian groups. Protocols such as ALE ensure that no expert training is required for the operation of HF radios or knowledge of ionospheric conditions or effects on HF wave propagation.
The ionosphere is a layer of the atmosphere that contains electrically charged (ionised) particles and is located 60km - 1000km above the Earths surface. The ionosphere can be separated into multiple layers, each classified by density of these ionised particles and each layer can generally be described as having a different effect on wave energy absorption and reflection. As such the present state on the ionosphere plays a key role in the propagation of HF waves, it also varies greatly depending on various factors. The time of day, season, sun spot numbers and space weather conditions all greatly effect the ionospheric properties and the perversity of particular layers. For example the D layer at the ionosphere is typically no longer present during night time, and the F layer is distinct enough that is can be considered at 2 different layers, F1 and F2. The higher the frequency of a wave, the higher it's penetration capabilities through the ionosphere and thus the further it can travel in the ionosphere before it is reflected, it is possible that the energy is high enough in the wave such that the wave escapes the ionosphere, or low enough such that the wave is completley absorbed in the ionosphere. These 2 extremes outline the wide range of reflection possibilities.
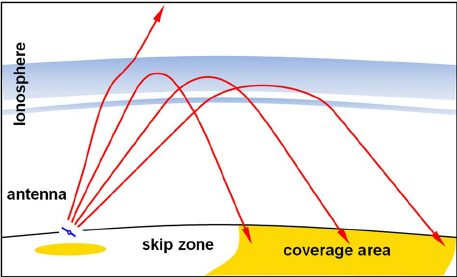
As discussed the ionosphere effects the available reflection paths between radio stations, another key component to the path available is the geographical location and distance between these 2 stations. Relative ionospheric effects vary depending on location on the Earths surface, and the distance between two stations define the number of available paths available between two stations for known frequencies and ionospheric effects. Figure 1 shows potential HF wave communication paths as a function of distance.
- Figure 1
Aims
The aims for each section in terms of project deliverables to Codan Radio Communications Division are itemised below.
Simulator with Ionospheric Prediction Data
- Incorporate ionospheric prediction data and provided SNR<->linking probability map into simulator.
- Output quality of service statistics at any point within a mobility region.
- Linking probabilities.
- Number of channels required to guarantee a particular level of service.
- Develop an efficient algorithm to minimise prediction software calls and simulation time while ensuring accurate results.
- Verify optimised results against complete data and full simulation runs and compare results and execution time.
- Visually represent linking probability within a known mobility region per available frequency and time of year.
Impedance Switching using a Re-purposed ATU
- Develop microcontroller code with functions capable of turning on specified relays that switch in reactances
- Confirm switched in reactances per enabled relay
- Create program on host computer that can switch on relays via a TTL - RS232 COM port connection
Markov Chains
Ionospheric Prediction Data
Ionospheric Prediction Software
Several ionospheric prediction software tools were considered for use in this project.
It was ultimately decided that the group would proceed with VOACAP due to it's more developed command line and configuration file functionality.
VOACAP Parser
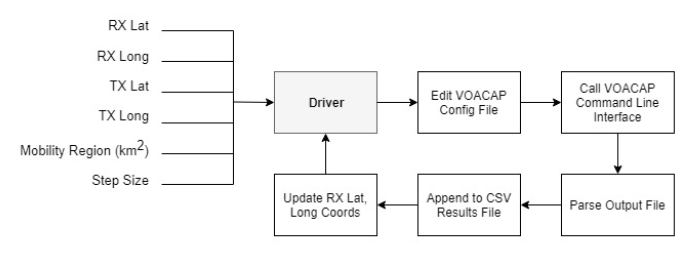
To extract data from VOACAP in an efficent way, a parser was developed in C++. This parser accepted the transmitter and receiver coordinates, a mobility region and desired step size and generated hourly, and monthly SNR statistics. A diagram explaining the input and process of the parser program is shown in Figure 2.
- Figure 2
Due to the relatively small coverage area that we will be considering, and the inherent inaccuracy already present in prediction tools, it was agreed upon to use flat earth equations to determine latitude and longitude coordinates.
Graphing SNR
Due to the dependence SNR would have on the linking probability and channel requirements, and based on the project requirement to visually represent the linking probability in terms of a mobility region. The group decided at this stage to determine the approach to graphing the data.
Matlab offers a C++ API that enables calls to be made from within the same central C++ codebase, it also was fast enough to manage millions of lines of data.
Our parsed data from VOACAP can be conceptually split into the following structure.
Month
       Hour
             Mobility Region
             (Changing RX Lat, RX Long coordinates)
                       Frequency and SNR pairs
Thus the result is (# of Frequencies * 24 Hours * # of Months) graphs. To obfuscate the amount of graphs and to ensure that the data was displayed in a clearly understandable way visually the group decided to use animated heatmaps that would cycle through the hours of the day, updating the contents as it cycled.
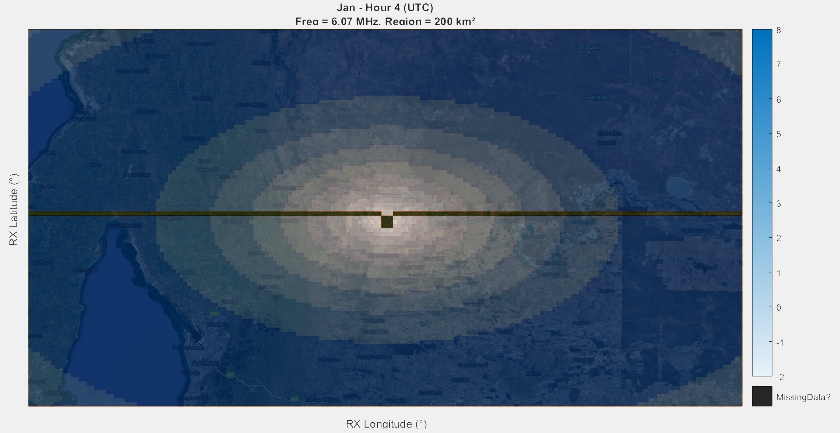
An example of a generated heatmap that demonstrates the coverage area as the receiver moves away from the transmitter. The starting point of both stations is the center of Figure 3.
- Figure 3


