Projects:2014s2-82 Grid Integration of Solar PV Embedded Generation
Contents
Project Information
Modeling and Probabilistic Analysis
Modeling
The power system uncertainty modeling includes models of power system demand, wind power generation and solar PV generation.
Power System Demand
Based on literature review the power system demand can be modelled by normal distribution. And the demand is normally varying in regions, in different dates and seasons, so for a regional demand the models are split up in a warmer and a cooler period, further, split up in weekdays and weekends. Meanwhile due to the high ambient temperature in warmer period, the demand curve is significantly different when the temperature is over 35℃, so for warmer period the demand model will be split up further by the temperature. And as an example, the 6 different types of mean value of demand curve from Metro Region are shown in Figure 1.
Wind Power Generation
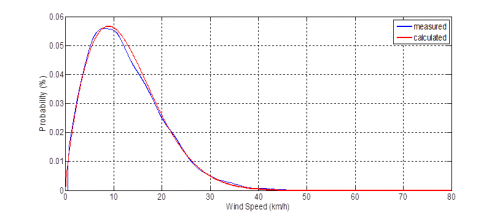
Based on literature review, wind speed in a region can be modelled by a two-parameter Weibull distribution. As an example, the measured probability density function of wind speed in Middle North Region and corresponding formulisation of Weibull distribution are shown in Figure2.
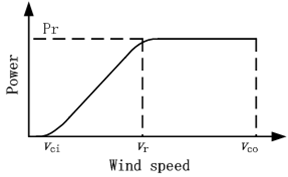
From Figure 2, the calculated curve is well matching the measured one which indicates the wind speed can be properly modelled by Weibull distribution. And non-linear model is used to build up the relationship between wind speed and output power which is shown in Figure 3.
Experiment and Data Analysis
Experimental Setup
Results
Conclusion
Outcomes
Future work
Team
Group members
Hang Yin
Kai Sun
Supervisor
Dr Rastko Zivanovic [1]
Sponsor
ElectraNet [2]


